Event Center
The Event Center is Guance's unified event query and analysis platform. It aggregates event data from multiple sources such as monitors, intelligent monitoring, SLOs, security monitoring, audits, and OpenAPI, providing capabilities for multi-dimensional filtering, detail viewing, and correlation analysis.
The Event Center is solely for event aggregation and querying; it does not generate events, configure rules, or send notifications. Events are independently generated by various source modules and automatically aggregated here.
Event Sources
| Source | Generation Method | df_source Value |
|---|---|---|
| Monitor | Triggered when detection rules configured in the monitoring module are met | monitor |
| Intelligent Monitoring | Automatically detected by AI algorithms for abnormal metric patterns | smartMonitor |
| Change Event | Records operational activity events in Kubernetes clusters that differ from expected patterns | change |
| SLO | Triggered when service quality objectives configured in the SLO module are breached | slo |
| Security Monitoring | Abnormal behaviors or vulnerability alerts detected by the security module | security |
| Audit Event | User operation records within the Guance platform | audit |
| Custom Event | Actively written via OpenAPI | user |
Event Content Composition
Event content is determined by the source system at the time of generation. The Event Center only displays it.
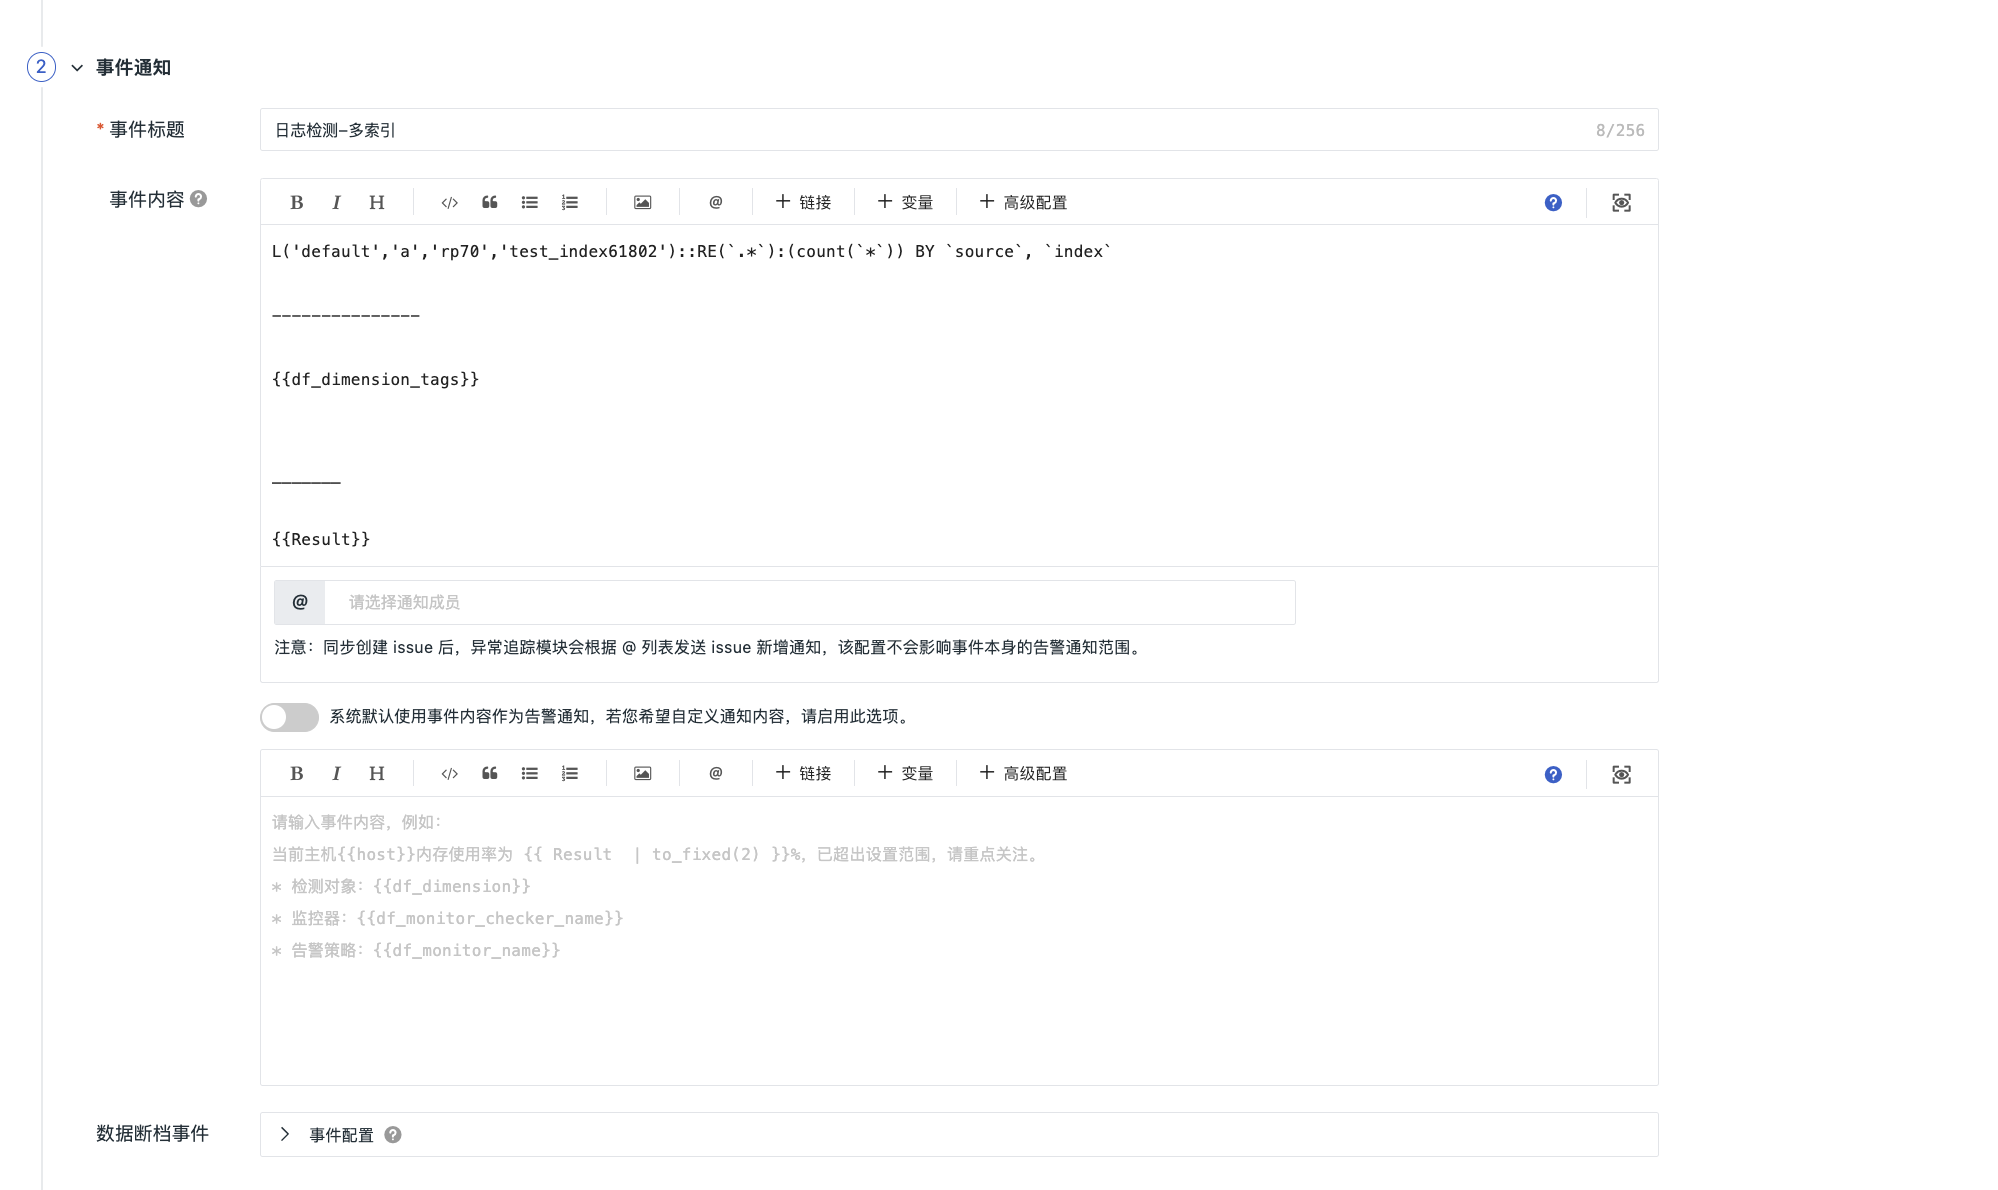
Taking a monitor as an example, event content is based on the template configured in Create > Event Notification, supporting dynamic population via variables:
| Variable (Example) | Description | Example |
|---|---|---|
{{Result}} |
Detection result value | 85.5 |
{{df_dimension_tags}} |
Event dimensions | {"host":"web01"} |
{{df_monitor_checker_name}} |
Monitor name | Host CPU Monitor |
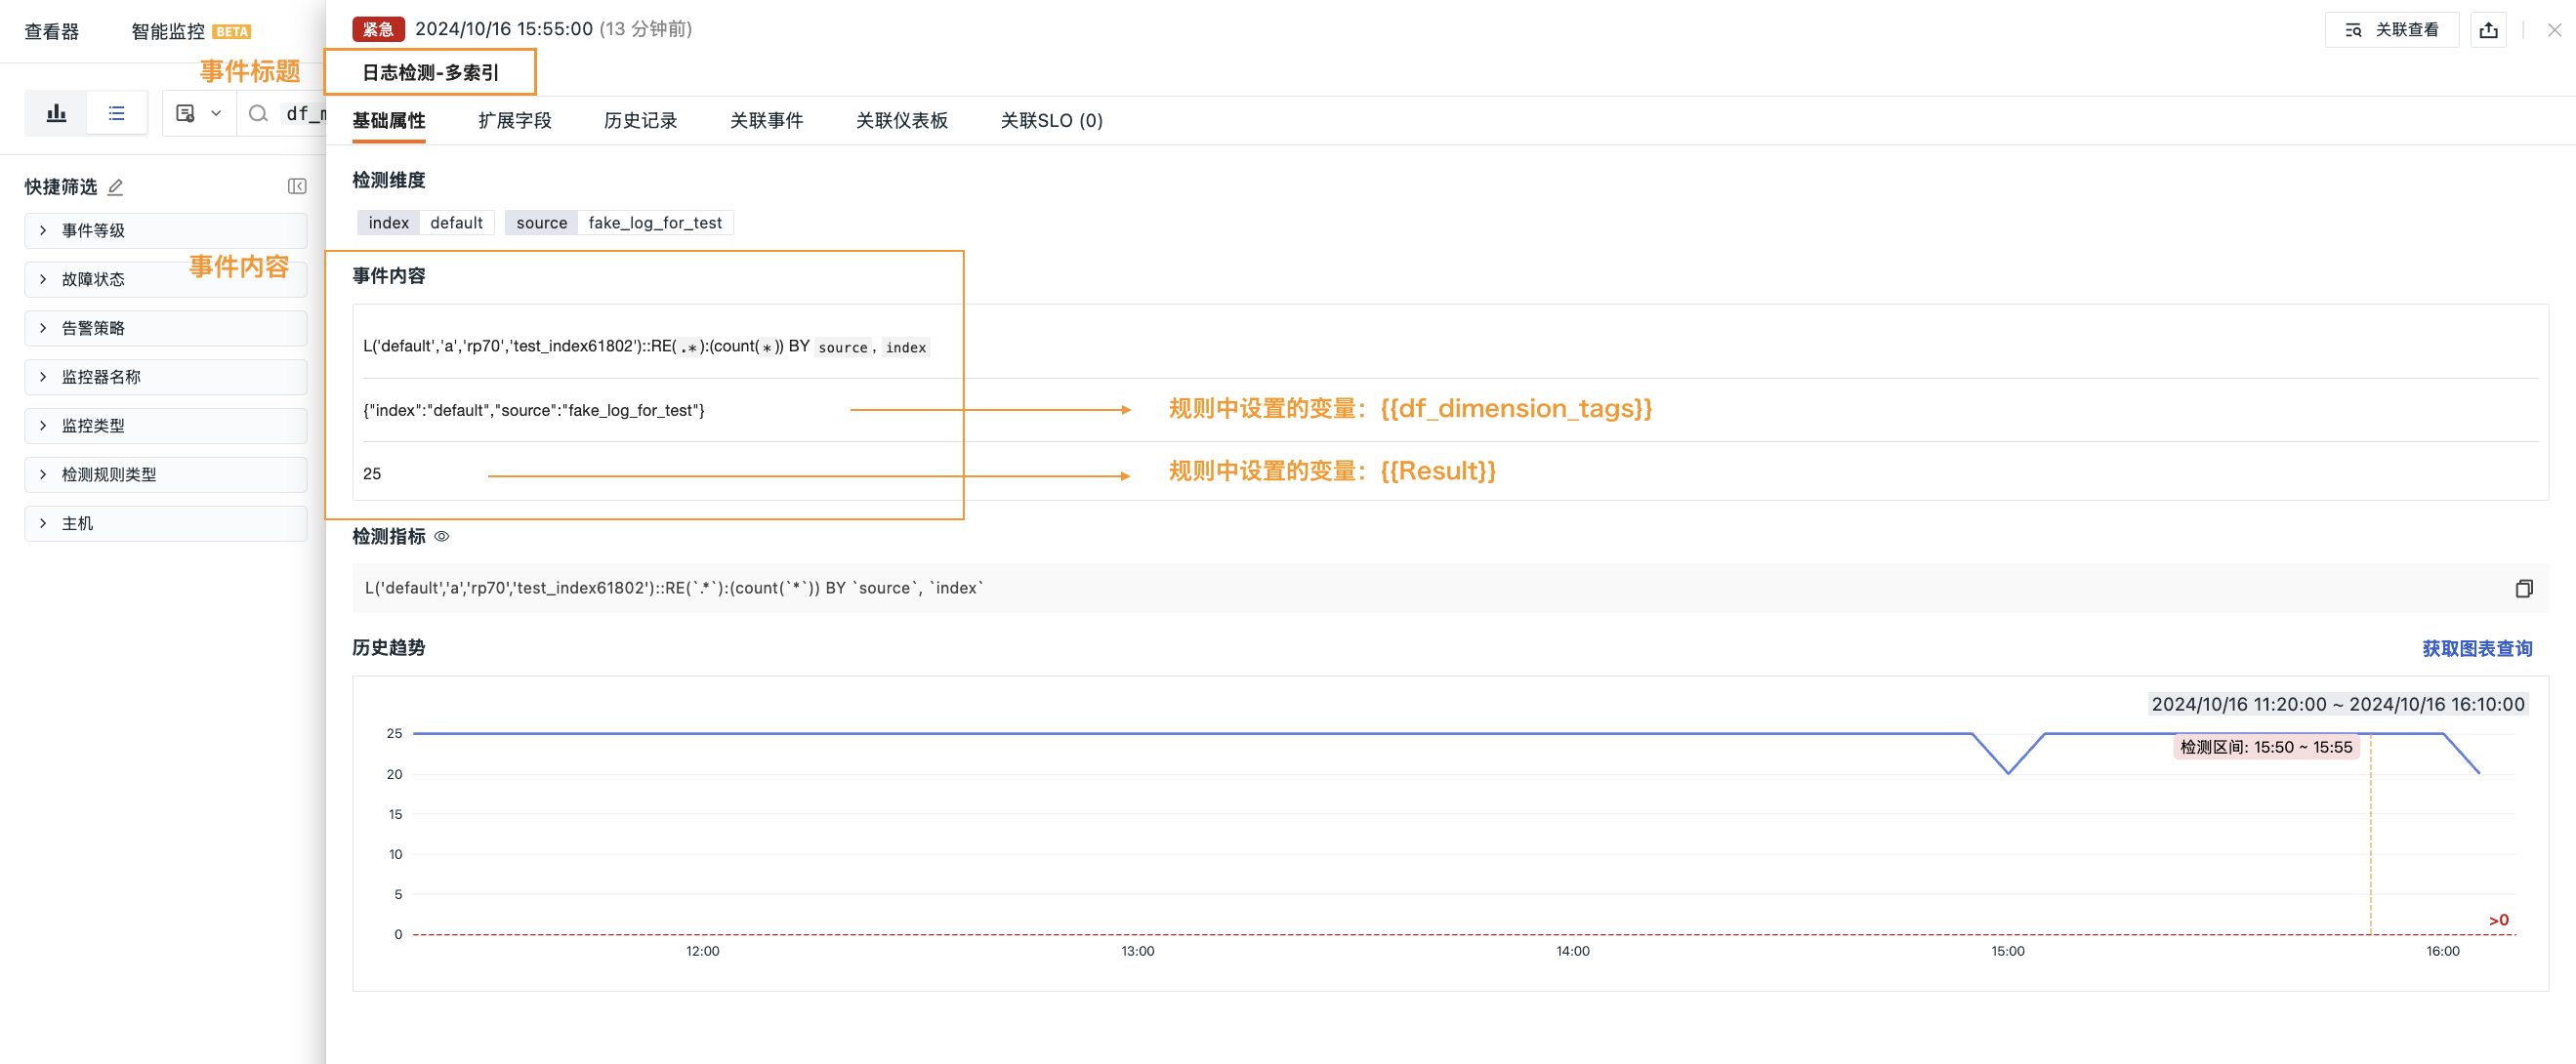
The system replaces variables with actual monitoring data to generate the final event content.
As shown in the figure below, the event title is defined as Log Detection - Multi-index, and the event content includes a DQL query statement and variables. The system will generate and display the final result based on actual monitoring data.
After a rule detects an anomaly, you can view the related event content in Event > Event Details.
Event Field Reference
Common Fields
Final event records generally include the following fields:
Field |
Description |
|---|---|
date / timestamp |
Generation time. Unit: seconds. |
df_date_range |
Time range. Unit: seconds. |
df_check_range_start |
Detection range start time. Unit: seconds. |
df_check_range_end |
Detection range end time. Unit: seconds. |
df_issue_start_time |
Time of the first failure occurrence in this round. Unit: seconds. |
df_issue_duration |
Duration of this round of failure, in seconds (from df_issue_start_time to this event). |
df_source |
Event source. Includes monitor, user, system, custom, audit. |
df_status |
Event status. Includes ok, info, fatal, warning, error, critical, nodata, nodata_ok, nodata_as_ok, manual_ok. |
df_sub_status |
Event detailed status (supplement to df_status). |
df_event_id |
Event unique ID. |
df_title |
Title. |
df_message |
Description. |
Monitor Event Specific Fields
When df_source = monitor, the following additional fields exist:
Field |
Description |
|---|---|
df_dimension_tags |
Detection dimension tags, e.g., {"host":"web01"}. |
df_monitor_id |
Alert policy ID. |
df_monitor_name |
Alert policy name. |
df_monitor_type |
Belonging type: custom for custom monitoring events, slo for SLO events, fixed as bot_obs for intelligent inspection events. |
df_monitor_checker |
Execution function name, e.g., custom_metric, etc. |
df_monitor_checker_sub |
Detection phase: nodata for those generated during data gap detection phase, check for those generated during normal detection phase. |
df_monitor_checker_id |
Monitor ID. |
df_monitor_checker_name |
Monitor name. |
df_monitor_checker_value |
Abnormal value when the event was generated. |
df_monitor_checker_value_dumps |
Abnormal value when the event was generated (JSON serialized). Facilitates obtaining the original value via deserialization for users. |
df_monitor_checker_value_with_unit |
Abnormal value when the event was generated (optimal unit). |
df_monitor_checker_ref |
Monitor association, only fields associated with the DQL statement of the detection configuration. |
df_monitor_checker_event_ref |
Monitor event association, only fields associated with df_dimension_tags and df_monitor_checker_id. |
df_monitor_ref_key |
Association Key for self-built inspections, used to correspond with self-built inspections. |
df_fault_id |
This round of failure ID, takes the value of the df_event_id of the first failure event. |
df_fault_status |
This round of failure status, a redundant field for df_status, df_sub_status, marking whether it's OK. Values: ok: Normal fault: Failure |
df_fault_start_time |
Start time of this round of failure. |
df_fault_duration |
Duration of this round of failure, in seconds (from df_issue_start_time to this event). |
df_event_detail |
Event detection details. |
df_event_report |
Intelligent monitoring report data. |
df_user_id |
Operator user ID during manual recovery. |
df_user_name |
Operator username during manual recovery. |
df_user_email |
Operator user email during manual recovery. |
df_crontab_exec_mode |
Execution mode, optional values. crontab manual |
df_site_name |
Current Guance site name. |
df_workspace_name |
Belonging workspace name. |
df_workspace_uuid |
Belonging workspace UUID. |
df_label |
Monitor labels, labels specified in the monitor are stored in this field. |
df_alert_policy_ids |
Alert policy IDs (list). |
df_alert_policy_names |
Alert policy names (list). |
df_matched_alert_policy_rules |
Alert policy names and all matched rule names (list). |
df_channels |
List of incident channels the event belongs to. |
df_at_accounts |
@account information. |
df_at_accounts_nodata |
@account information (data gap). |
df_message_at_accounts |
Detailed list of @users in failure alert messages. |
df_nodata_message_at_accounts |
Detailed list of @users in data gap alert messages. |
df_workspace_declaration |
Workspace attribute claims. |
df_matched_alert_members |
List of all matched alert notification member information when sending by member is selected. |
df_matched_alert_upgrade_members |
List of all matched alert escalation notification member information when sending by member is selected. |
df_matched_alert_member_groups |
All matched member group names when sending by member is selected. |
df_charts |
Chart information appended when charts are added in monitor configuration and this alert event requires message sending. |
df_alert_info |
Records alert notification information. |
df_is_silent |
Whether the event is muted, takes string values "true" / "false". |
df_sent_target_types |
List of non-duplicate alert notification target types already sent for this event. |
df_check_targets |
Records detection time and detection metrics from monitor configuration. |
df_check_condition, df_check_condition_expr |
Records trigger rules from monitor configuration. |
df_check_rules |
Records detection count and detection rules from monitor configuration. |
df_check_targets |
Records detection time and detection metrics from monitor configuration. |
df_check_condition |
Records trigger rules from monitor configuration. |
df_check_interval |
Records detection frequency from monitor configuration. |
df_fault_end_time |
Records failure recovery time. |
Audit Event Specific Fields
When df_source = audit, the following additional fields exist:
| Field | Description |
|---|---|
df_user_id |
Operator user ID. |
df_user_name |
Operator username. |
df_user_email |
Operator user email. |
| {Other fields} | Other fields based on specific audit data requirements. |
Custom Event Specific Fields
When df_source = user, the following additional fields exist:
| Field | Description |
|---|---|
df_user_id |
Creator user ID. |
df_user_name |
Creator username. |
df_user_email |
Creator user email. |
| {Other fields} | Other fields generated based on user operations. |
Event Query and Viewing
The Event Center provides multiple explorers to meet event query and analysis needs in different scenarios.
| Event Viewing Dimension | Description | Core Capabilities |
|---|---|---|
| All Events | Full event query | Summarizes and displays all source event data within the current workspace. Supports list/chart display modes, providing multi-dimensional filtering, search, export, save snapshot, etc. |
| Unrecovered Events | Active failure tracking | Centrally displays events with df_status != ok from the last 48 hours, aggregated by df_fault_id to show failure duration. |
| Change Events | K8s Change Audit | Records operational activity events in Kubernetes clusters that differ from expected patterns, showing configuration differences before and after changes. |
| Intelligent Monitoring Events | AI Anomaly Viewing | View abnormal pattern events detected by intelligent monitoring algorithms, including analysis reports, alert notifications, and historical records. |
| Event Details | Single Event Deep Analysis | Click any event to enter, view complete information including basic attributes, extended fields, alert notifications, historical records, related events, associated SLOs, etc. |
Further Reading
After understanding the basic concept of "events", you may need: