Dashboards
Dashboard displays related visual reports on the same interface, and builds data insight scenes through multidimensional data analysis. You can start building visual scenes by customizing a new blank dashboard or importing a custom template. By adding charts, time controls, keyword search and tag filters, you can comprehensively monitor data metrics from different sources.
Create Dashboard
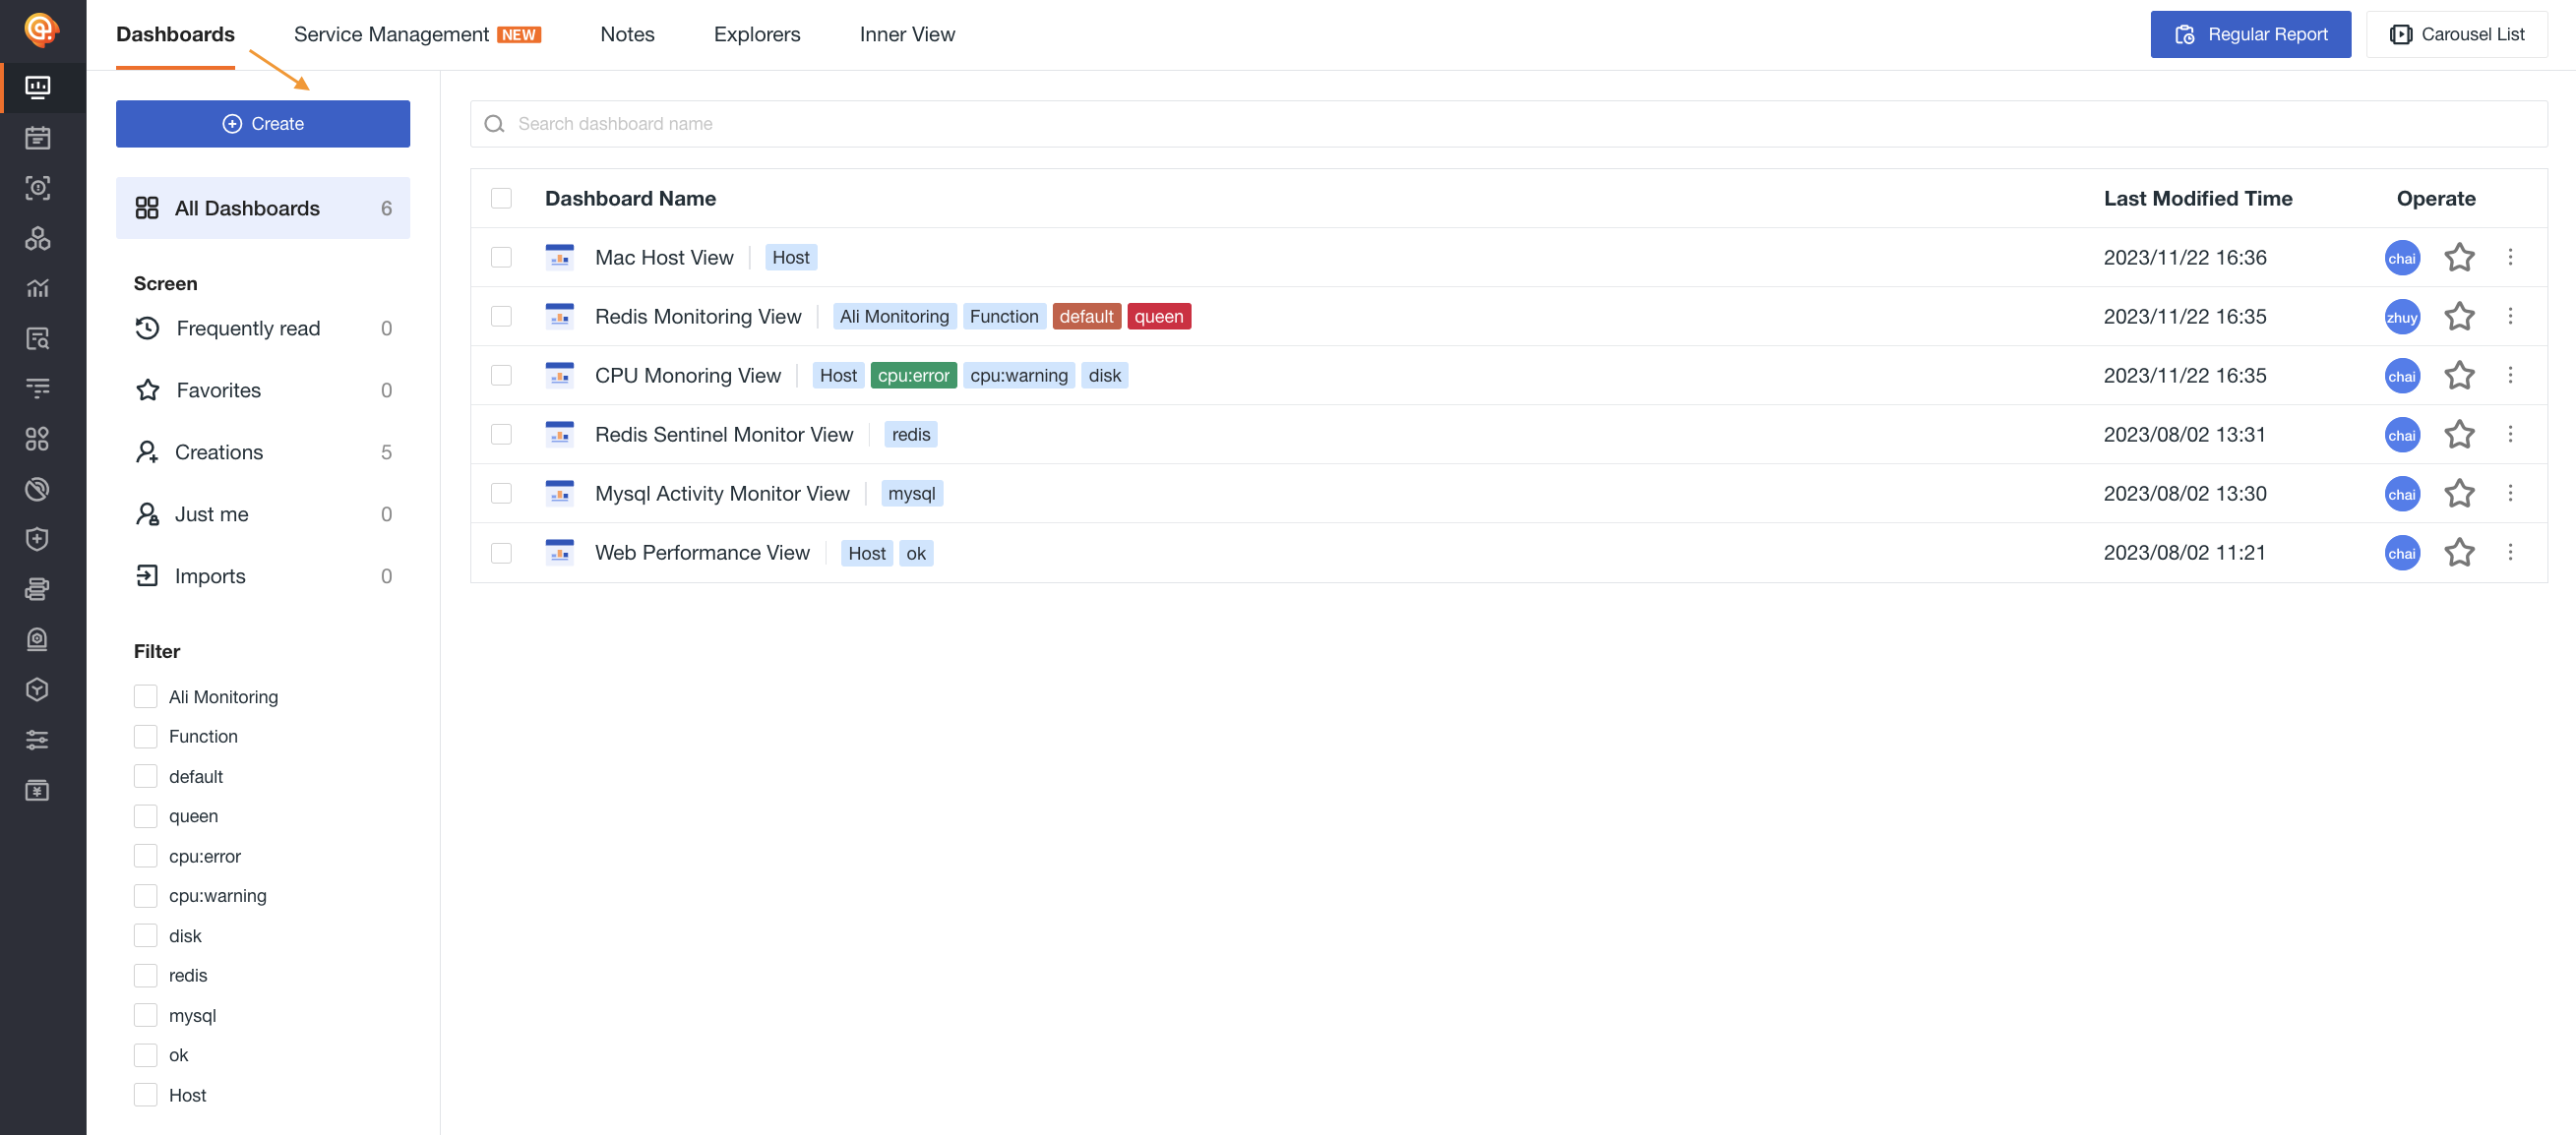
I. Enter Scenes > Dashboard > Create:
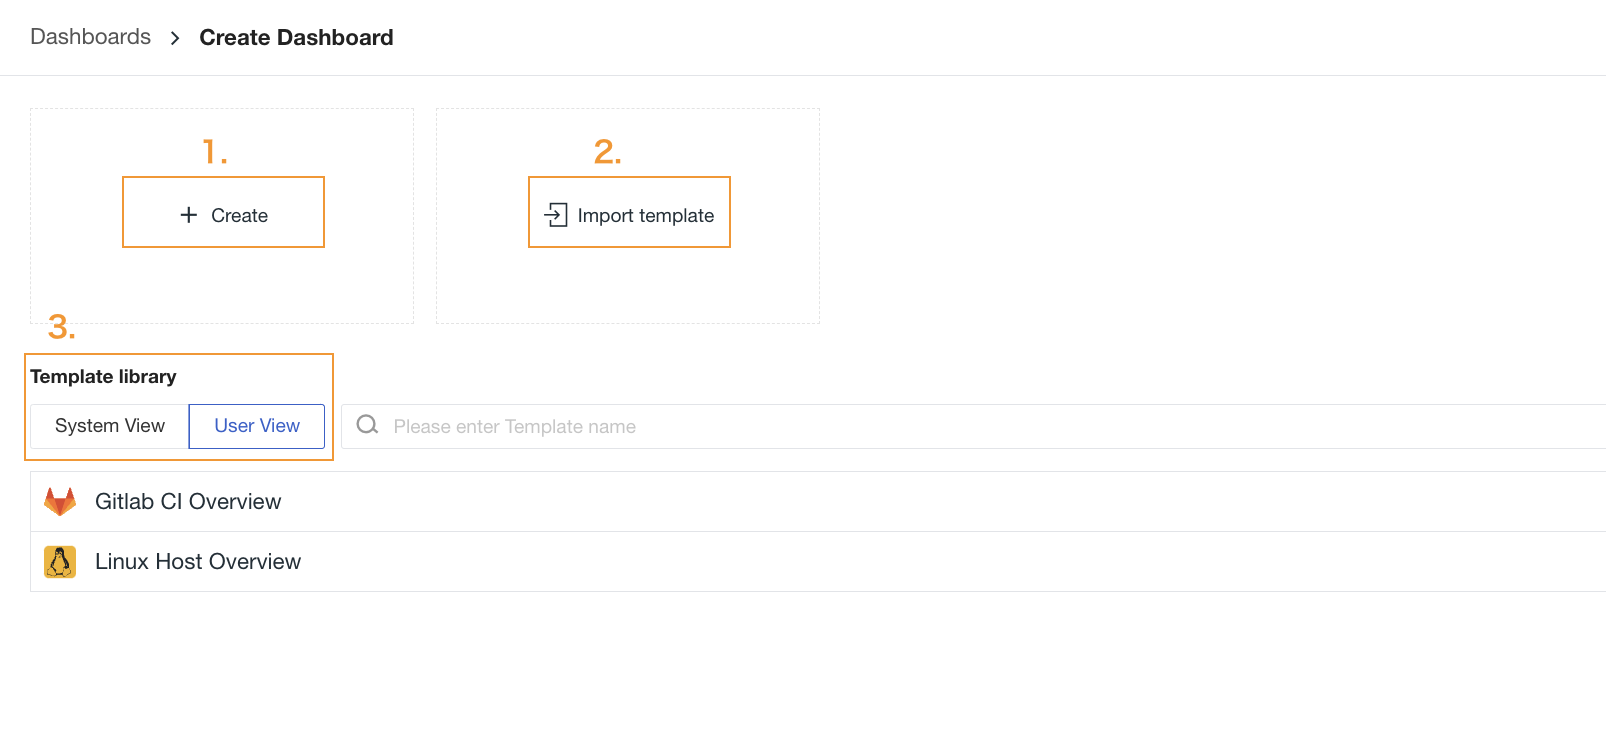
II. Select a view template:
- Blank dashboard: That is, create a blank dashboard and then customize the chart in the dashboard;
- Import template: Import custom view template JSON file;
- Template library: Including System View and User View. Both support custom change configuration. Through the keyword search bar on the right side, you can also quickly retrieve the required templates from the existing templates.
III. Customize labels:
When creating or modifying a dashboard view, you can add custom labels to the dashboard to facilitate grouping and managing related dashboards.
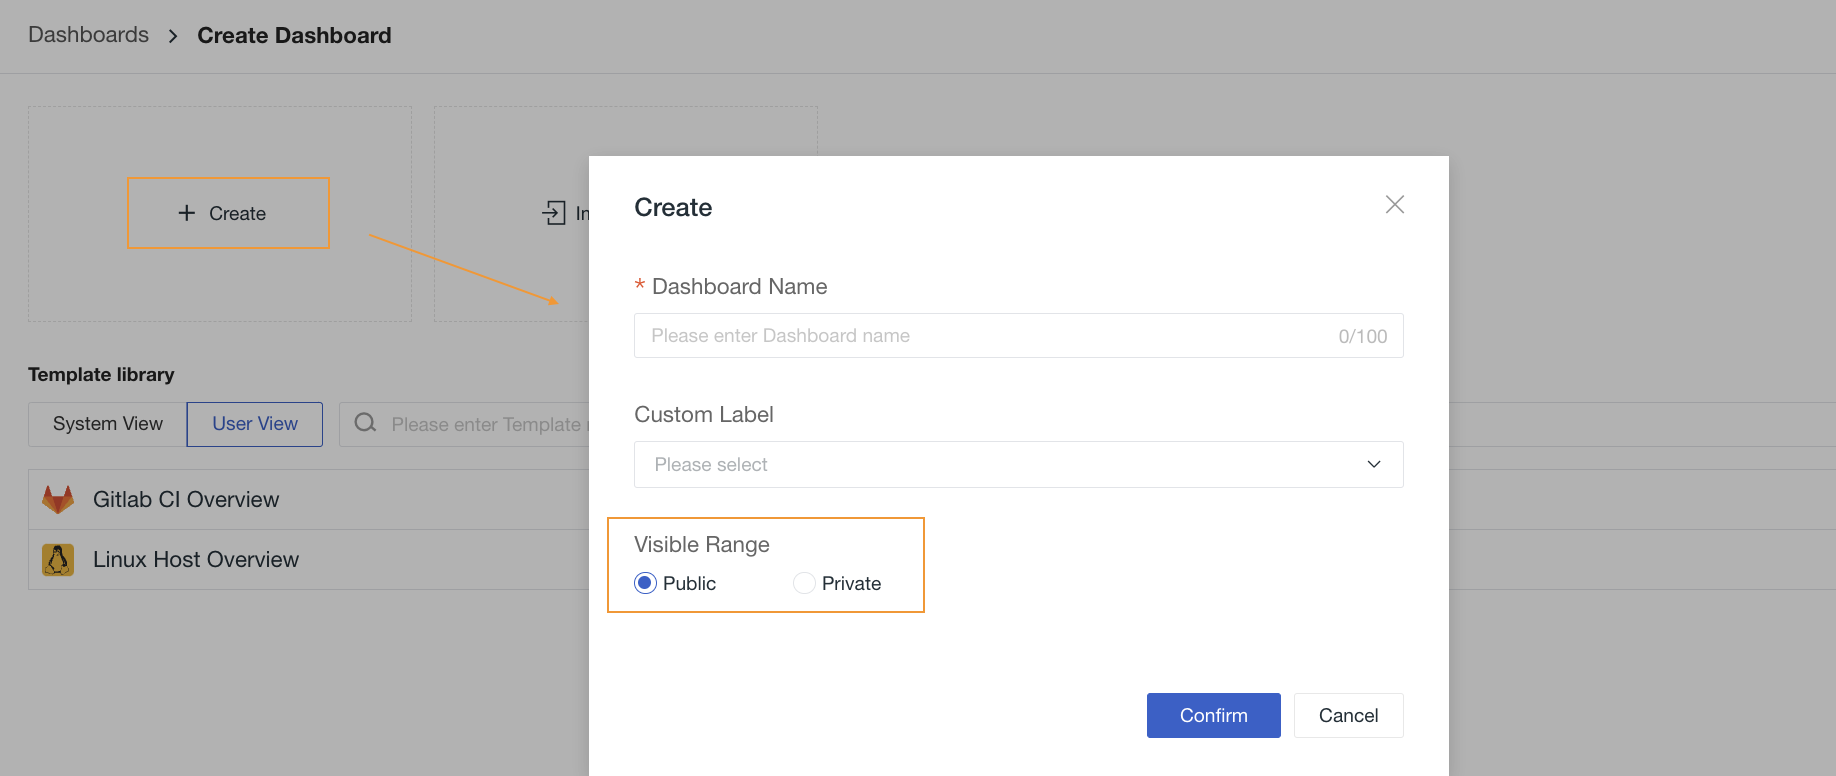
IV. Select visible range:
The dashboard creator can customize the viewing permissions of the current dashboard, including "Public" and "Private".
- Public: open to all members in the workspace, and the viewing and editing rights of other members are not affected;
- Private: be viewed only by the dashboard creator, and other members do not have permission to view it.
Note: Non-public dashboard shared as a link is not visible to non-creators.
V. Click Confirm to create a dashboard directly.
Add Chart
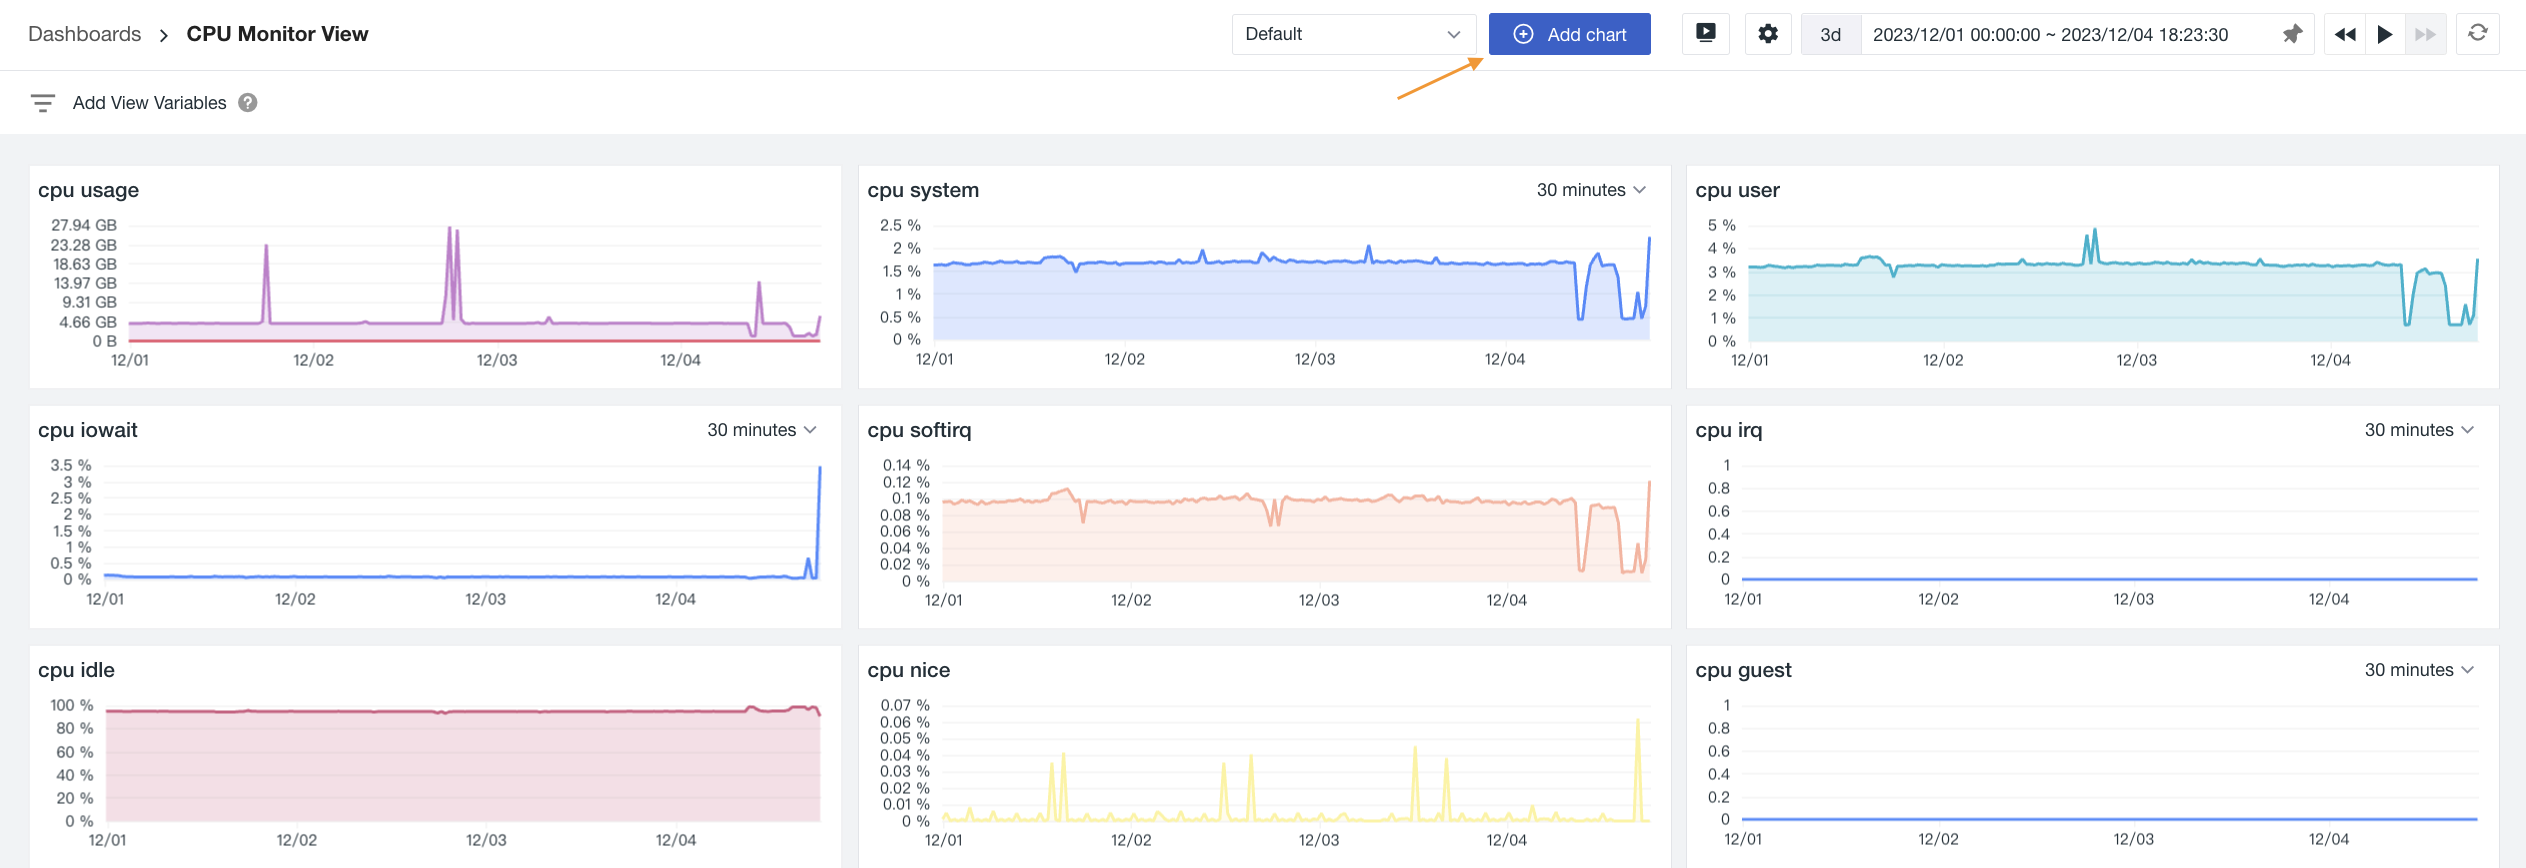
After the dashboard is created, After the dashboard is created, click Add Chart in the upper right corner to add a new chart for the dashboard.
You can add global variables to the chart to complete the dynamic filtering of the chart. See View Variables.
Cross-Workspace Query
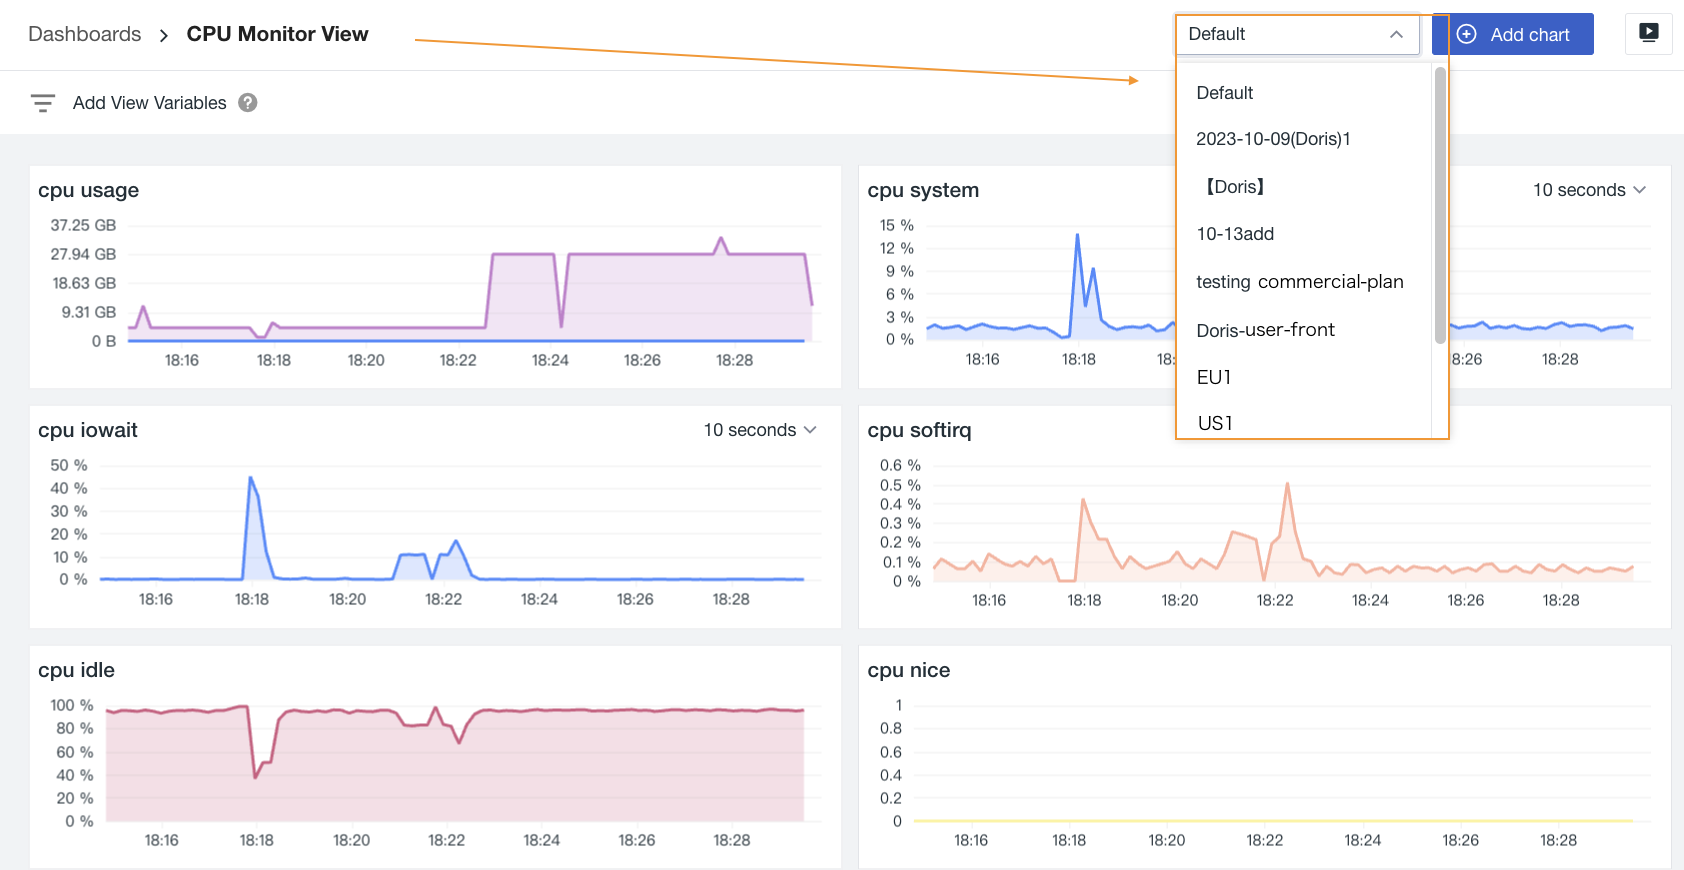
If a workspace is granted access to other workspaces, you can switch workspaces on the dashboard to view the corresponding chart information.
Note: If the chart in the dashboard is already configured with a workspace query, it takes precedence over the dashboard/explorer global configuration.
Full-screen
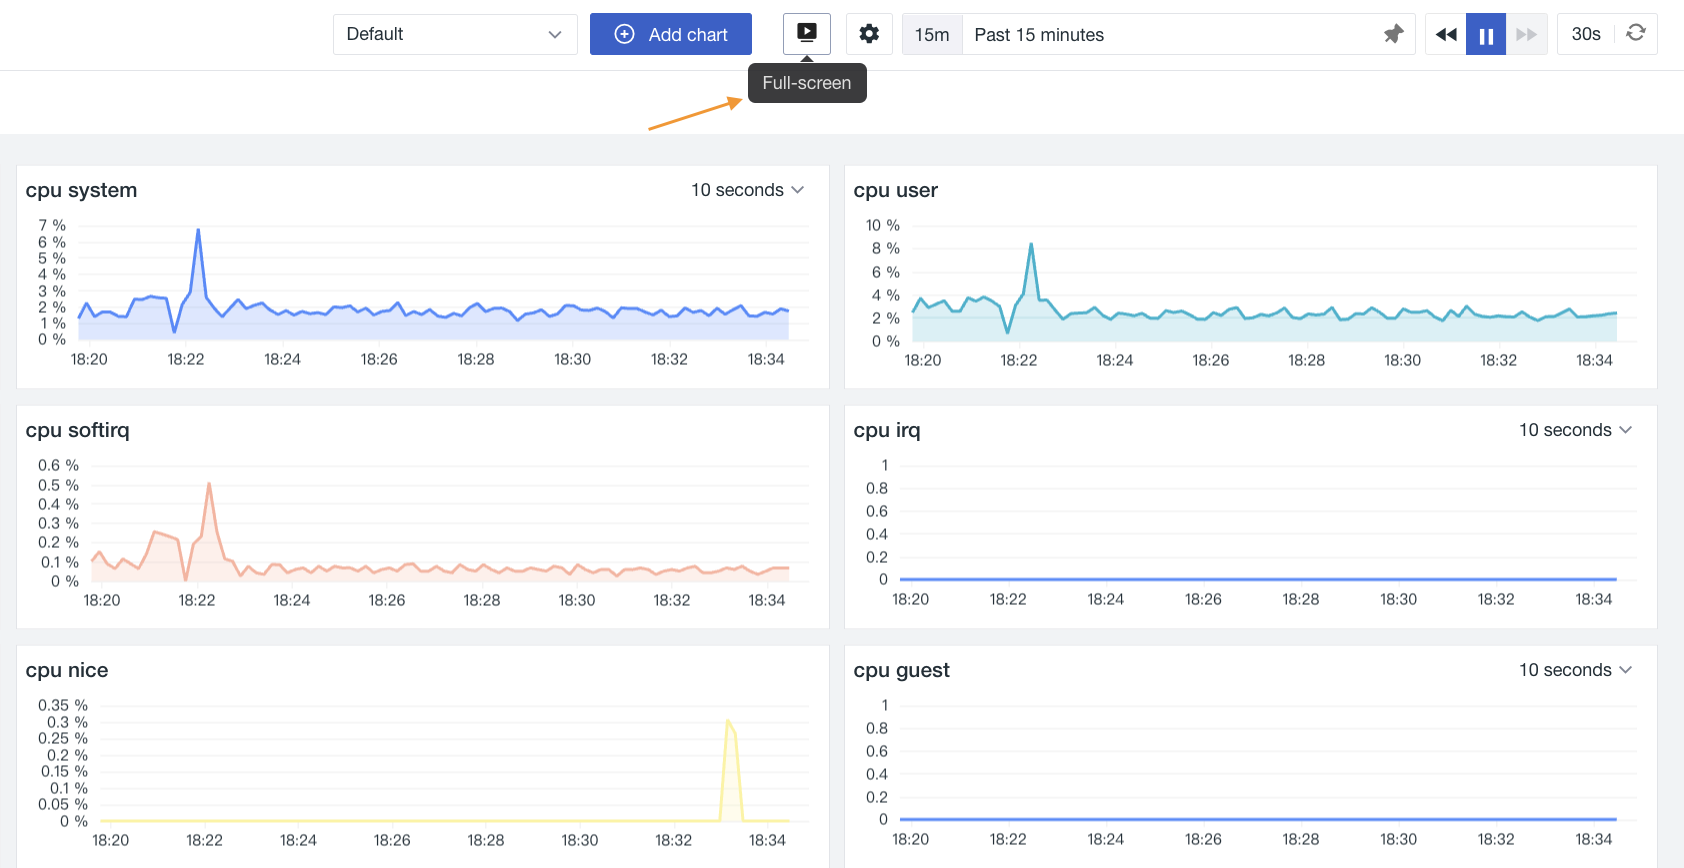
On the dashboard, click Full-screen and Guance will automatically help you fold the left and top navigation bars and display the view in full screen. Click ESC on your keyboard to exit the current screen.
Time Widget
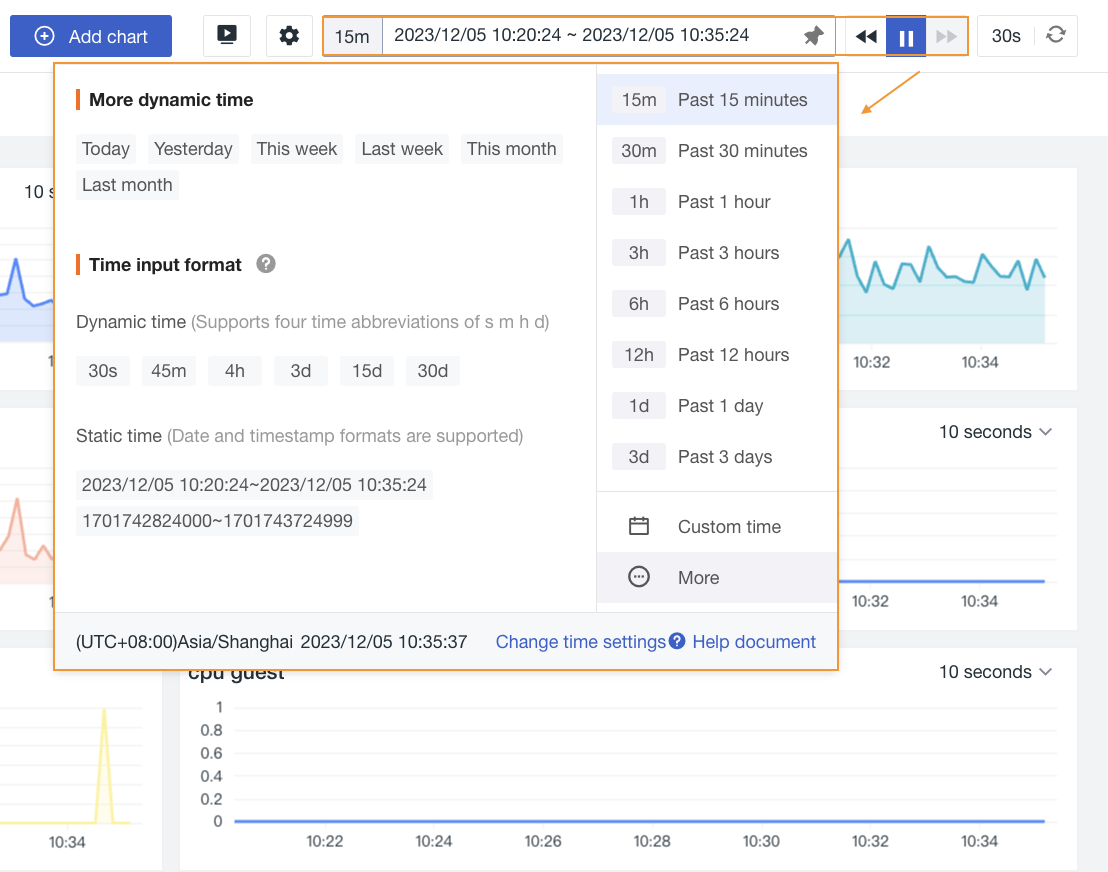
Guance supports controlling the data display range of the current dashboard through time widget. You can manually enter the time range, quickly select the built-in time range of the current dashboard, or set the time range by customization.
Refresh
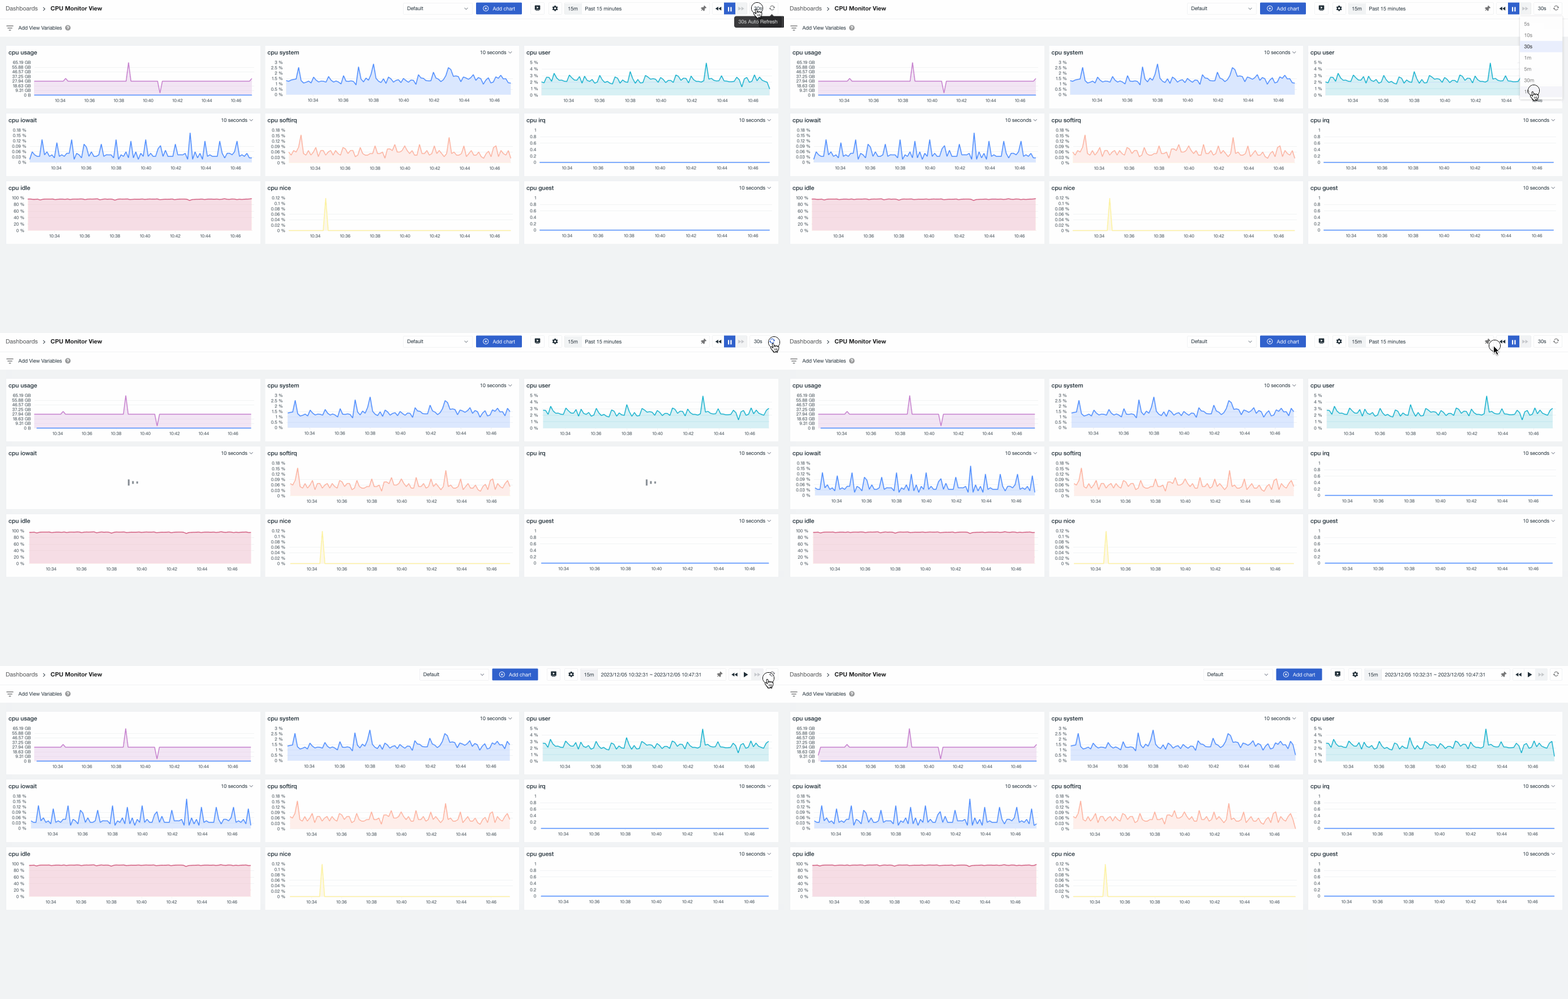
To quickly obtain real-time explorer data, Guance provides a refresh function within the explorer. You can perform the following actions:
- When automatic refresh is enabled:
- You can choose the automatic refresh time, including 5s/10s/30s/1m/5m/30m/1h; 30s is selected by default.
- You can manually refresh by clicking on the icon.
- When automatic refresh is disabled, you can manually refresh by clicking on the icon.
Note: The settings for the refresh functionality here do not conflict with the Explorer Auto Refresh.
Settings Inside
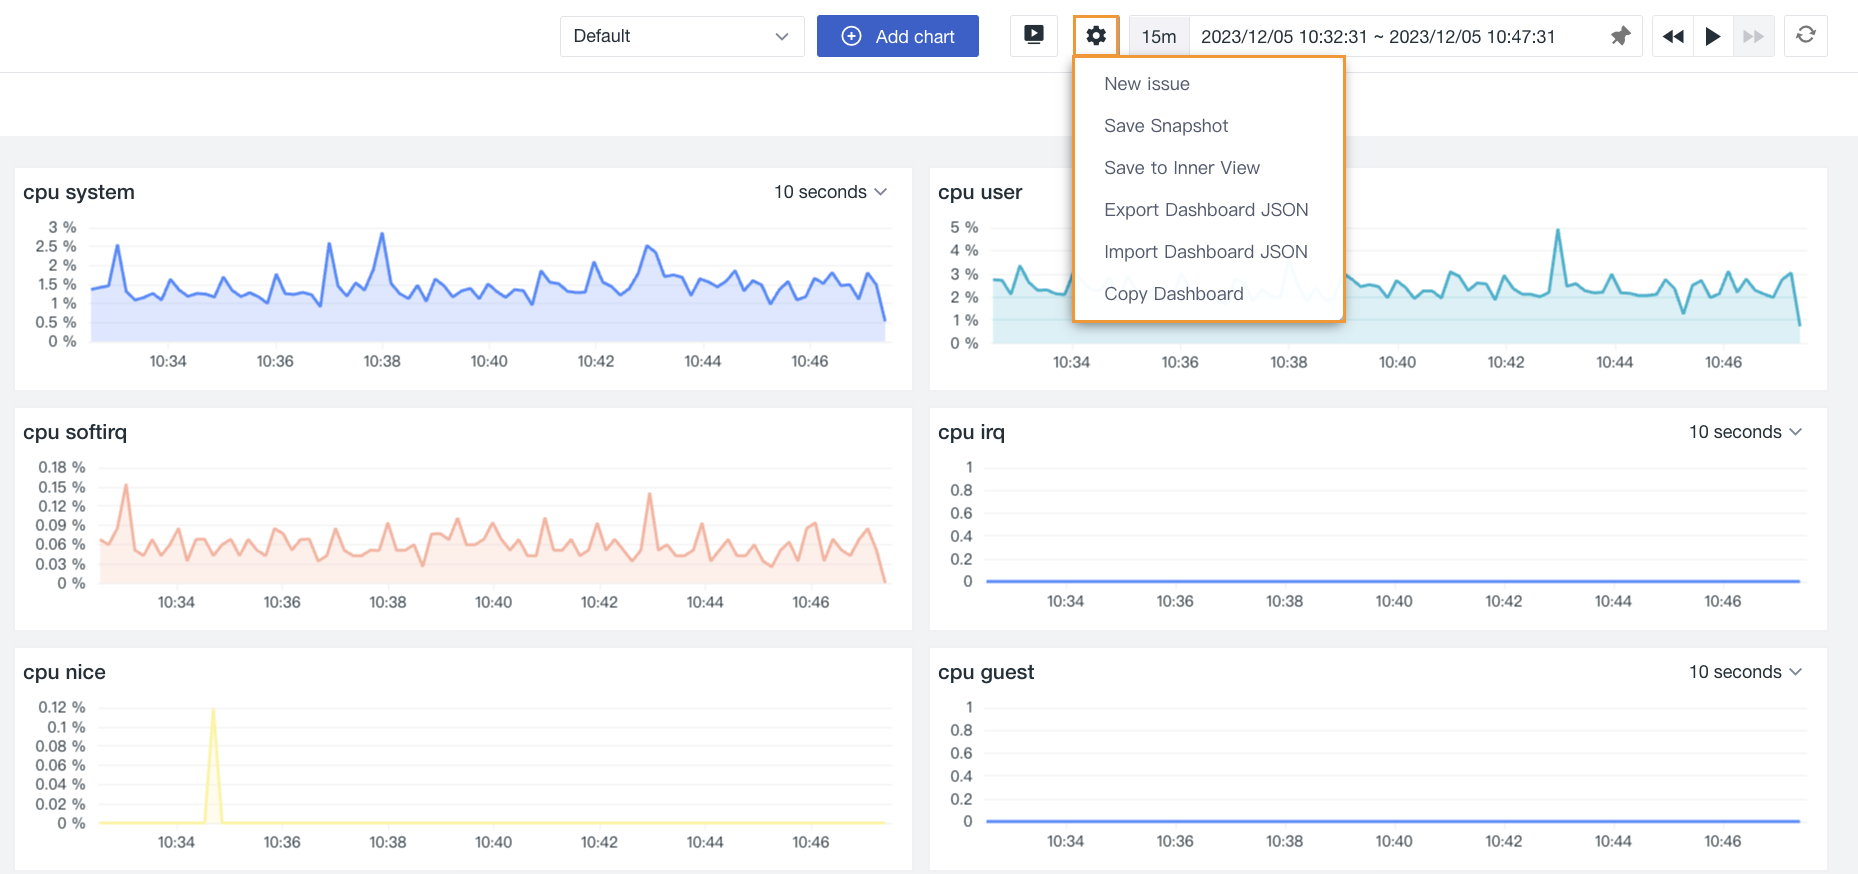
After the dashboard is created, click the button , you can perform the following operations.
New Issue
You can create an exception observed in the current dashboard as an Issue.
See How to Manually Create an Issue at the View Level. See Incidents for more details on Issues.
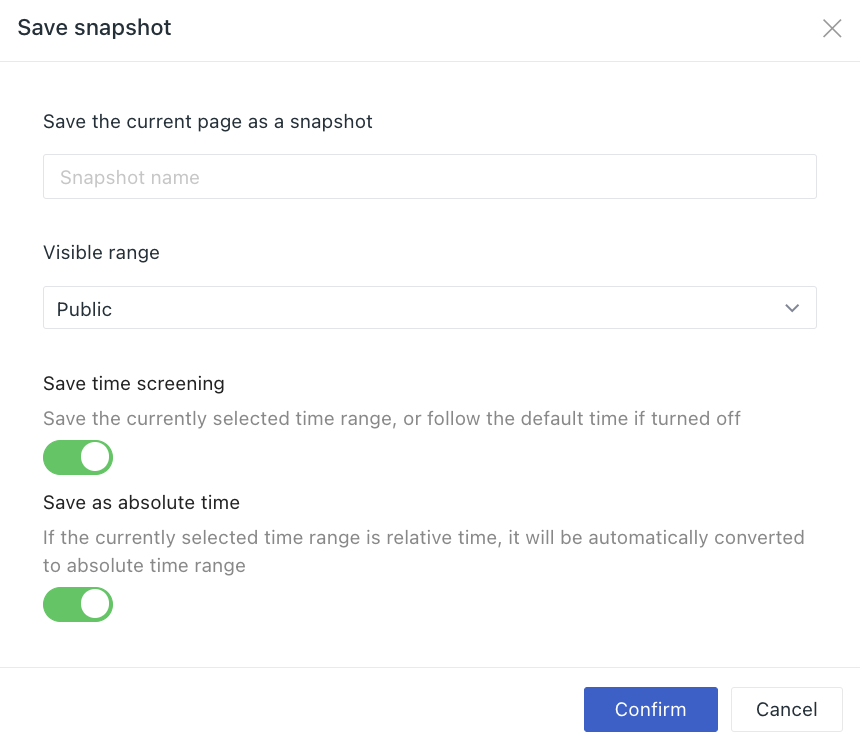
Save Snapshot
You can save a snapshot for the current dashboard by using the shortcut key (Windows: Ctrl+K / Mac OS: Cmd+K) in the dashboard to quickly save the snapshot, or choose to save it by clicking Save Snapshot.
See Snapshot for more details.
Save to Inner View
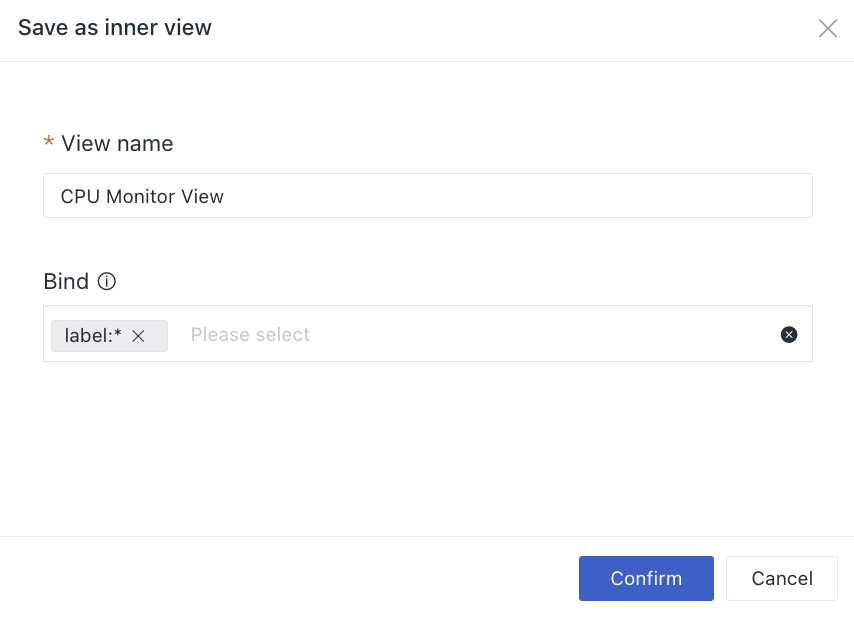
For example, save "CPU Monitor View" to Inner View. When you save the dashboard view to the inner view, you can select the binding relationship, and select the binding relationship "label".
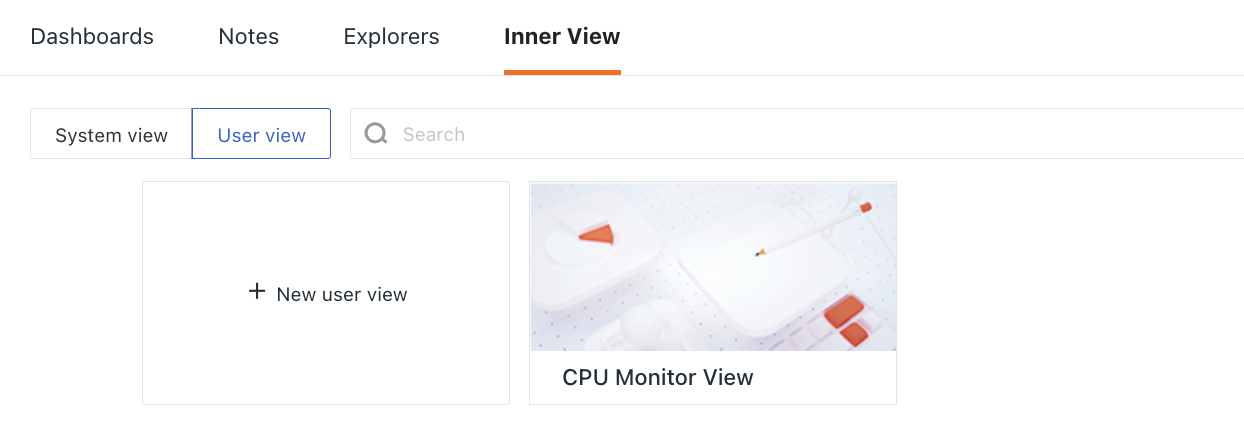
After saving to the Inner View, you can view it in the Scenes > Inner View > User View.
Note: Renaming of user views under the same workspace is not allowed.
Also, since the binding relationship label:* is set, "CPU Monitor View" can be viewed on the details page of Host and Container whose infrastructure has set the Label.
See Inner View for more information.
Export/Import Dashboard JSON
Click the button to export or import JSON files to overwrite the current dashboard.
Note: Importing dashboard JSON will overwrite the original dashboard, and once overwritten, it cannot be restored.
Copy Dashboard
Enter the name of the copied dashboard in the pop-up dialog box, and click Confirm to view the copied dashboard view in the dashboard list.
List Operations
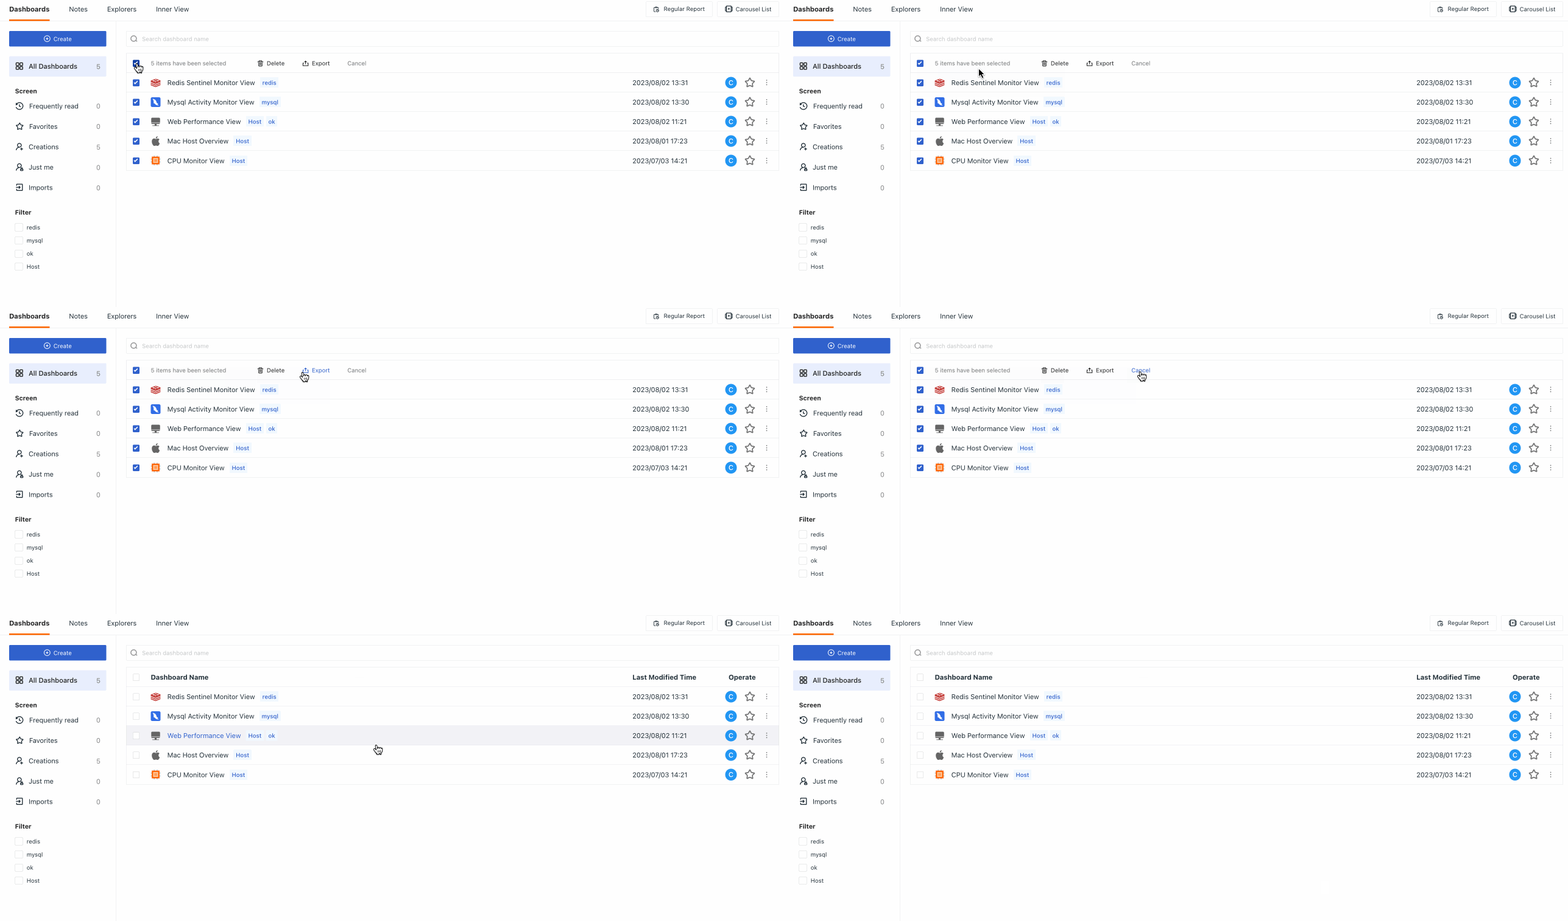
Batch Operation
In the dashboard list, you can bulk delete or export specific dashboards.
Homepage Dashboard
Click on the dashboard button, you can set up the workspace-level Homepage Dashboard. After setup, subsequent users accessing this workspace will default to the Homepage Dashboard.
Note: Only supports setting the "Public" visible dashboard as the Homepage Dashboard, and once set, the visibility range cannot be modified.
Modify/Export/Delete
Click the button and you can change the name for the dashboard, export the dashboard to a JSON file and delete dashboard.
Filter
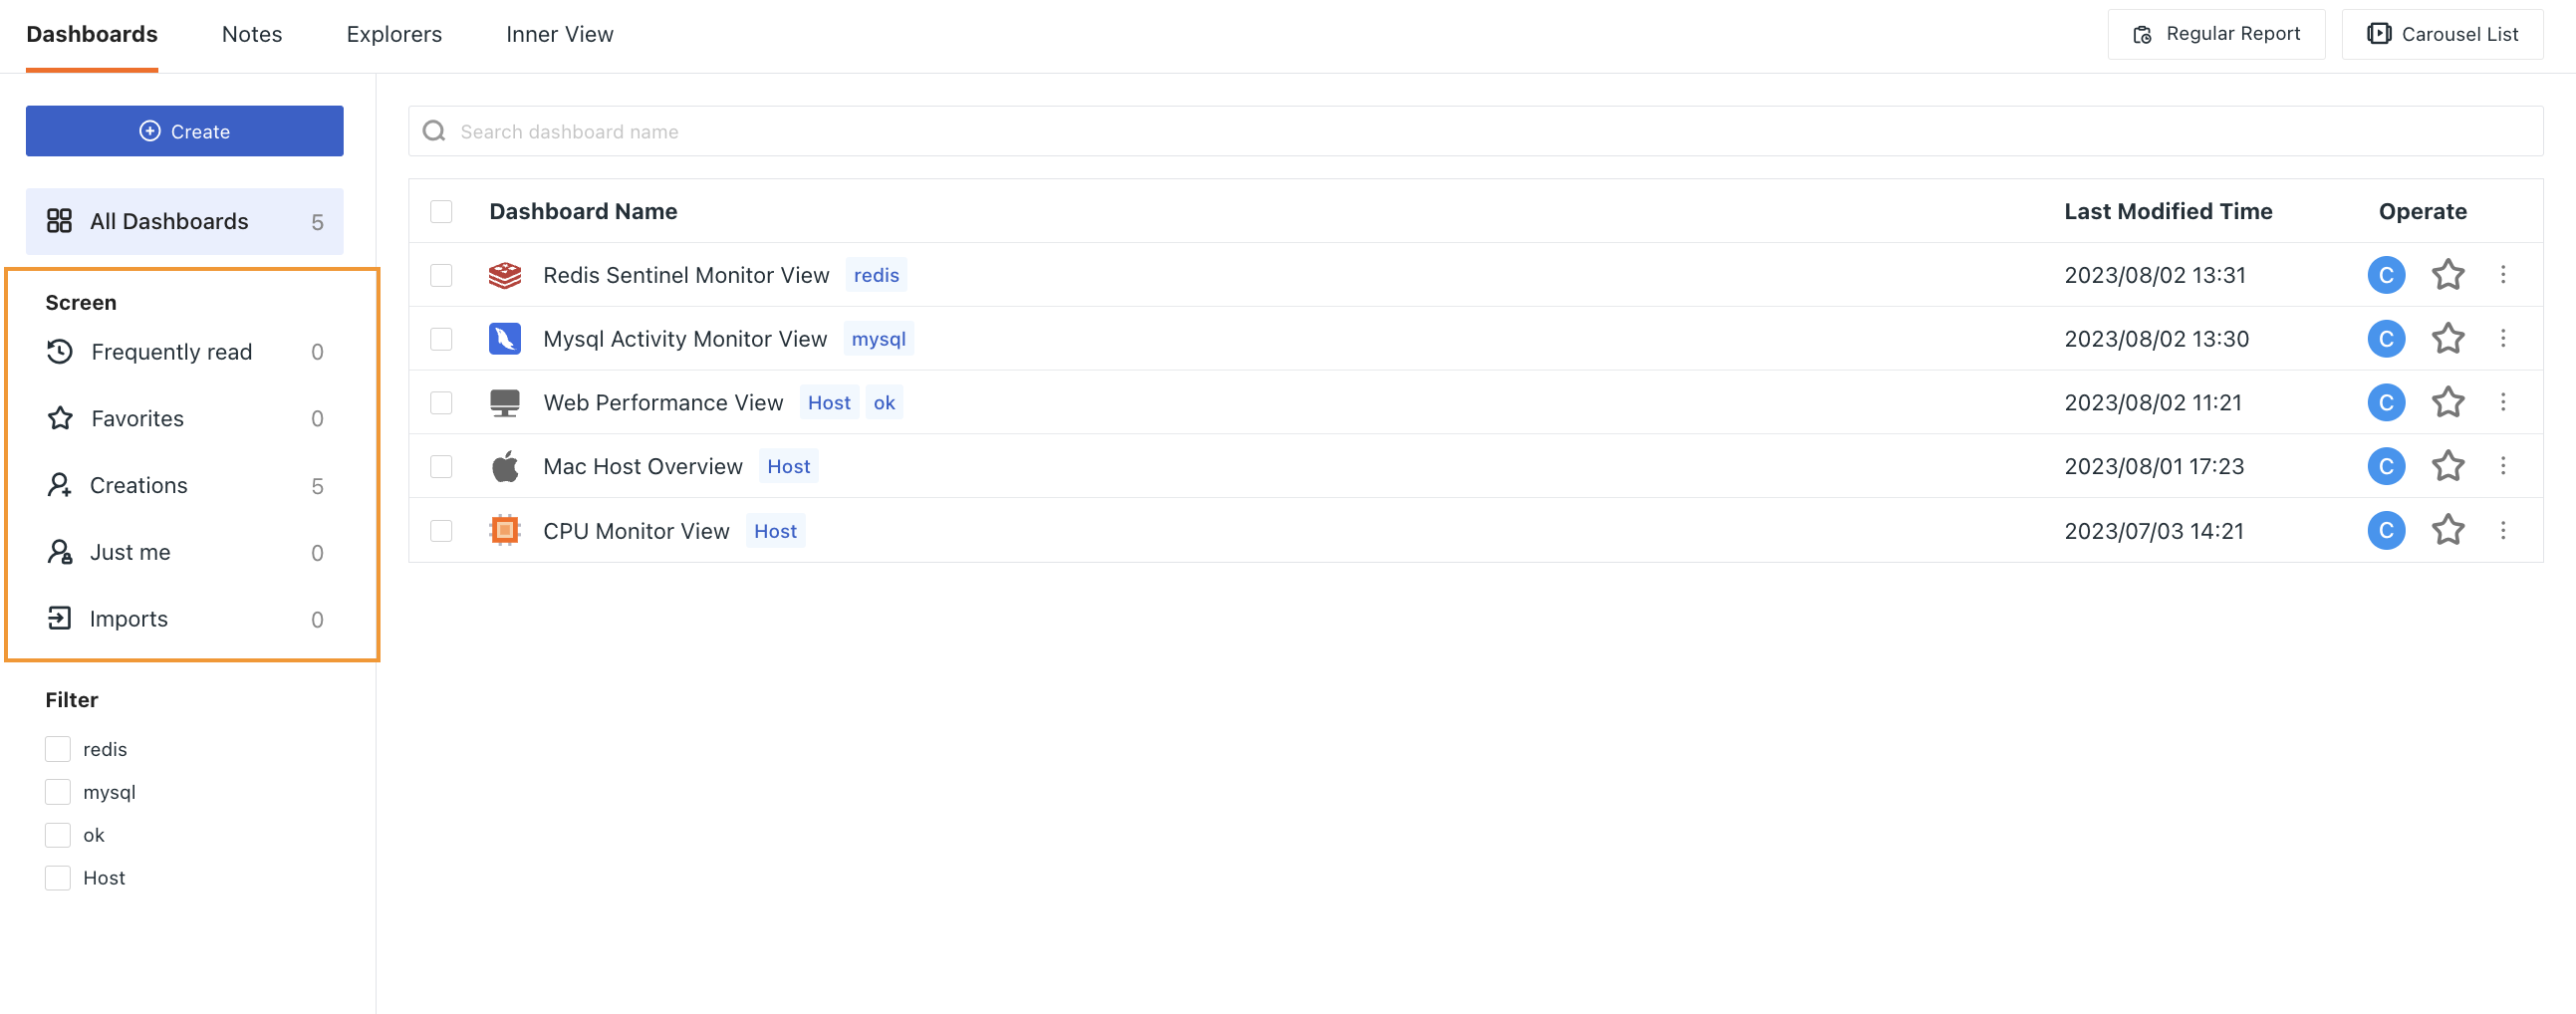
On the left side of the dashboard, you can quickly filter and find the corresponding dashboard through Favorites, Imports, Creations, Just me and Frequently read; You can also quickly filter the dashboard by setting labels for the dashboard.
Operation |
Description |
|---|---|
| Favorites | The current user's favorite dashboard, click the dashboard favorite icon . |
| Imports | All dashboards created by importing custom templates in the current workspace. |
| Creations | All dashboards created by the current user, including imported dashboards. |
| Just me | Private dashboards that can be viewed only by the dashboard creator, and other members do not have permission to view it. |
| Frequently read | Dashboards that the current user browses more than 5 times a week. |
Carousel List
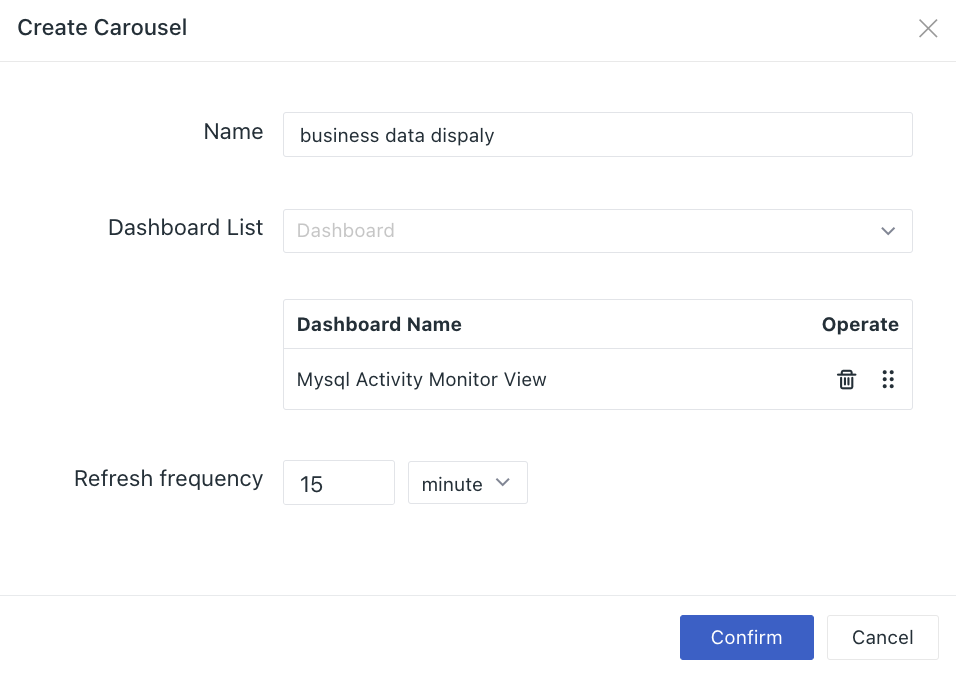
Guance provides carousel function for multiple associated business dashboards, which can be displayed on a large screen after setting up.
Click Carousel List on the right side to create and enter necessary info:
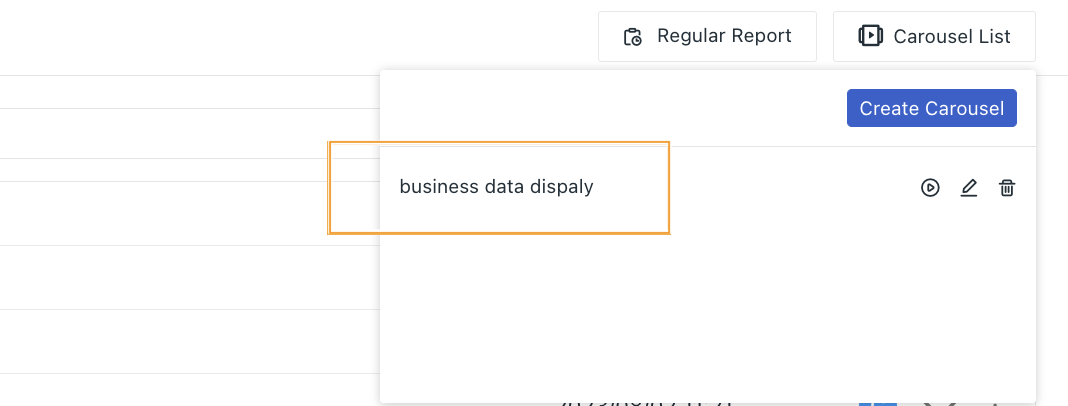
Once the configuration is complete, you can view the set up dashboard in the Carousel List. Click the button on the right, and the configured dashboard will play according to the set frequency.
