JMX
Definition of JMX
Definition of JMX
Java Virtual Machine (JVM) provides a complete framework for operational management and monitoring, known as JMX (Java Management Extensions). JMX is an abbreviation for Java Management Extensions and refers to an extended framework for managing Java. The JMX technology defines a complete architecture and set of design patterns for monitoring and managing Java applications. The foundation of JMX is the managed bean (MBean), which represents resources within the JVM. MBeans are instantiated through dependency injection. Since MBeans represent resources in the JVM, they can be used to manage specific aspects of applications or more commonly, to collect statistical data related to resource usage.
The core of JMX is the MBean server, which acts as a medium connecting MBeans, applications within the same JVM, and the outside world. Any interaction with MBeans is done through this server. Typically, only Java code can directly access the JMX API, but there are adapters that can convert this API into standard protocols—for example, Jolokia can convert it into HTTP.
JMX enables the export of runtime data status within the VM. By encapsulating runtime data into MBeans and managing them uniformly through the JMX Server, external programs can obtain the data via RMI.
In short, JMX allows external programs to retrieve runtime data via the RMI protocol, providing a window for us to monitor and manipulate internal VM data.
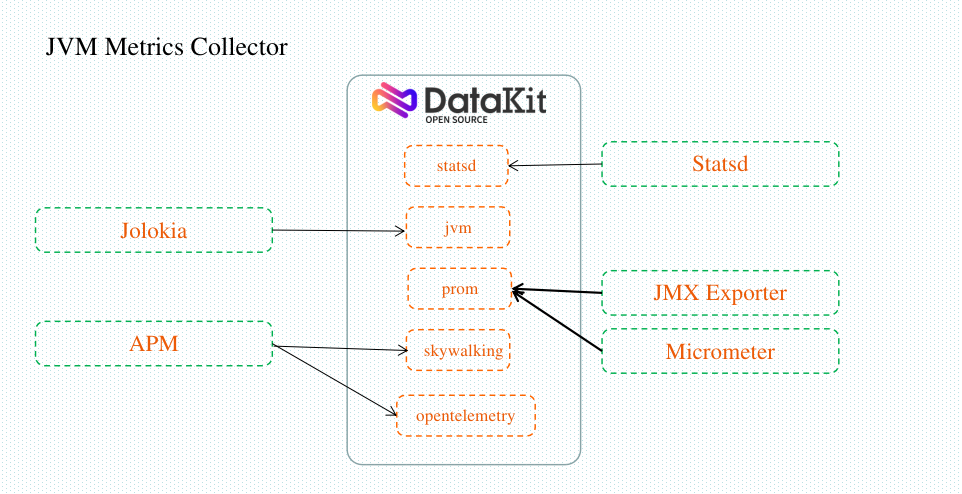
Common Methods for Collecting JVM Metrics
- Statsd Collection
- JMX Exporter Collection
- Jolokia Collection
- Micrometer Collection
- APM Agent: SkyWalking, OpenTelemetry, etc.
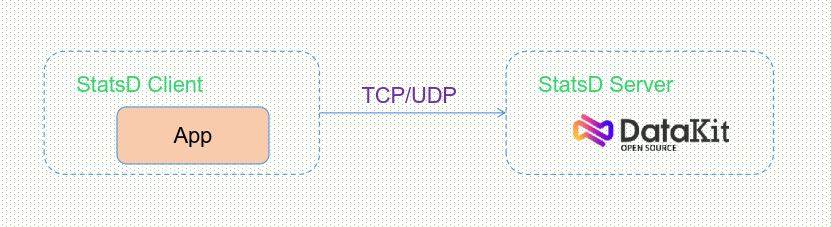
StatsD Collection
StatsD is essentially a daemon that listens on UDP (default) or TCP, collecting data sent by StatsD clients according to a simple protocol, aggregating it, and periodically pushing it to backends such as Graphite and InfluxDB. These backends then present the data through observability platforms.
Nowadays, StatsD typically refers to the entire system including client, server, and backend components. Clients are embedded in application code and report corresponding metrics to the StatsD server.
DataKit can act as a StatsD server to receive data sent by clients.
JMX Exporter Collection
JMX Exporter utilizes Java's JMX mechanism to read some monitoring data from JVM runtime and then converts it into Prometheus-compatible metrics format so that Prometheus can monitor and collect it.
JMX Exporter
JMX Exporter runs as a Java agent, exposing local JVM metrics via an HTTP port. It can also run as a standalone HTTP service and fetch remote JMX targets, although this approach has many drawbacks, such as difficult configuration and inability to expose process metrics (e.g., memory and CPU usage). Therefore, it is strongly recommended to run JMX Exporter as a Java agent.
Jolokia Collection
As currently the most mainstream JMX monitoring component, Jolokia is adopted by the Spring community (SpringBoot, MVC, Cloud) and major middleware services for JMX monitoring. Jolokia handles untyped data and uses JSON, a lightweight serialization scheme, to replace the RMI approach.
Fully compatible with JMX components, Jolokia can be embedded as an agent into any JAVA program, especially web applications. It translates complex and hard-to-understand MBean filter query statements into easier-to-implement and operate HTTP request paradigms, shielding away the development difficulties of RMI while achieving transparency for external monitoring components. This makes testing and use much easier.
Jolokia
Jolokia is designed to address the complexities encountered when retrieving JMX data—such as the complexity of the RMI protocol, inconvenient MBean queries, data serialization issues, and MBeanServer hosting problems. We only need to use HTTP requests to access JMX data directly through the same port used by the web service.
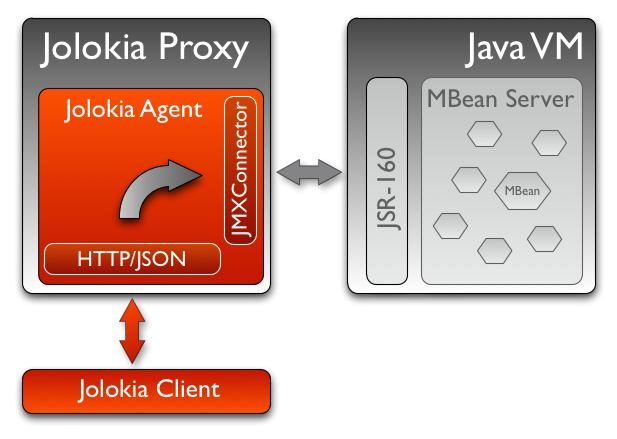
Jolokia offers two ways to retrieve JMX data.
Loading at application startup via the
javaagentmethod.
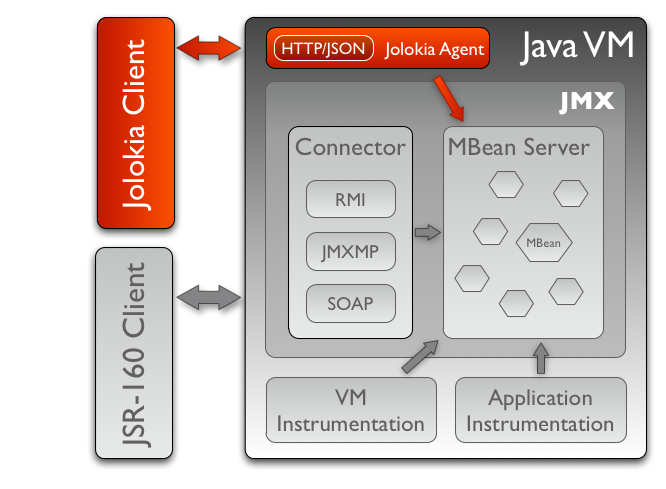
Running the agent independently in proxy mode.
Micrometer Collection
None of the above methods support defining business metrics exposure. Business metrics must be defined through coding before they can be exposed—that is, completed via an SDK approach.
APM Vendor Integration
APM Vendors, based on APM, introduce Metrics as part of observability. Taking SkyWalking as an example, it connects with JMX to expose metric information.