Overview
In the "CI Visualization" - "Overview", you can switch to view the overview of Pipelines and Jobs for GitLab / Jenkins, including the number of executions, failure rate, execution time, number of failed executions, and the Top List of failed execution durations.
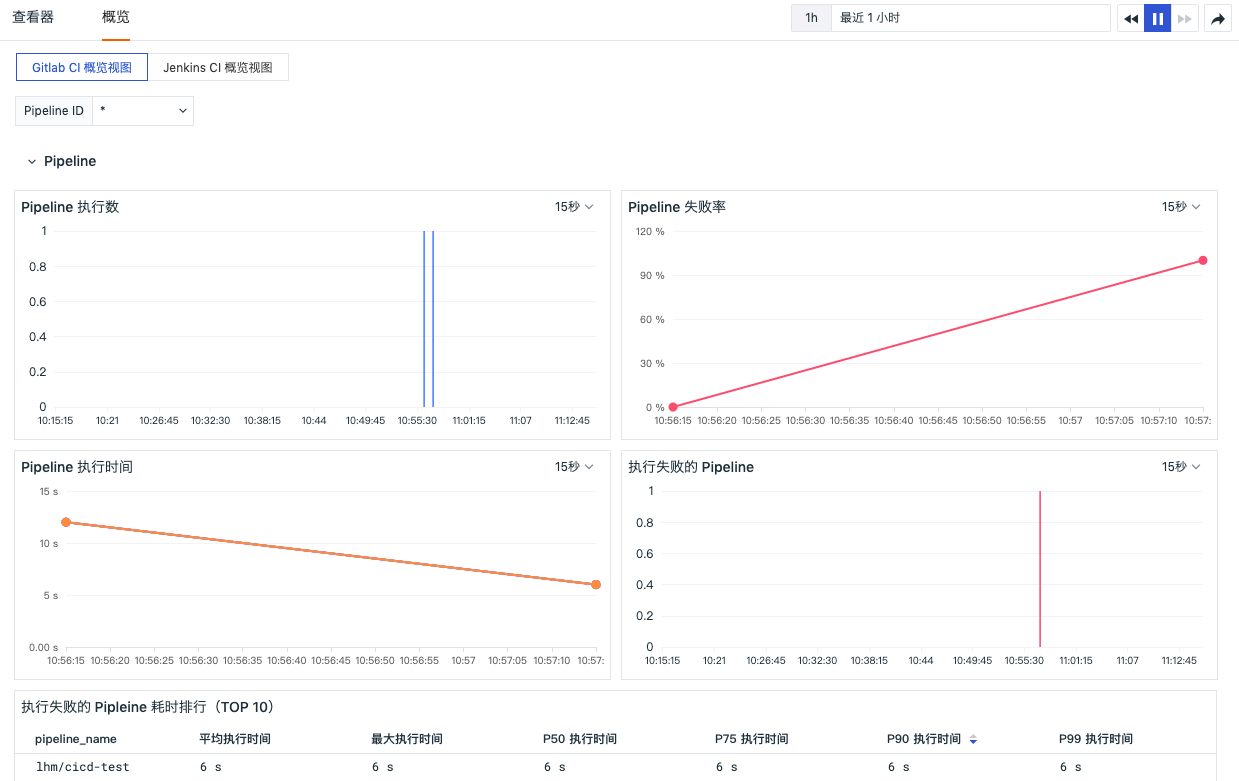
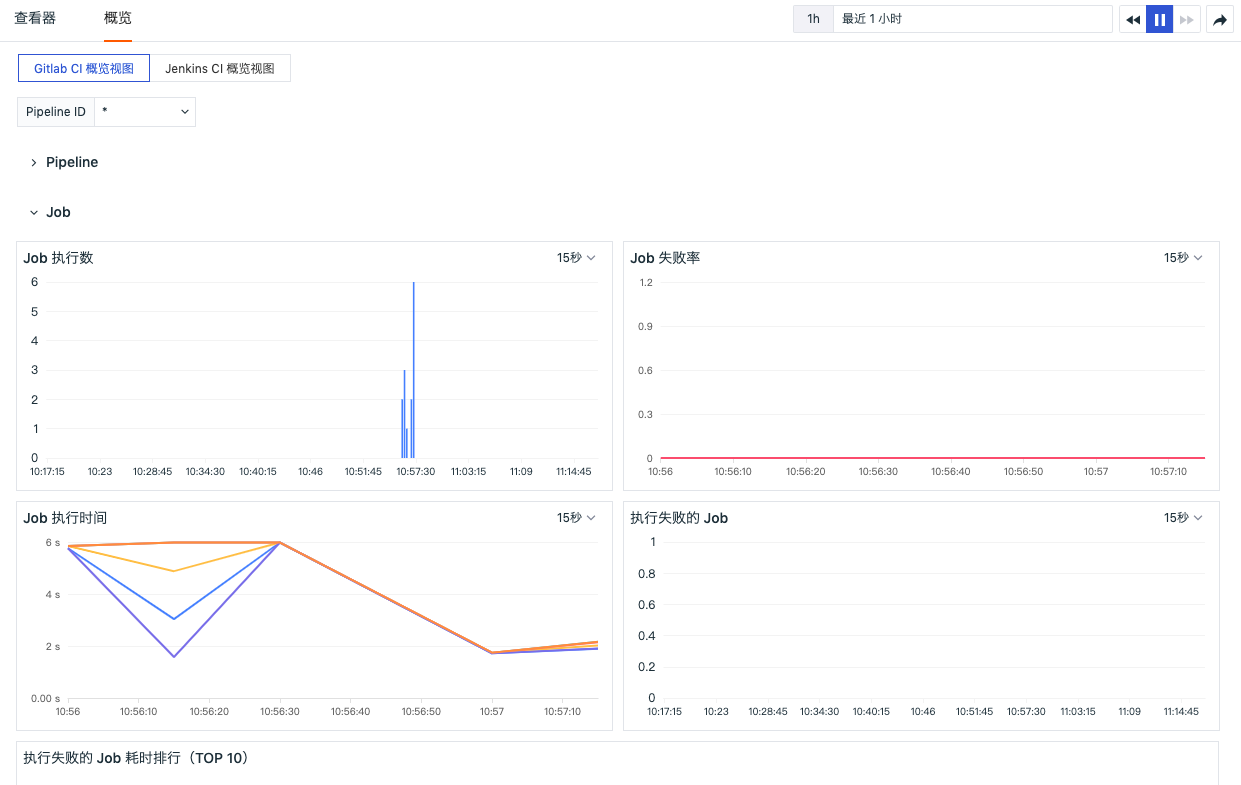
GitLab
You can view the number of executions, failure rate, execution time, number of failed executions, and the Top List of failed execution durations for Pipelines and Jobs in the GitLab CI overview view. This helps you quickly understand the operation status of Pipelines and Jobs throughout the entire CI process.
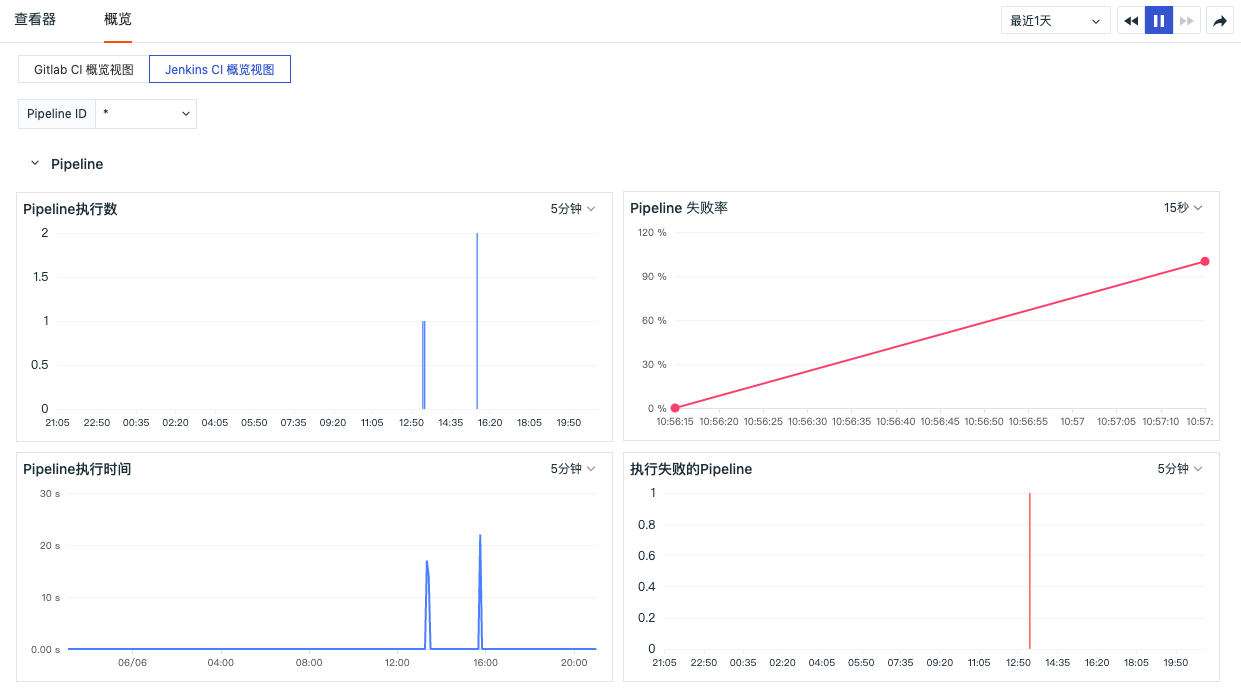
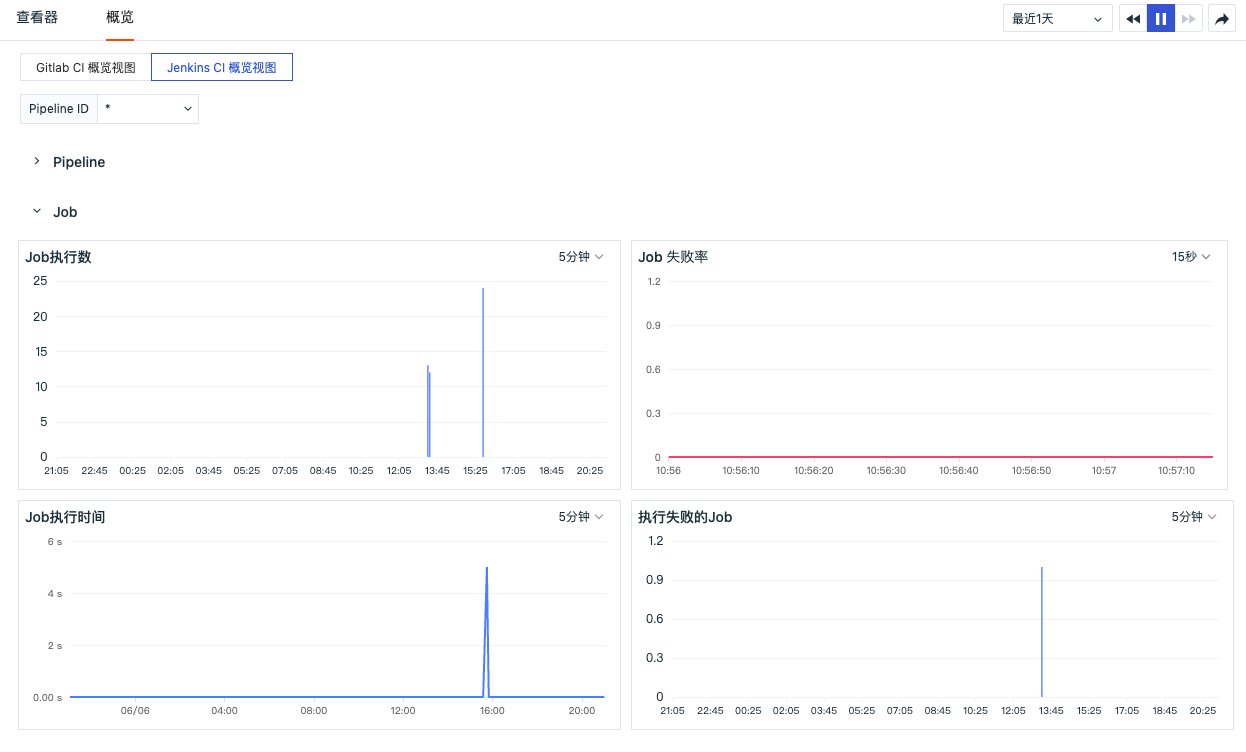
Jenkins
You can view the number of executions, failure rate, execution time, number of failed executions, and the Top List of failed execution durations for Pipelines and Jobs in the Jenkins CI overview view. This helps you quickly understand the operation status of Pipelines and Jobs throughout the entire CI process.