Web Application Analysis
After collecting application data to Guance, you can view the APM analysis through the Guance console to improve page load (LCP), interactivity (FID), and page stability (CLS) and enhance user experience.
Web Application Terminology
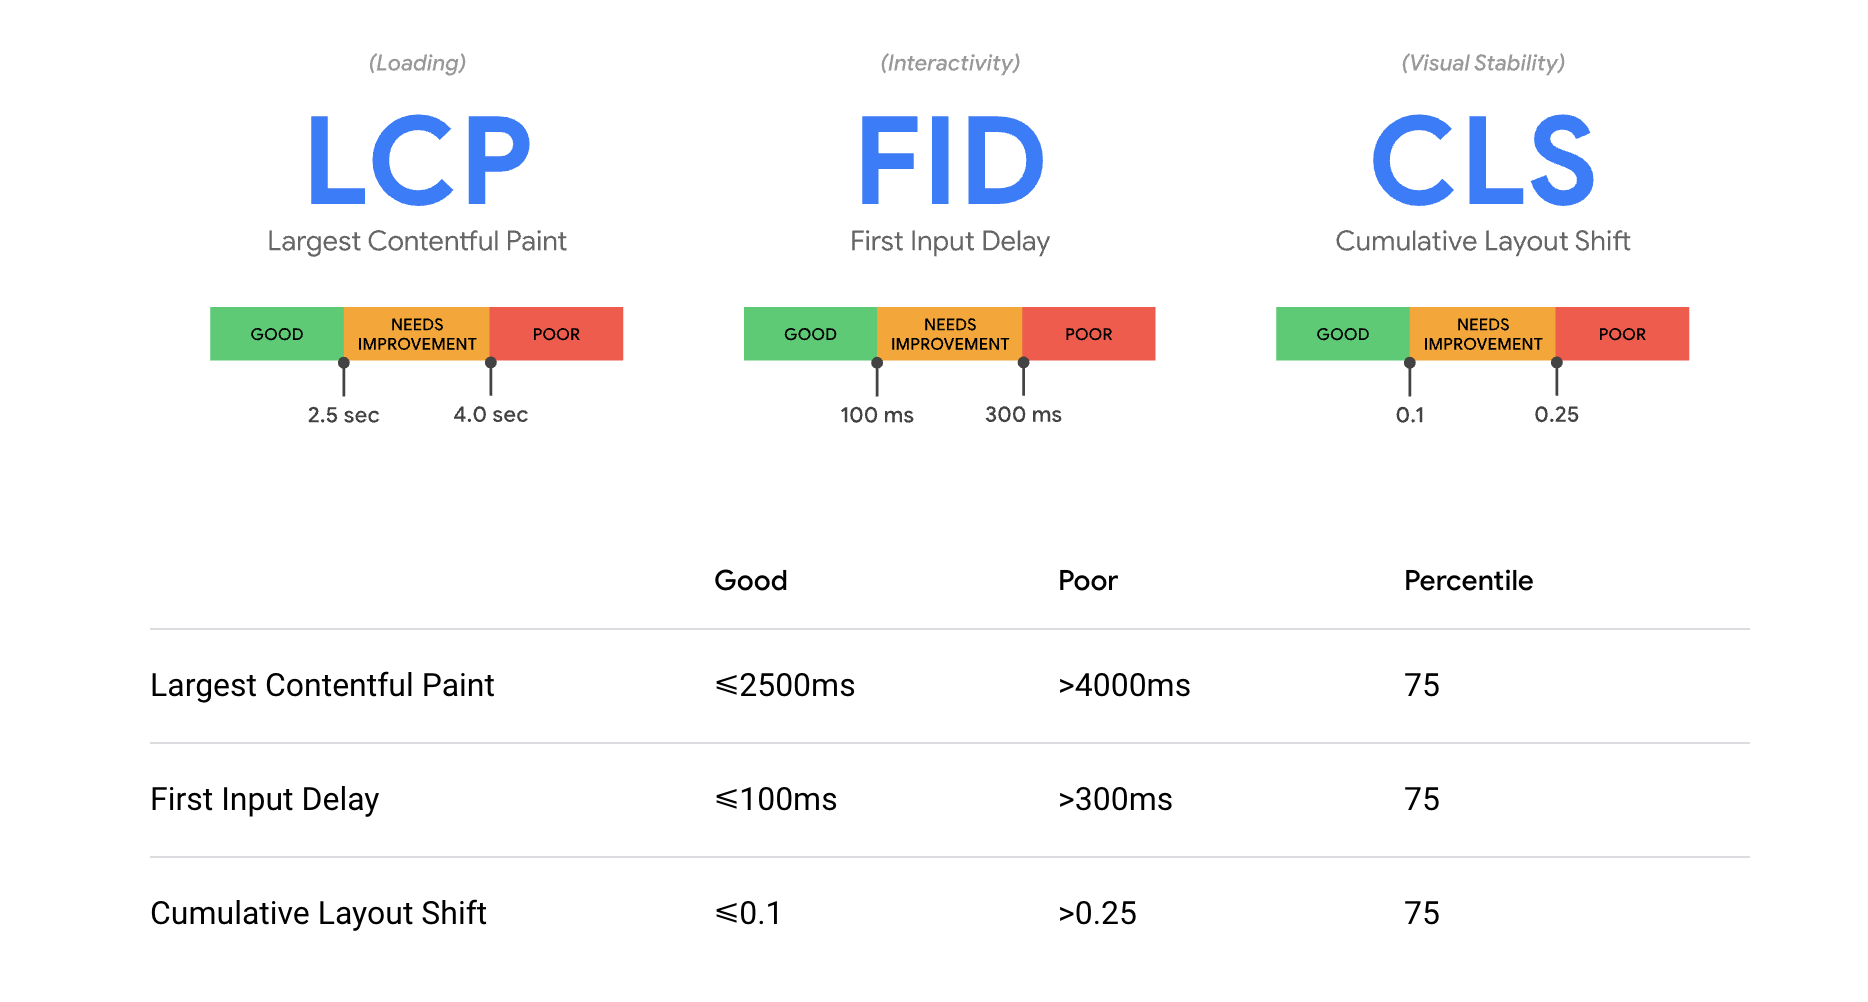
LCP, FID, and CLS are Google's core web vitals used to measure website loading speed, interactivity, and visual stability.
| Metric | Description | Target Value |
|---|---|---|
| LCP (Largest Contentful Paint) | Measures the time taken to load the largest content element within the visible area of a webpage | Less than 2.5s |
| FID (First Input Delay) | Measures the delay between the user's first interaction with the page and the browser's response | Less than 100ms |
| CLS (Cumulative Layout Shift) | Measures how much the page layout shifts unexpectedly during loading; 0 indicates no shift | Less than 0.1 |
Analysis Dashboard
Guance provides a visualized Web application analysis with built-in multi-dimensional RUM scenarios. You can view the Summary, page performance analysis, resource loading analysis, and JS error analysis under User Access Monitoring > Analysis Dashboard > Web.
For more details, refer to Analysis Dashboard.
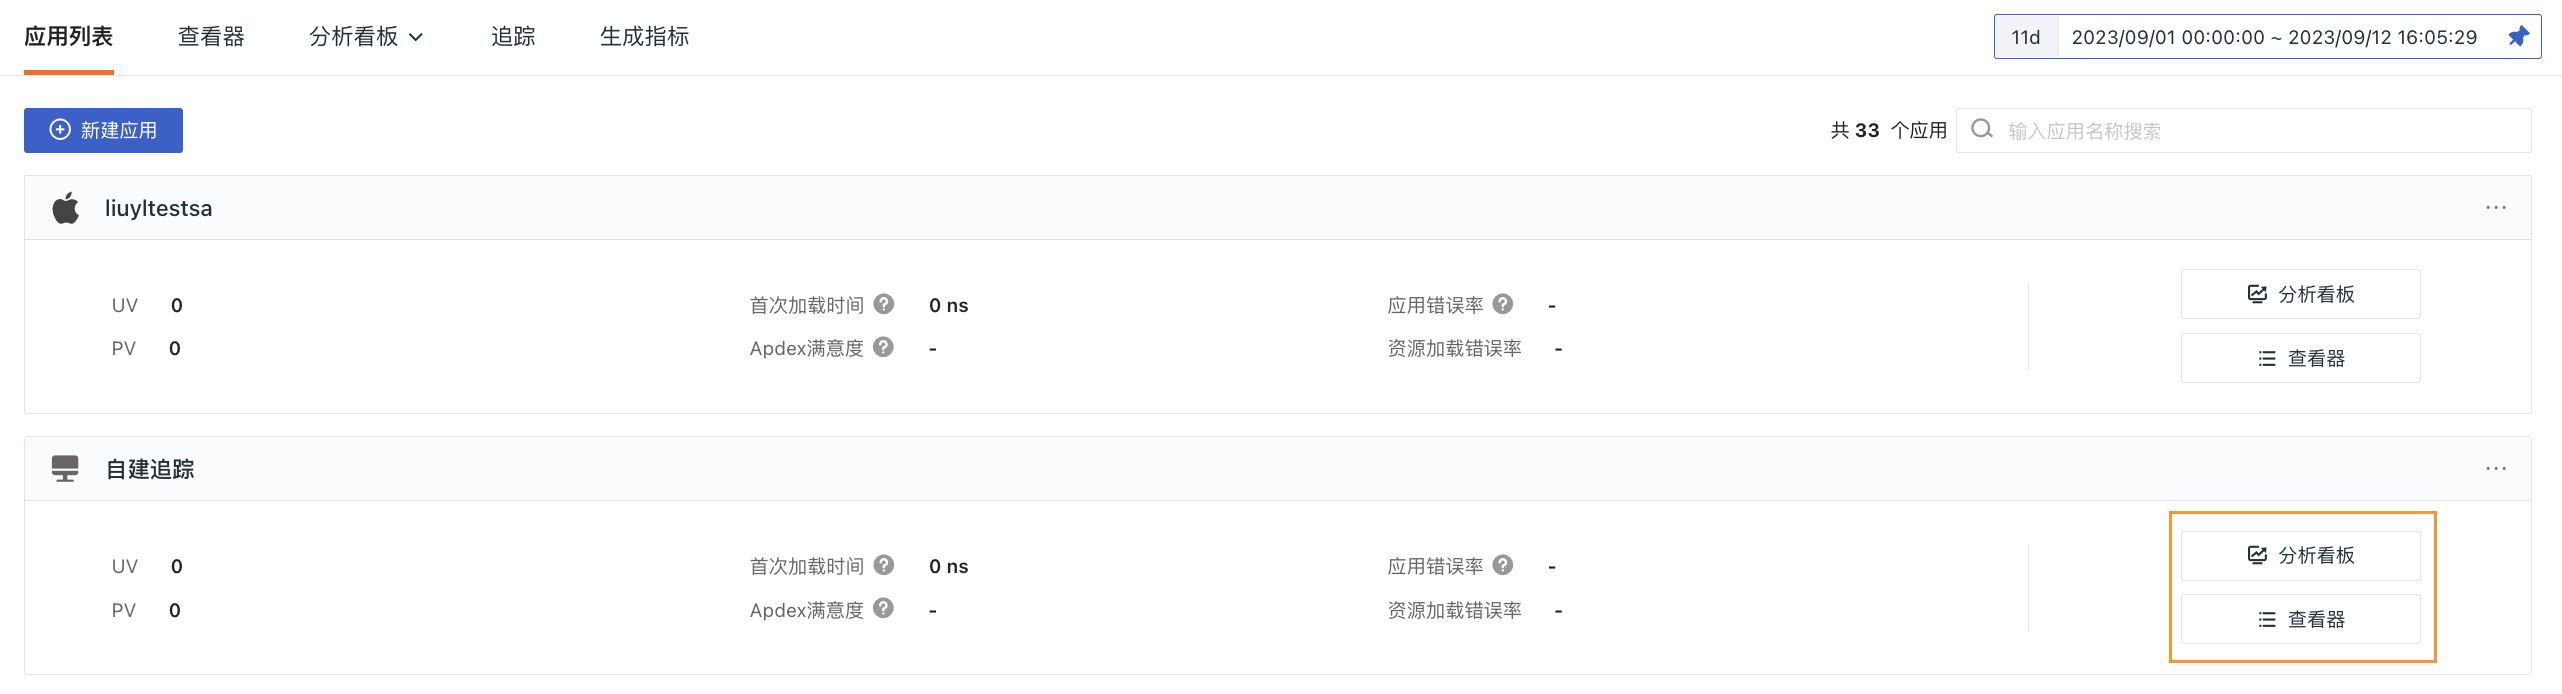
Explorer
Guance offers an RUM Explorer to help you view and analyze detailed information about user sessions. By clicking the button on the right side of the application, you can use the Explorer to understand each user session, page performance, resources, long tasks, and errors in operations, helping you gain comprehensive insights into the application's operational status and usage by searching, filtering, and correlating data, thereby improving user experience.
For more details, refer to Explorer.