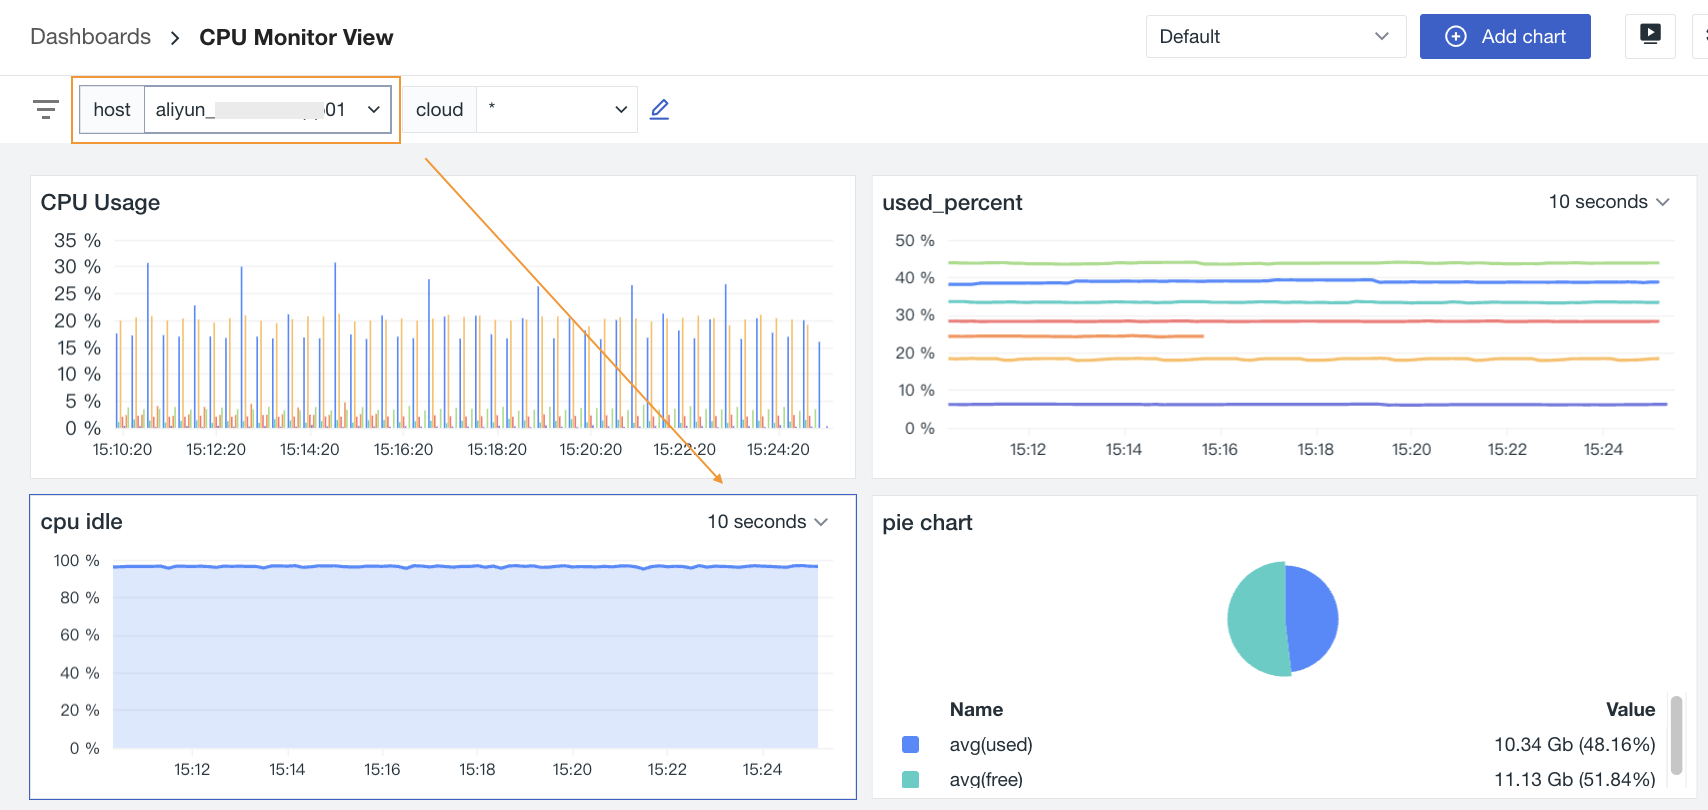
View Variables
Guance supports adding global variables to views, allowing you to dynamically filter charts in dashboards. You can choose to use view variables to achieve this.
Add View Variables
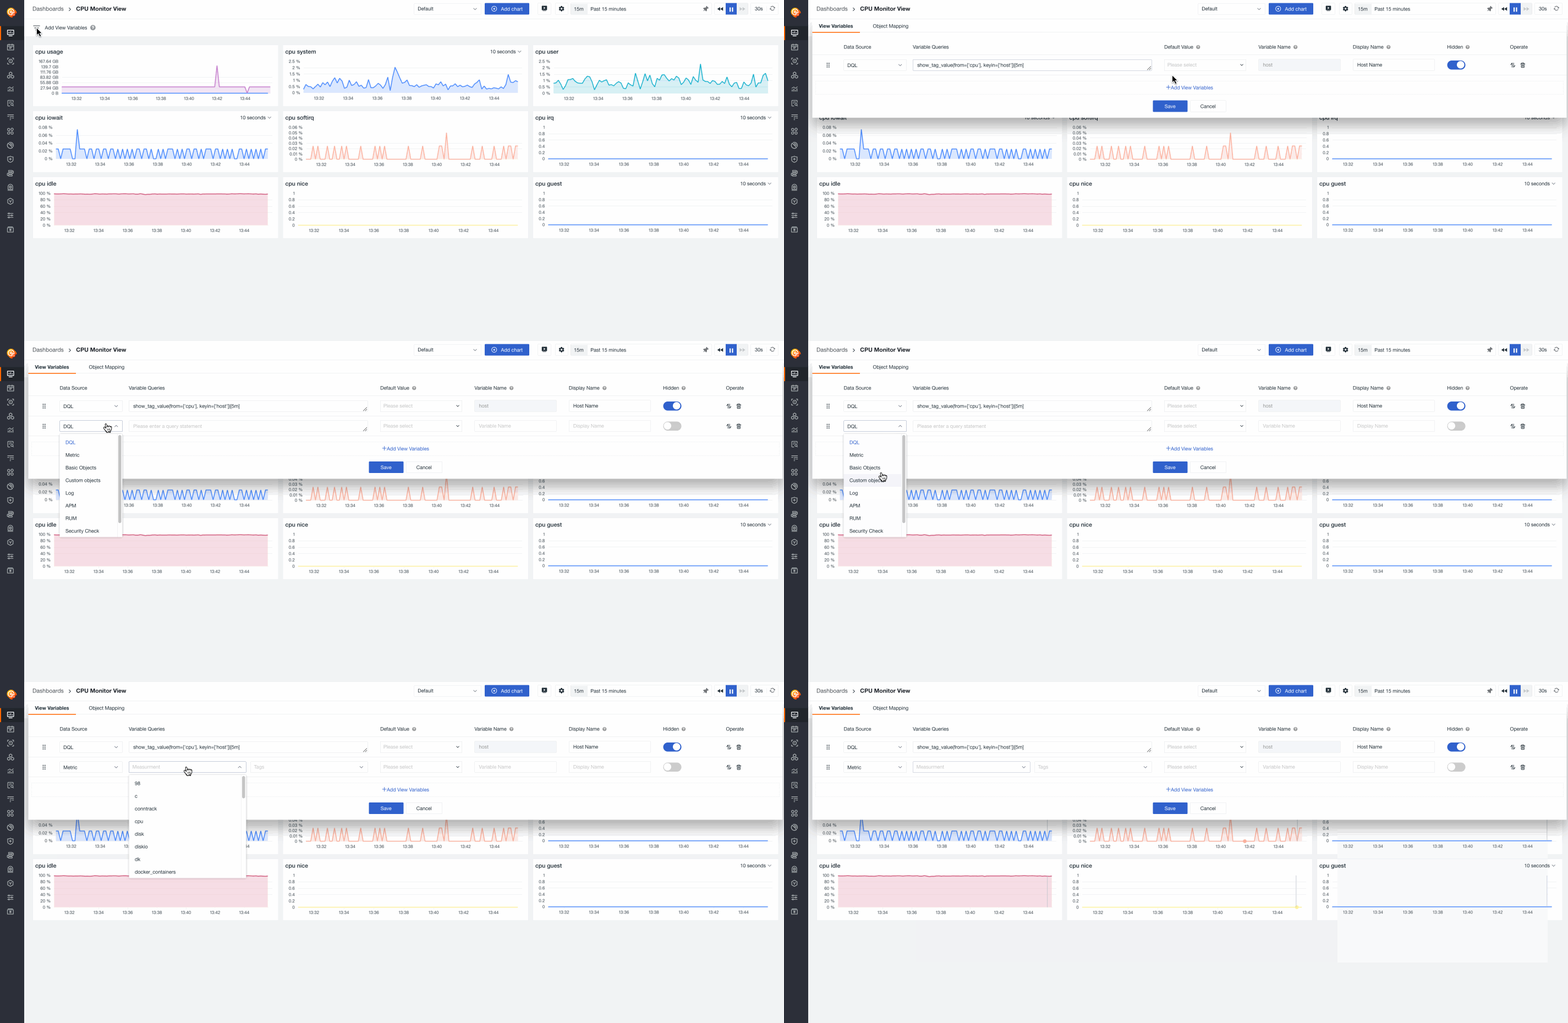
In the dashboard, if you have not added a view variable, the Add View Variable button is displayed in the top navigation bar, click it to enter the adding page.
Configuration
-
Data Source: The optional data scope for the current view variable includes DQL, metrics, infrastructure, custom objects, logs, APM, RUM, security check and custom options.
-
Variable Queries: The current view variable uses different query methods, including DQL queries, PromQL queries, UI queries and custom queries.
-
Default Value: The initial variable of the current view variable in the dashboard. You can view all the variables of the current view variable in the drop-down box, and select the initial variable to view by default in the dashboard. If the default value is empty, the latest field data is displayed on the dashboard.
- *: The condition is null;
- All values: The result value obtained from the view variable query statement is used as the variable parameter; The drop-down box displays up to 50 variables.
- Custom: Enter the value directly in the selection bar and press enter to create. You can search in the selection bar to find your target variable.
Click Selected to select all values in the current list.
-
Variable Name: The name of the variable to which the current set of view variables belongs. When adding a chart in the dashboard, it needs to be referenced in the chart query using the format: #{variable name}.
-
Display Name: The collection of current view variables is displayed in the dashboard with their respective names. For example, if the variable name is
host, the display name would beHostname.
Note: If there is no data reporting in the workspace, you will not be able to select data when configuring view variables. In this case, you can predefine the fields during configuration, and once the data is successfully reported, it will automatically match the fields.
Related operations:
-
Drag: Hover over the icon to click and drag the view variables to adjust their order.
-
Sort: Sort the view variables returned by the query in default, ascending, or descending order.
-
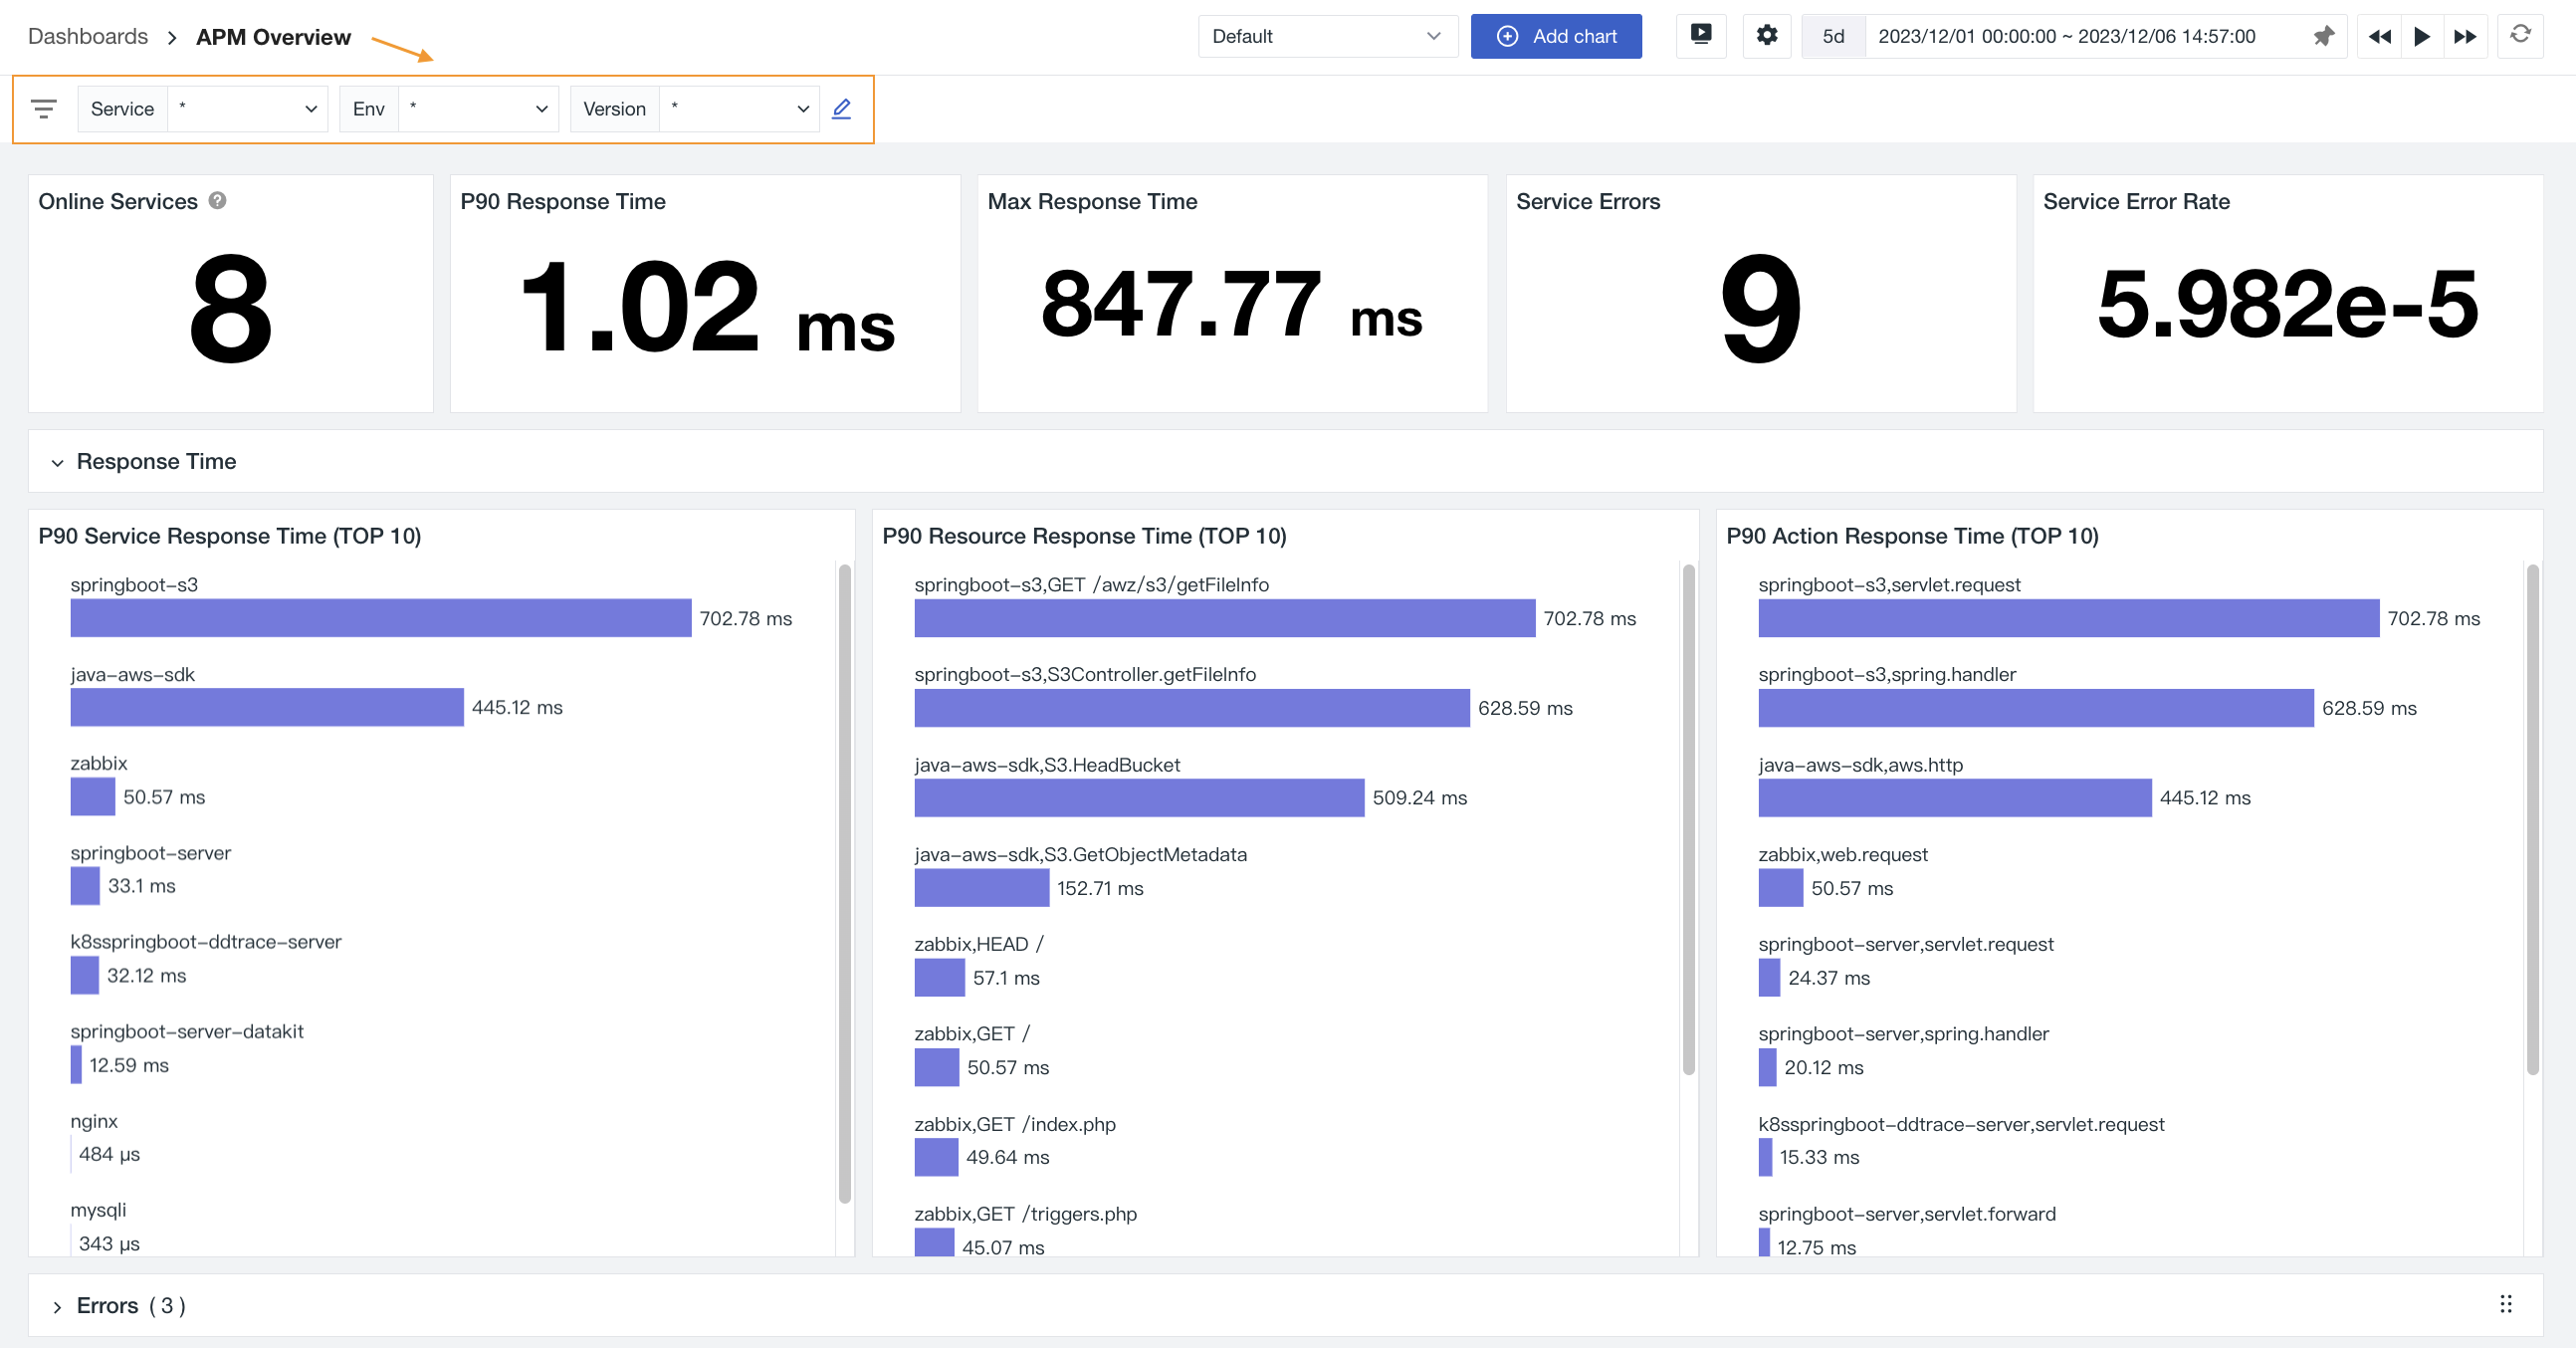
Hidden: When this feature is enabled, the variable will not be visible in non-edit mode, and the Add View Variable button will be displayed in the top navigation bar.
Variable Queries
View variables support four types of queries: DQL queries, PromQL queries, UI queries, and custom queries.
Value Range
There are two ways to determine the value range of view variables:
Linked to the dashboard: the data queried by variable will be based on the time range selected by the dashboard's time widget.
Not linked to the dashboard: all the data queried by variable will be shown, regardless of the time range selected by the dashboard's time widget.
Here is an explanation of the value range for variable queries from different data sources:
| Data Type | Measurement | Tags | Default Value |
|---|---|---|---|
| Metrics | SHOW_MEASUREMENT() function; This function does not support adding time filters; Value range: all metric sets in the current workspace. |
SHOW_TAG_KEY(from=[measurement-name]) function;This function does not support adding time filters; Value range: The tags under the selected indicator set of the current workspace. |
SHOW_TAG_VALUE(from=[measurement-name], keyin=[tag-name]) LIMIT 50; This function does not support adding time filters; Value range: 50 values of a specific label within a specified set of metrics. |
| Data Type | Data Classification | Attributes/Tags | Default Value |
|---|---|---|---|
| Infrastructure | O::RE(.*):(DISTINCT_BY_COLLAPSE(class)); This function supports adding time filters that are linked to the dashboard time widget; Value range: The source values under all default indexes within the selected time. |
SHOW_OBJECT_FIELD(kubernetes_nodes); This function does not support adding time filters; Value range: All fields under the current workspace object data. |
O::kubernetes_nodes:(DISTINCT_BY_COLLAPSE(namespace)) LIMIT 50; This function supports adding time filters that are linked to the dashboard time widget; Value range: 50 values of a specific tag in the object data within a selected time. |
| Data Type | Data Classification | Attributes/Tags | Default Value |
|---|---|---|---|
| Custom Objects | CO::RE(.*):(DISTINCT_BY_COLLAPSE(class)); This function supports adding time filters that are linked to the dashboard time control; Value range: The source values under all default indexes within the selected time. |
SHOW_CUSTOM_OBJECT_FIELD(class-value); This function does not support adding time filters; Value range: All fields under the custom object data of the current workspace. |
CO::cdsmnl:(DISTINCT_BY_COLLAPSE(cds)) LIMIT 50; This function supports adding time filters that are linked to the dashboard time widget; Value range: 50 values of a selected tag in the custom object data within a specified time. |
| Data Type | Log Source | Attributes | Default Value |
|---|---|---|---|
| Logs | L::RE(.*):(DISTINCT_BY_COLLAPSE(source)); This function supports adding time filters that are linked to the dashboard time widget; Value range: The source values under all default indexes within the selected time. |
SHOW_LOGGING_FIELD(index=default); This function does not support adding time filters; Value range: All fields under the log data of the current workspace. |
L::RE(.*):(DISTINCT_BY_COLLAPSE(trace_id)) LIMIT 50; This function supports adding time filters that are linked to the dashboard time widget; Value range: 50 values of a selected tag in the logs within a specified time. |
| Data Type | Attributes | Default Value |
|---|---|---|
| APM | SHOW_TRACING_FIELD(); This function does not support adding time filters; Value range: All fields under the traces' data in the current workspace. |
T::RE(.*):(DISTINCT_BY_COLLAPSE(resource)) LIMIT 50; This function supports adding time filters that are linked to the dashboard time widget; Value range: 50 values of a selected tag in the traces within a specified time. |
| Data Type | Data Classification | Attributes | Default Value |
|---|---|---|---|
| RUM | R::RE(.*):(DISTINCT_BY_COLLAPSE(source)); This function supports adding time filters that are linked to the dashboard time widget; Value range: The source values under all default indexes within the selected time. |
SHOW_RUM_FIELD(source-value); This function does not support adding time filters; Value range: All fields under the user's access data in the current workspace. |
R::error:(DISTINCT_BY_COLLAPSE(province)) LIMIT 50; This function supports adding time filters that are linked to the dashboard time widget; Value range: Select 50 values of a certain tag from the user access data within the chosen time. |
| Data Type | Attributes | Default Value |
|---|---|---|
| Security Check | SHOW_SECURITY_FIELD(); This function does not support adding time filters; Value range: All fields under the security check data in the current workspace. |
S::RE(.*):(DISTINCT_BY_COLLAPSE(rule)) LIMIT 50; This function supports adding time filters that are linked to the dashboard time widget; Value range: 50 values of a selected tag in the security check data within a specified time. |
DQL Query
During the DQL query process, users can directly write DQL statements to retrieve corresponding data values. You can add time range filtering and configure cascade queries in your queries.
DQL query example:
Note: This method is recommended for infrastructure, log and other non-metric data.
| Syntax | Description |
|---|---|
Data Source Type::Data Source:(distinct(attribute field name)){Filter Condition} |
M/metric - metric data; O/object - object data; L/logging - log data; E/event - event data; T/tracing - tracing data; R/rum - RUM data. |
R::view:(distinct(app_id)) |
Return a list of app_id for RUM to web applications. |
R::view:(distinct(env)){app_id = 8f05003ebccad062} |
Return the list of env corresponding to the web application user access monitoring with app_id=8f05003ebccad062. |
R::view:(distinct(env)){app_id = #{appid}} |
By using #{variable name} in DQL statements, it can be used for cascade queries. This represents that the variable name of the previous query is set as app_id, and it returns the env list corresponding to the selected app_id in the previous variable. |
Add Time Range
When using DQL statements to query view variables, you can add a time range for data queries in the format of [xx:xx:xx]:
- If a time range is added in the DQL query, the time range in the DQL query will be prioritized.
- If no time range is added in the DQL query, the time range selected in the dashboard time widget will be used by default.
Example:
# Query the list of container hosts in the last 10 minutes
O::docker_containers:(distinct(`host`)) [10m]
Show Function Query
When using DQL queries, you can use the Show function to query and retrieve the corresponding data values. However, the Show function does not support adding time range filters.
See DQL functions.
Examples of using the Show function:
Note: It is recommended to use this query method for metric data.
| Grammar | Description |
|---|---|
show_measurement() |
Return all measurements in the current workspace. |
show_tag_key(from=["Measurement name"]) |
Return a list of measurement tags, which can be specified for specific metrics. |
show_tag_value(from=["Measurement name"], keyin=["Label Name"]) |
Return a list of tag values for the specified tag key in the database. |
PromQL Query
In PromQL queries, it is possible to write queries manually. By default, the queries use the selected time from the dashboard time widget and return the corresponding data values.
For more information about PromQL queries, see PromQL Quick Start.
UI Query
In UI queries, you can select metrics, infrastructure, custom objects, logs, APM, RUM, and security check as data sources. By directly clicking on the UI to select query variables, you can retrieve corresponding data values.
In UI queries, you cannot add a time range or configure cascade queries.
Custom Query
Customization refers to the ability for users to directly define a set of values for use in view variables, without the need to retrieve relevant values through a query statement. The contents of the options for custom variables are separated by a comma (",") in English. Custom queries do not support adding time ranges and configuring cascade queries.
Cascade Query
When it is necessary to configure two or more view variables, and the second view variable needs to be based on the query results of the first view variable for cascade queries, cascade queries can be used. Similarly, cascade queries can support cascade queries of multiple view variables.
Note: Cascade queries only support DQL statements for query configuration.
Example
Take the RUM configuration web application overview view variable cascade filtering as an example, which needs to be based on the app ID, environment and version for cascade queries.
Configuration:
There are three variables: App ID, Environment and Version, so we need to configure three variable query statements on the dashboard. In the second and third query statements, use the #{variable name} of the higher-level configuration to complete the cascade query configuration.
- Variable 1 (App ID): Query the list of applications with the application name
df_web_rum_sdk:
- Variable 2 (Environment): Query the list of environments for the application named
df_web_rum_sdkand selected under the application ID in Variable 1:
- Variable 3 (Version): Query the application name as
df_web_rum_sdk, and the version list under the selected environment in Variable 2:
R::view:(distinct(`version`)) {app_id = `#{appid}` and env = `#{env}` and sdk_name = `df_web_rum_sdk`}
Logical Operators
| Logical Operators | Variable Value Matching Type | Example |
|---|---|---|
| = 、!= | Exact match, multiple selection is supported. | R::view:(distinct(env)) {app_id = #{appid} |
| match(re)、not match(re) wildcard、not wildcard |
Fuzzy match, multiple selection is supported. | R::view:(distinct(env)) {app_id = re(#{appid})} |
Add Mapping
For infrastructure data, you can set field mapping, which is only used for display and will not affect the original field data.
Choose the data source, classfication, and two attribute fields that need to be mapped. As shown in the figure below: map container_id to display as container_name.
Use Cases
Configure View Variable
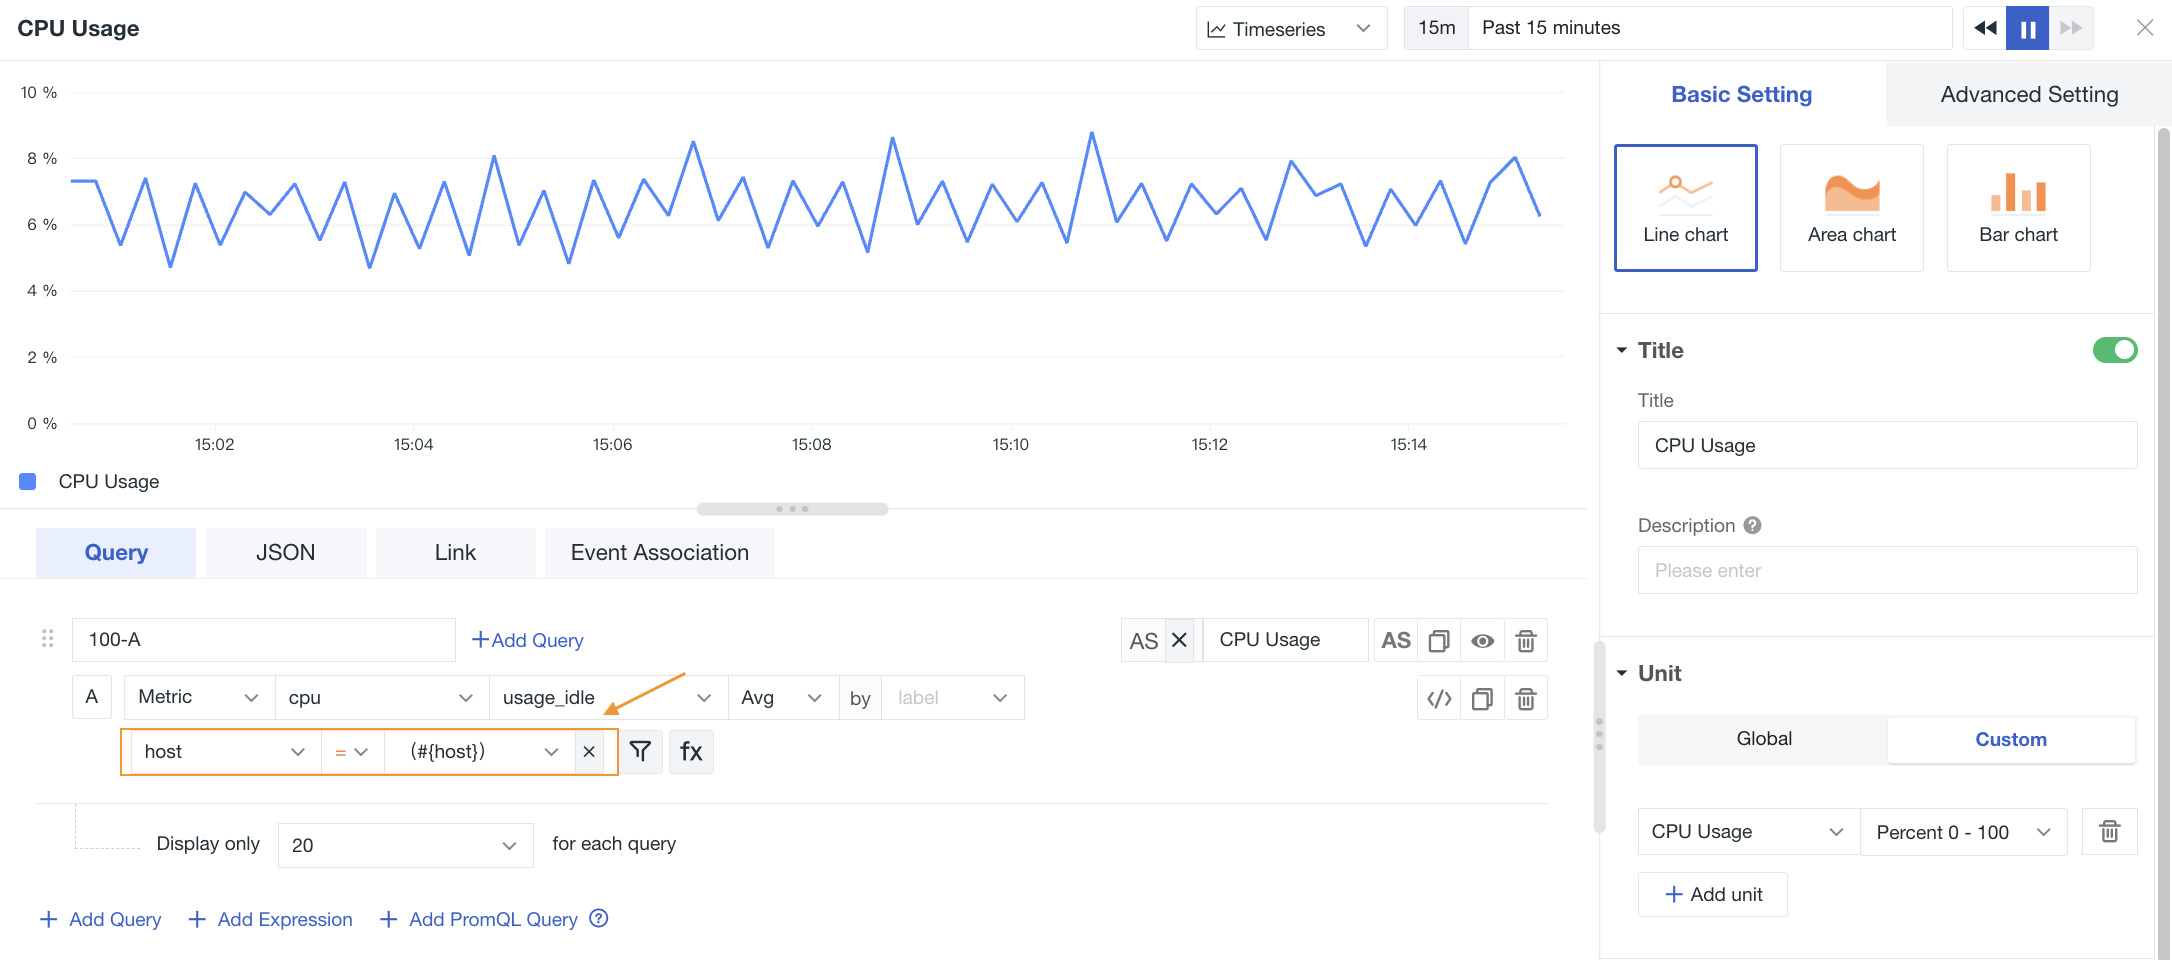
I. After the view variable is created, you need to associate it with the chart to achieve interactive filtering between the chart and the view variable.
i. In the chart query, when filtering fields, select the variable as the value. (The variable name is displayed in the dropdown here)
ii. In the scene view, switch the variable values, and the chart will be filtered and displayed based on the variable labels..
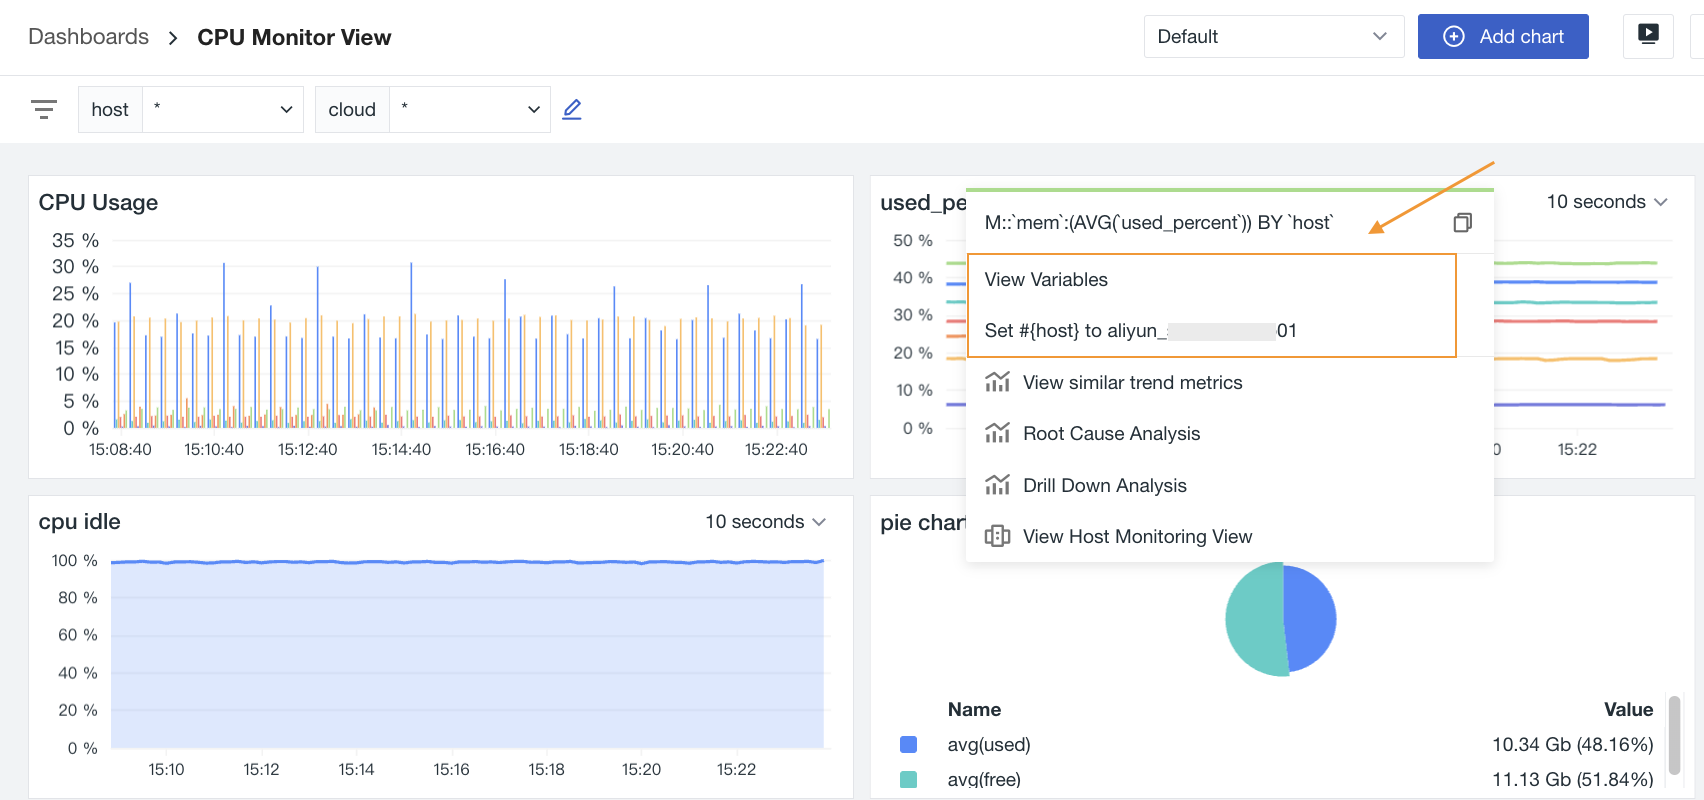
II. In the chart, select a specific timeline or data point to directly click and achieve reverse addition, realizing global linkage to view the chart data analysis related to the selected value.
Note:
-
Prerequisite: The corresponding DQL has a group by condition;
-
Related chart ranges: time series chart, overview chart, pie chart, toplist, dashboard, bar chart, scatter plot, bubble chart, table chart, treemap, China map, world map and honeycomb chart.
i. After clicking on a specific timeline or data point, click on the Set conditions under Apply to view variables in the displayed card.
ii. It will be populated in the view variables of the dashboard. The effect is shown as follows:
Configure Object Mapping
Object mapping can be applied in two places: dropdown display of view variables and display of charts.
I. Add the attribute field of the object in the view variables. If this field also has a field mapping set, it will be displayed in the view variables as: mapped field (queried field).
Example:
i. Add the container_id variable in the View Variables (as shown in the image below).
ii. Mapped container_id to container_name in the Object Mapping.
iii. Now the variable is displayed in the view as: container_name(container_id).
II. In the chart, the attribute field of the object was queried, and the field mapping was enabled in the settings. If the field has also been mapped, it will be displayed in the chart variable as: mapped field (queried field).
Example:
i. In Object Mapping, set the host mapping to name (as shown in the figure below):
ii. Use this field in chart queries and enable Field Mapping in the Settings, so that the format displayed in the chart is name(host).
Note:
- Object mapping only supports setting object class data.
- When using object mapping, you must first define a view variable based on the object class field.
- For the query fields of the same object category, it is not possible to set two mappings. This means that the query field dropdown does not contain any fields that have been added to the object category.
- When field mapping is enabled, the chart displays the grouping field of the query and its corresponding mapped field. Grouping fields that are not specified in the mapping are not displayed.
- When field mapping is disabled, the mapped fields are not displayed in the chart, and it is displayed normally.
