Event List
Enter Events, switch the icon at the top left , and you can view all events in the current workspace in list form.
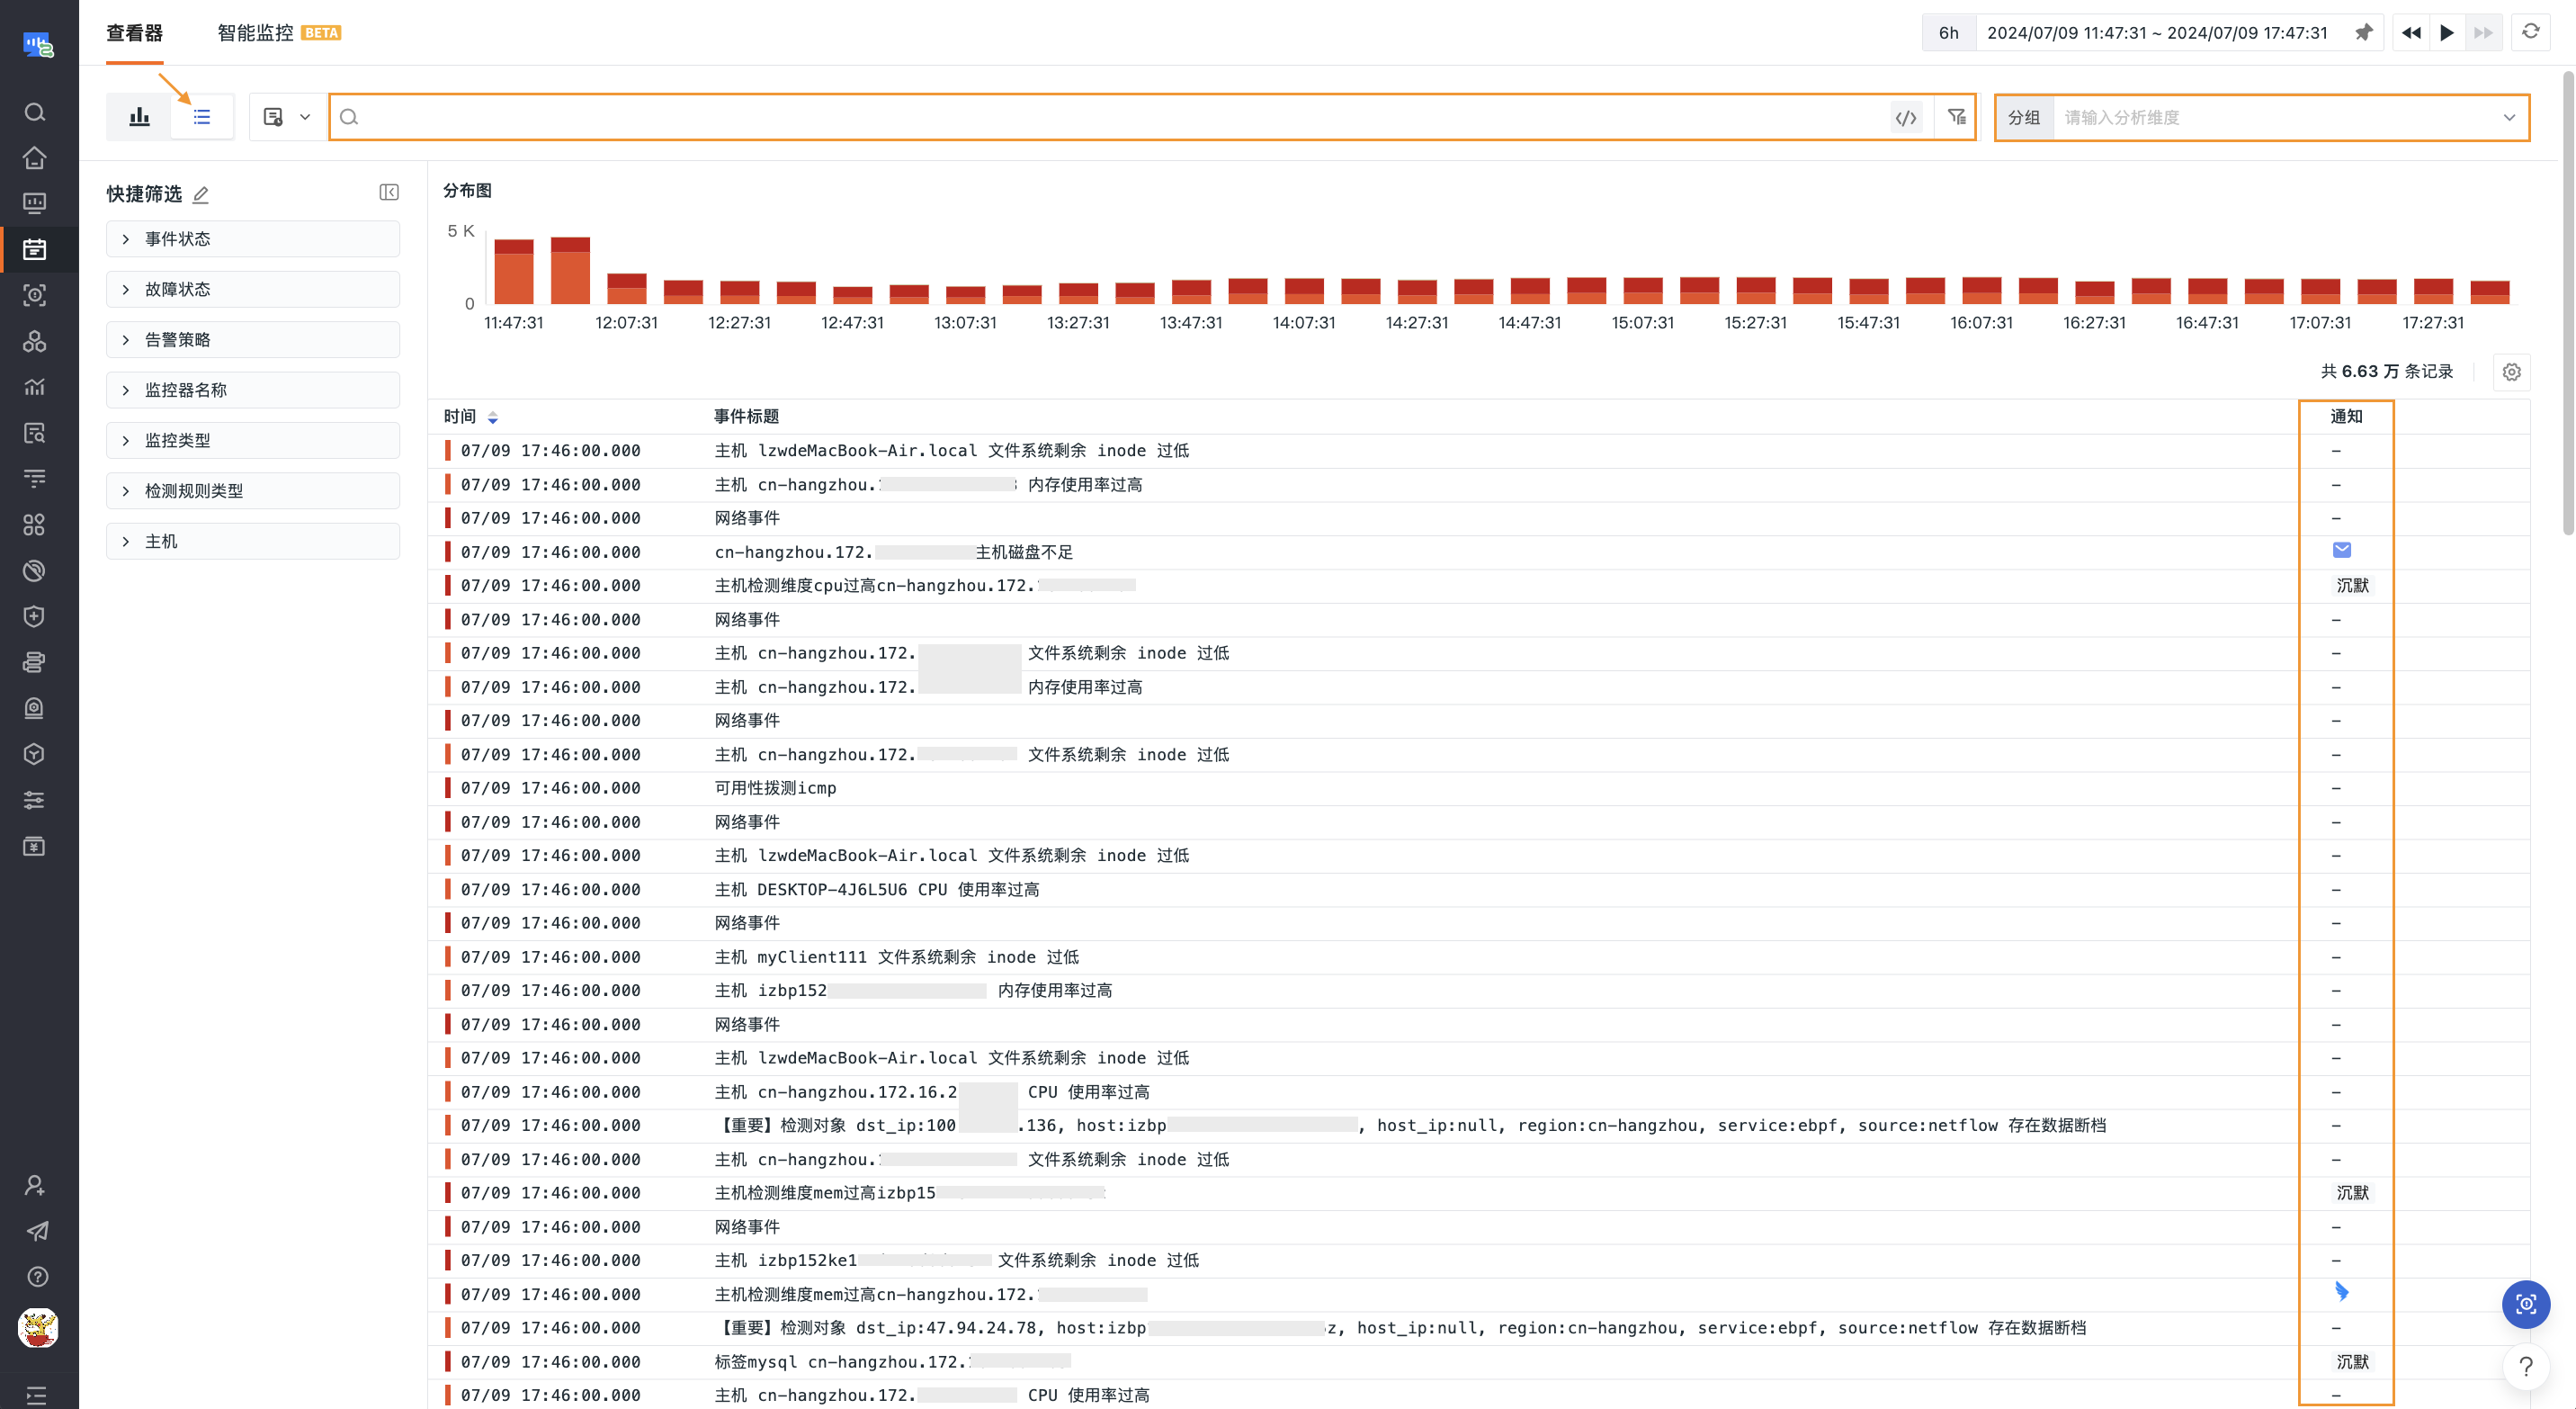
In the event list, you can:
- Event Distribution Chart: View the number of events statistics for different alert levels at various time points through stacked bar charts;
- Search and Filter: Perform keyword searches, quick filters, field filters, and related searches based on tags, fields, text, etc.;
- Aggregation Analysis: Aggregate analysis by fields such as Monitor ID, Monitoring Type, Detection Rule Type, HOST, Service, Container Name, Pod Name, etc.;
-
Notification Status: View the notification status of events, including:
- Mute: The event is in a muted state;
- Notification Target Identifier: Such as DingTalk bot identifiers, indicating that the event has been successfully sent to Notification Targets;
-: No external alarm notifications were triggered.