Host
The Host Explorer's data comes directly from collection tasks, covering detailed information such as host performance metrics (e.g., CPU, memory, disk, network, etc.), resource usage, and configuration status. Collection tasks gather data from target hosts at a preset frequency (approximately every 5 minutes) and store it in the workspace's database.
The Host Explorer calls this data, organizing it by host identifier and time series, enabling quick viewing of the latest status of all collected hosts.
-
Real-time Updates: The Host Explorer refreshes data in real-time according to the collection task frequency, ensuring the latest host status is displayed.
-
Priority on Key Metrics: Key performance metrics (such as CPU usage, memory usage, etc.) are displayed by default, with options to expand fields, allowing you to view more detailed metrics as needed.
-
Status Differentiation: Filters list hosts that have reported data within the last 10 minutes.
Data Display
The Host Explorer provides various professional analysis views based on lists and charts.
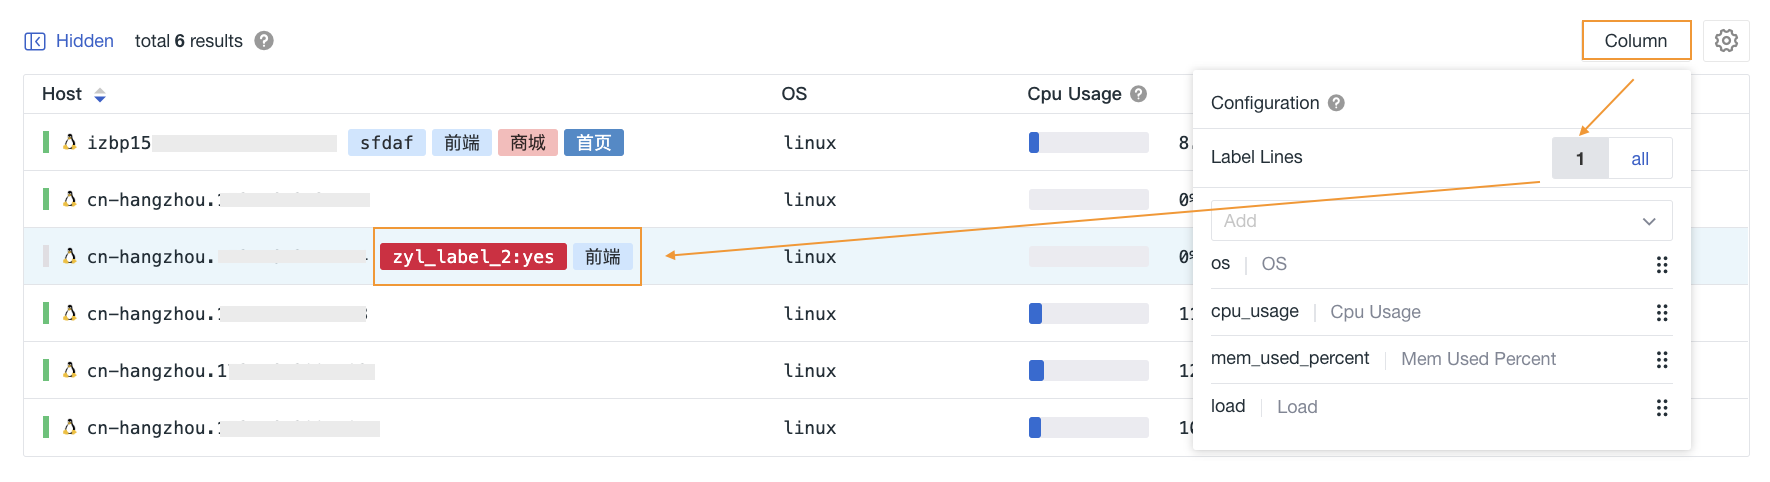
Displays the latest metric data (within the last 2 days) for all hosts in the current workspace, including host name/tags, CPU usage, memory usage, and CPU load, helping to quickly understand host operational status.
-
Honeycomb Chart: Visually presents the dynamic topology of host clusters, providing analysis dimensions such as operating system type, DataKit version, cloud vendor, and deployment region, and supports cross-level topology drilling for easy analysis of host relationships.
-
Other Charts: Based on
count,last,first,count_distinctoperation modes, filtering data underbyconditions:-
Top List: Shows the ranking of host group data over a period, intuitively presenting the high and low order of host data through bar charts.
-
Pie Chart: Displays the proportion of host data, intuitively representing the proportional relationship of parts within the whole through the size of扇形 areas.
-
Treemap: Shows the proportion of different categories, displaying complex hierarchical structures of host data.
-
Grouped Table Chart: Supports grouping and sorting functions through a table format, facilitating comparison and analysis of host data.
-
Host List
Real-time Performance
When the "Real-time Performance" switch is turned on, the system refreshes every 10 seconds and automatically fetches the latest three metric fields: CPU usage, memory usage, and CPU load.
At this time, if you manually sort any of the above three types of fields, it will trigger a data refresh and complete the sorting based on the latest metric data. After sorting is completed, the system will still automatically refresh the latest metric data every 10 seconds but will not re-trigger the sorting logic, meaning the sorting order remains unchanged.
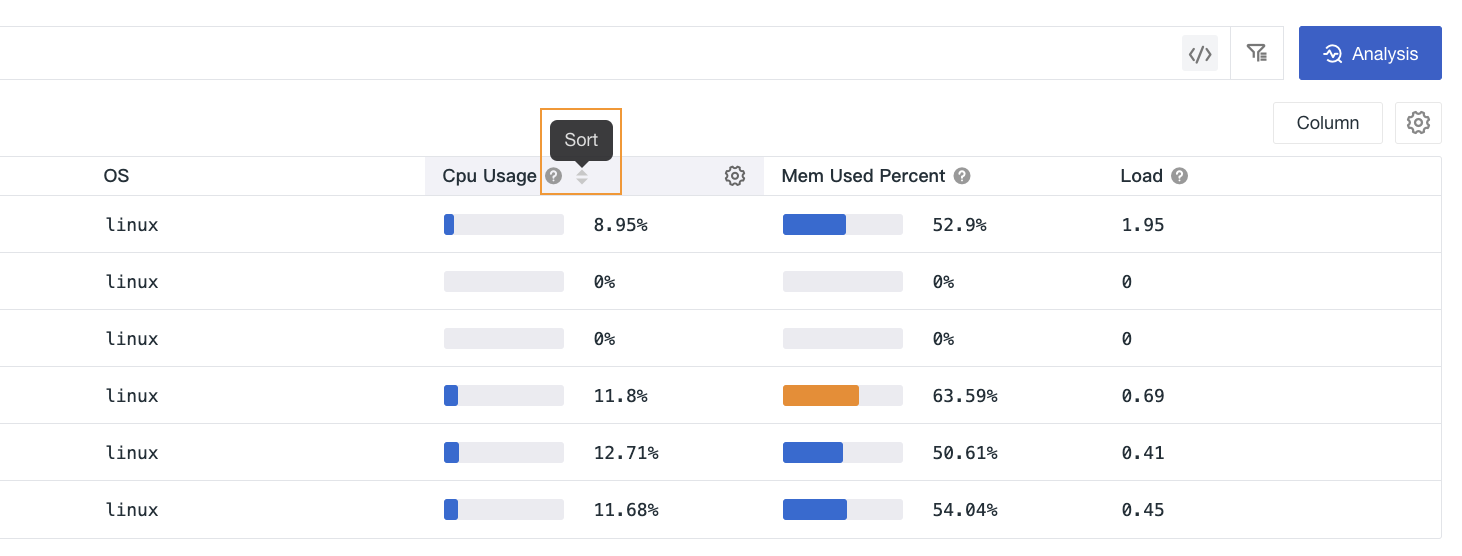
Data Sorting
In the host object list, you can sort metric data in ascending or descending order.
Note
Due to data入库 delays, this metric is not updated in real-time. The system calculates the average of the last 15 minutes every 5 minutes, so the final data may have some偏差.
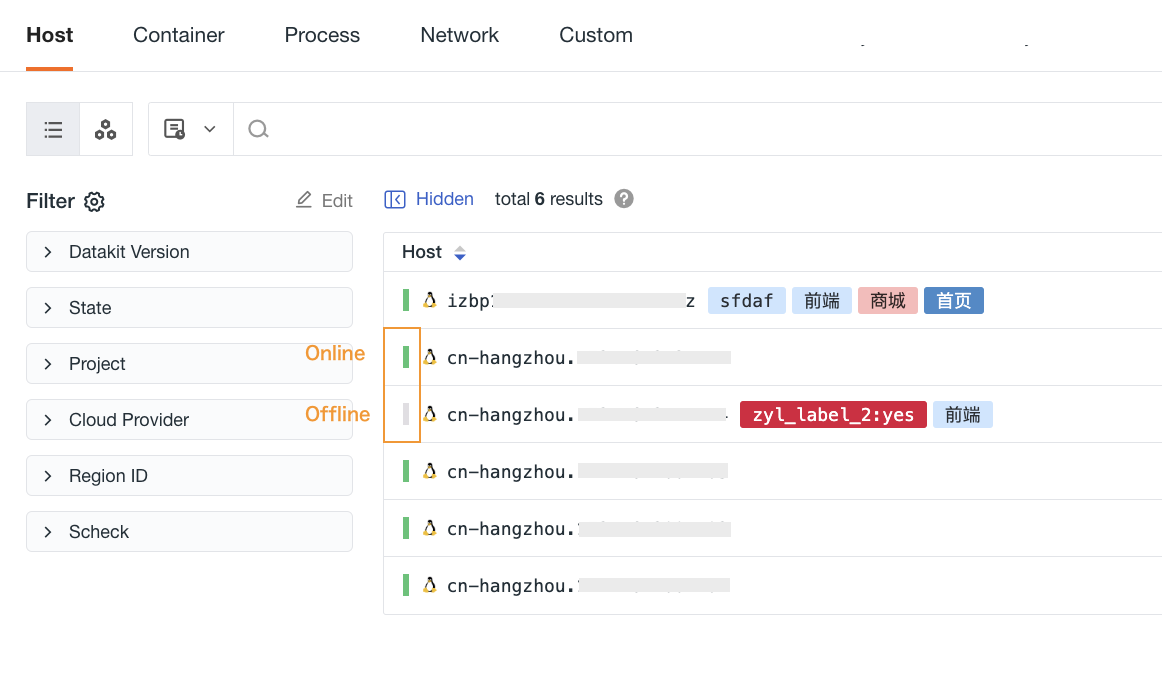
Show Only Online Hosts
Click the "Show Only Online Hosts" button to quickly list hosts that have reported data within the last 10 minutes.
-
If host data is interrupted for more than 10 minutes, CPU usage, MEM usage, and CPU load will display as
-. -
If a host has not reported data for more than 24 hours, it will be removed from the list.
Time Widget
In the upper right corner of the Explorer, you can select host data from different time ranges, including:
-
Last 2 hours
-
Last 6 hours
-
Last 1 day
-
Last 2 days
Cross-Workspace Authorization
If the current workspace has configured Data Authorization and the authorized data types include "Infrastructure", you can switch to the authorized workspace in the upper left corner of the Host Explorer page to view relevant host data.
Host Details
Click the host name in the host object list to slide out the host details page, where you can view the host's basic information, extended attributes, associated information, and bound views.
Host Tags
In multi-host management environments, you can customize tags for each host to categorize, filter, and query data based on attribute tags. Tags take effect 1-5 minutes after configuration.
-
Click the edit button to the right of Tags.
-
Select a tag from the dropdown list, or press Enter directly to add a tag.
-
Save after adding.
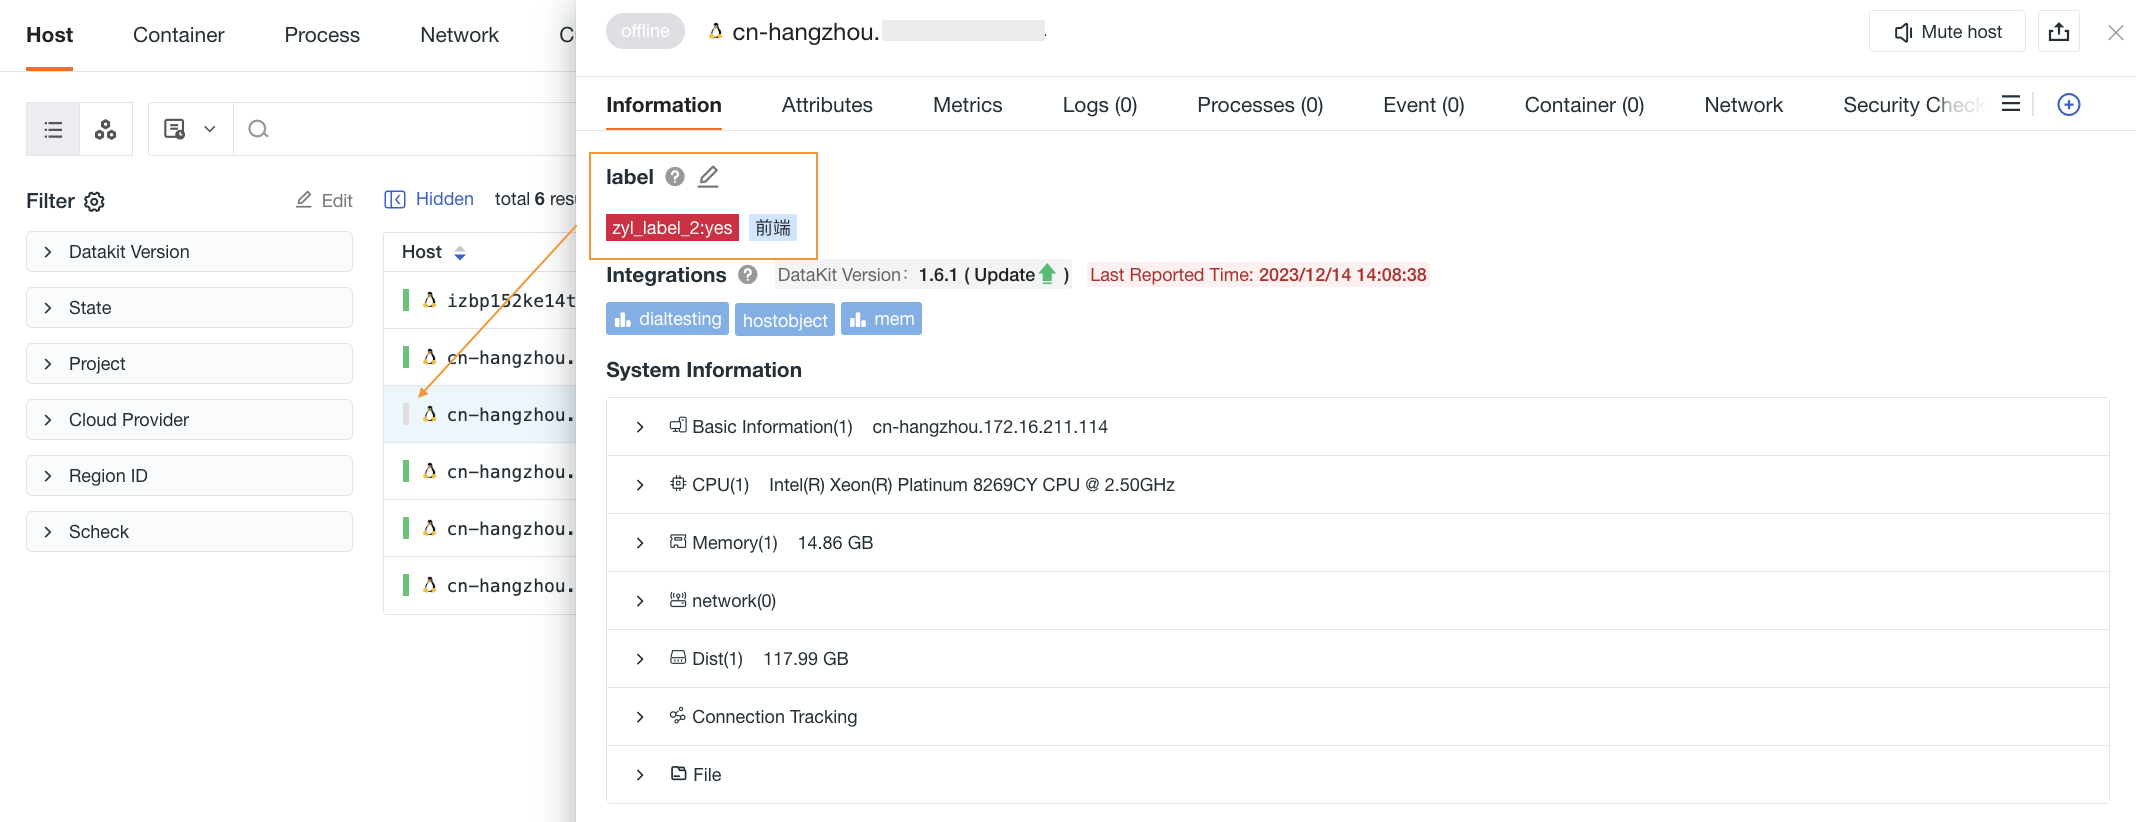
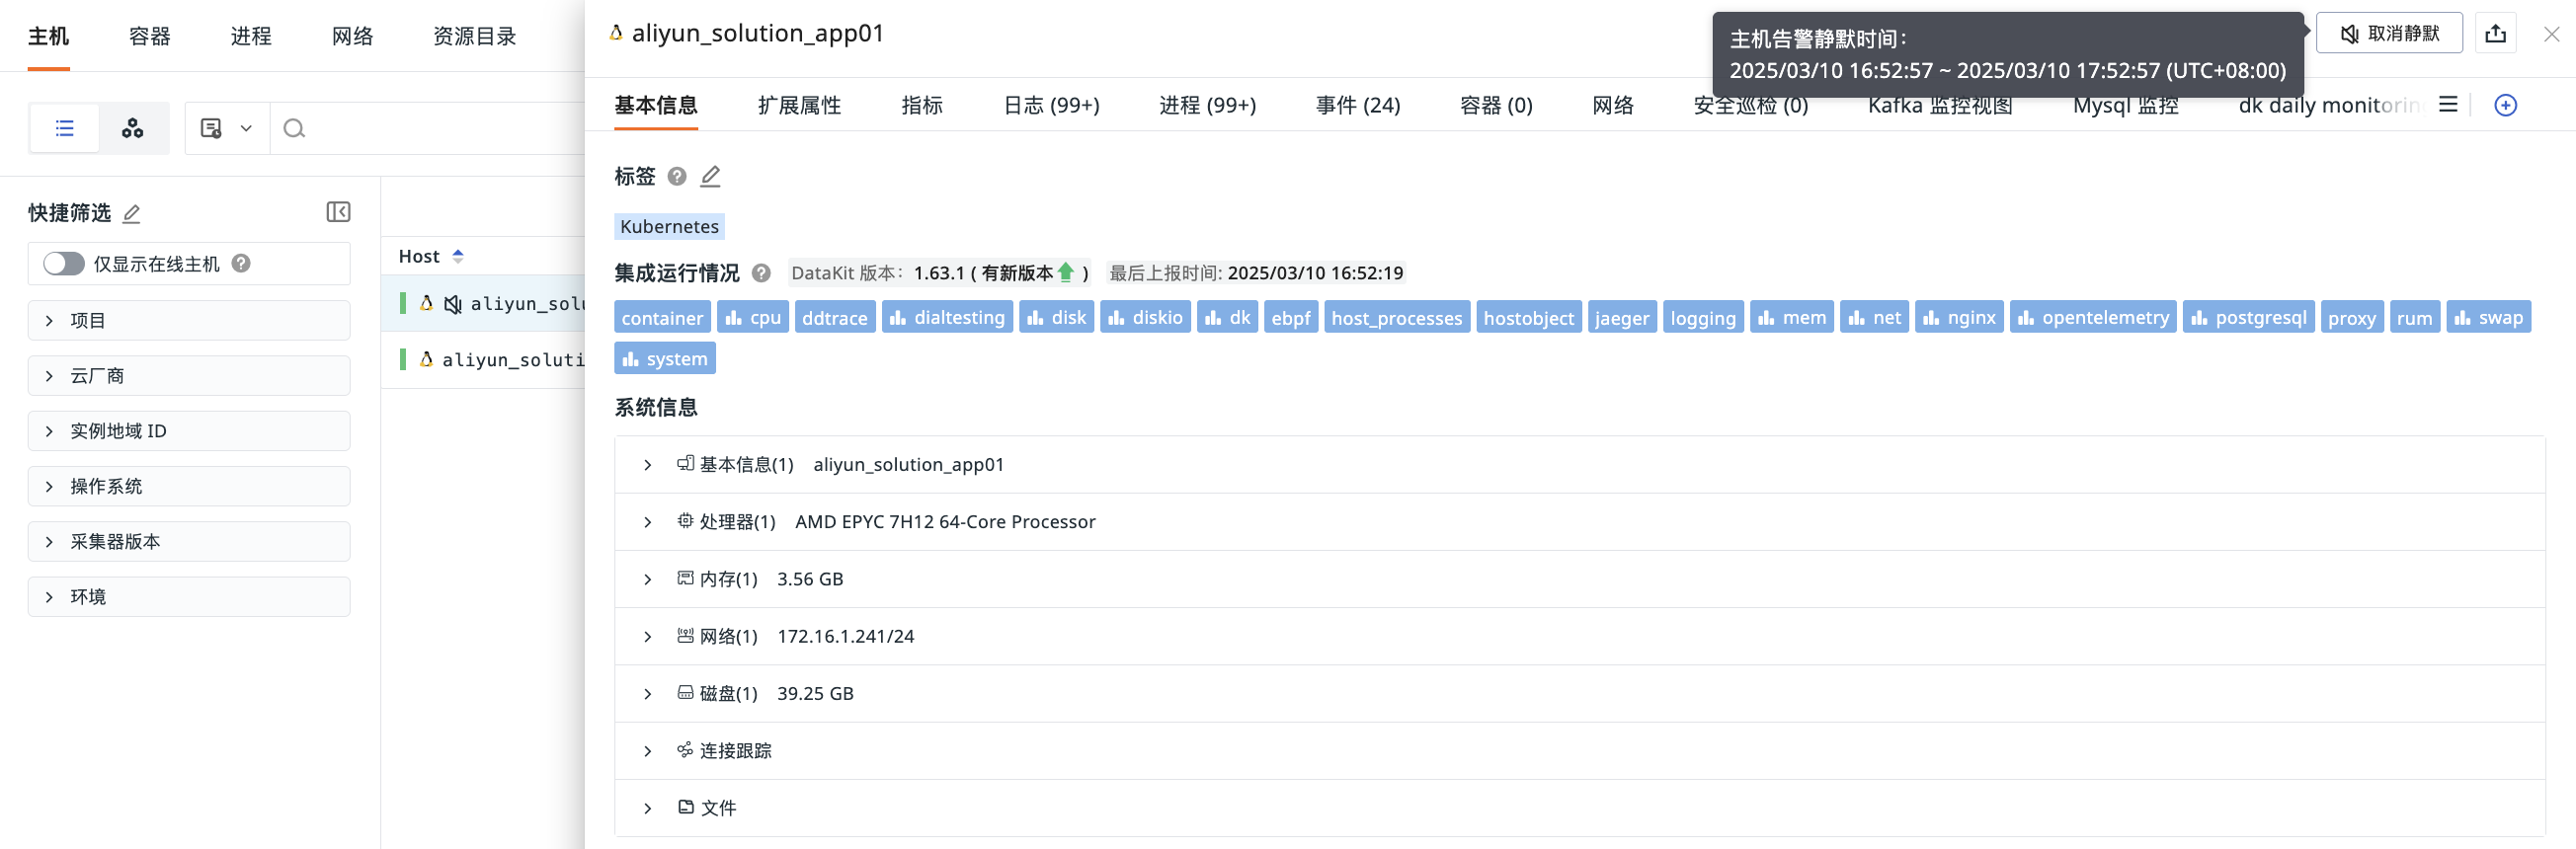
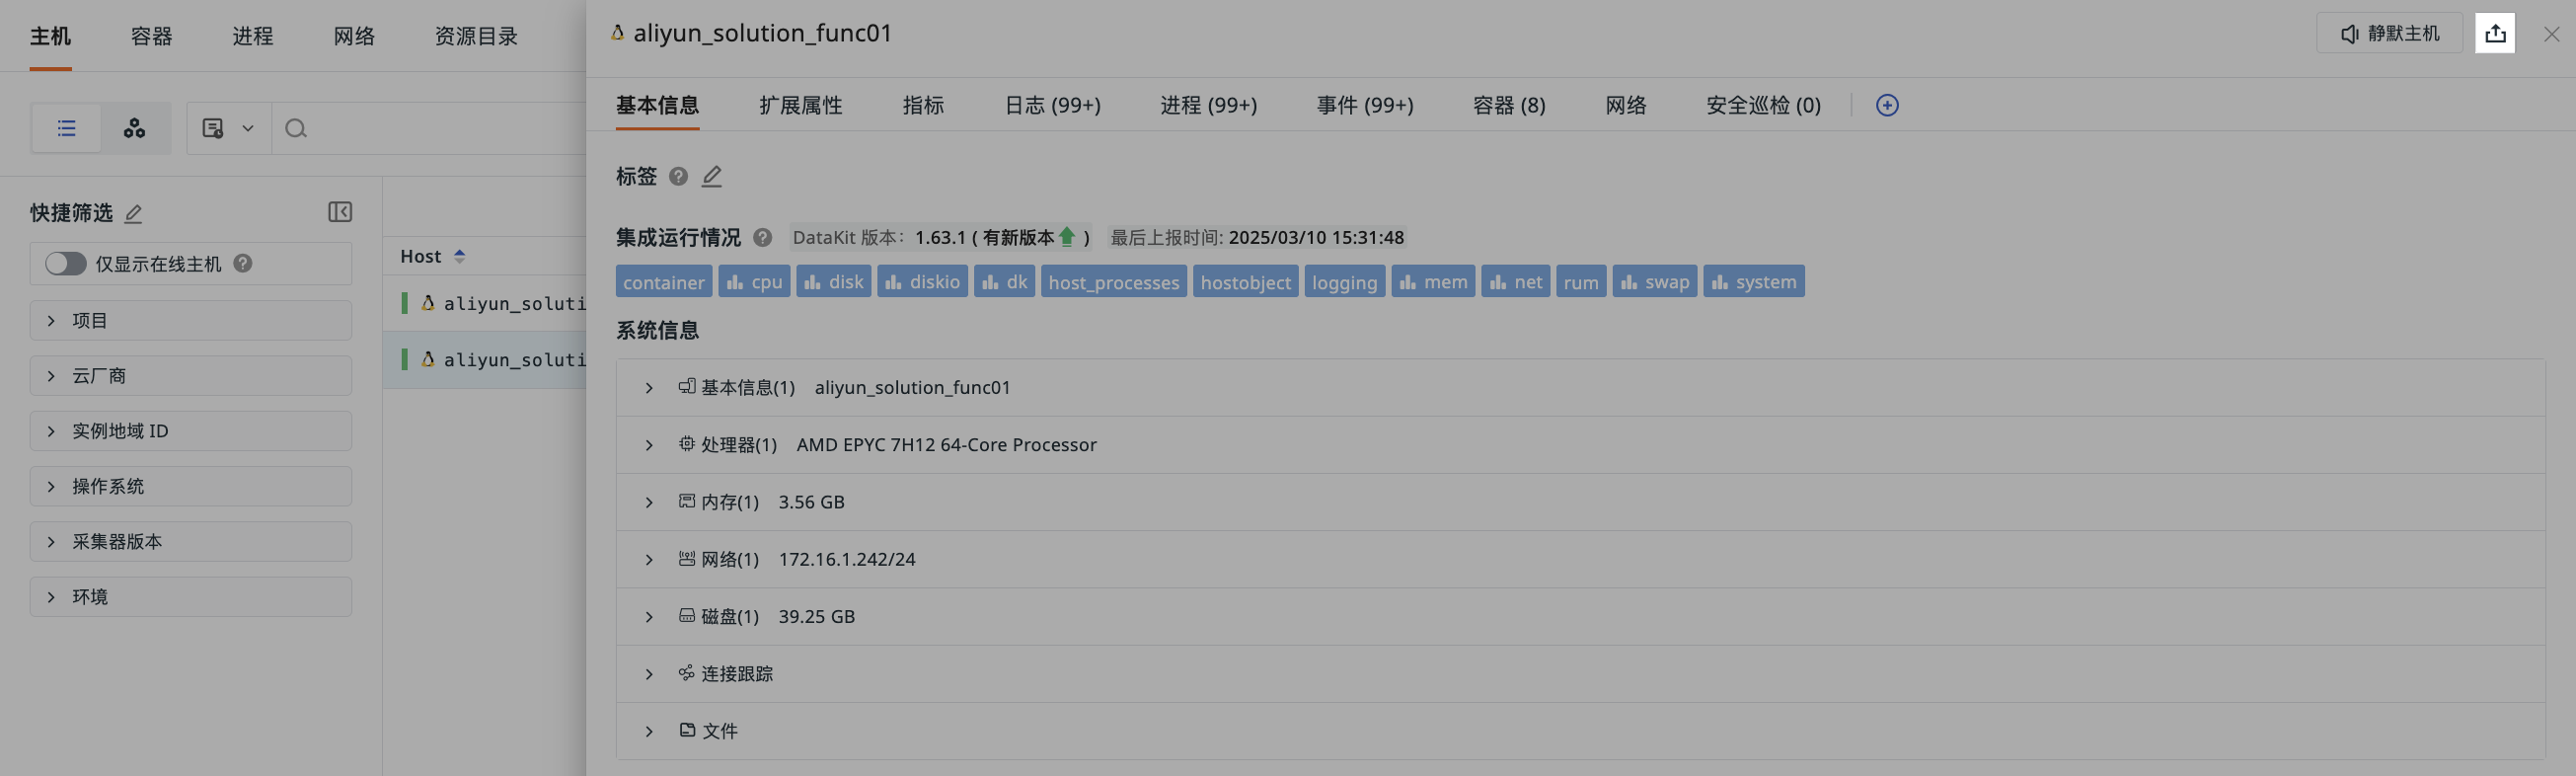
Basic Information
In the basic information section of the host details page, you can add host tags for this host, view integration operational status, system information, and cloud vendor information.
Integration Operational Status
Displays the DataKit version information installed on the host and the operational status of related collectors, including two states:
-
Collectors in normal operation are displayed in "light blue" by default.
-
Collectors with errors are displayed in "red" by default, and you can click to view error information.
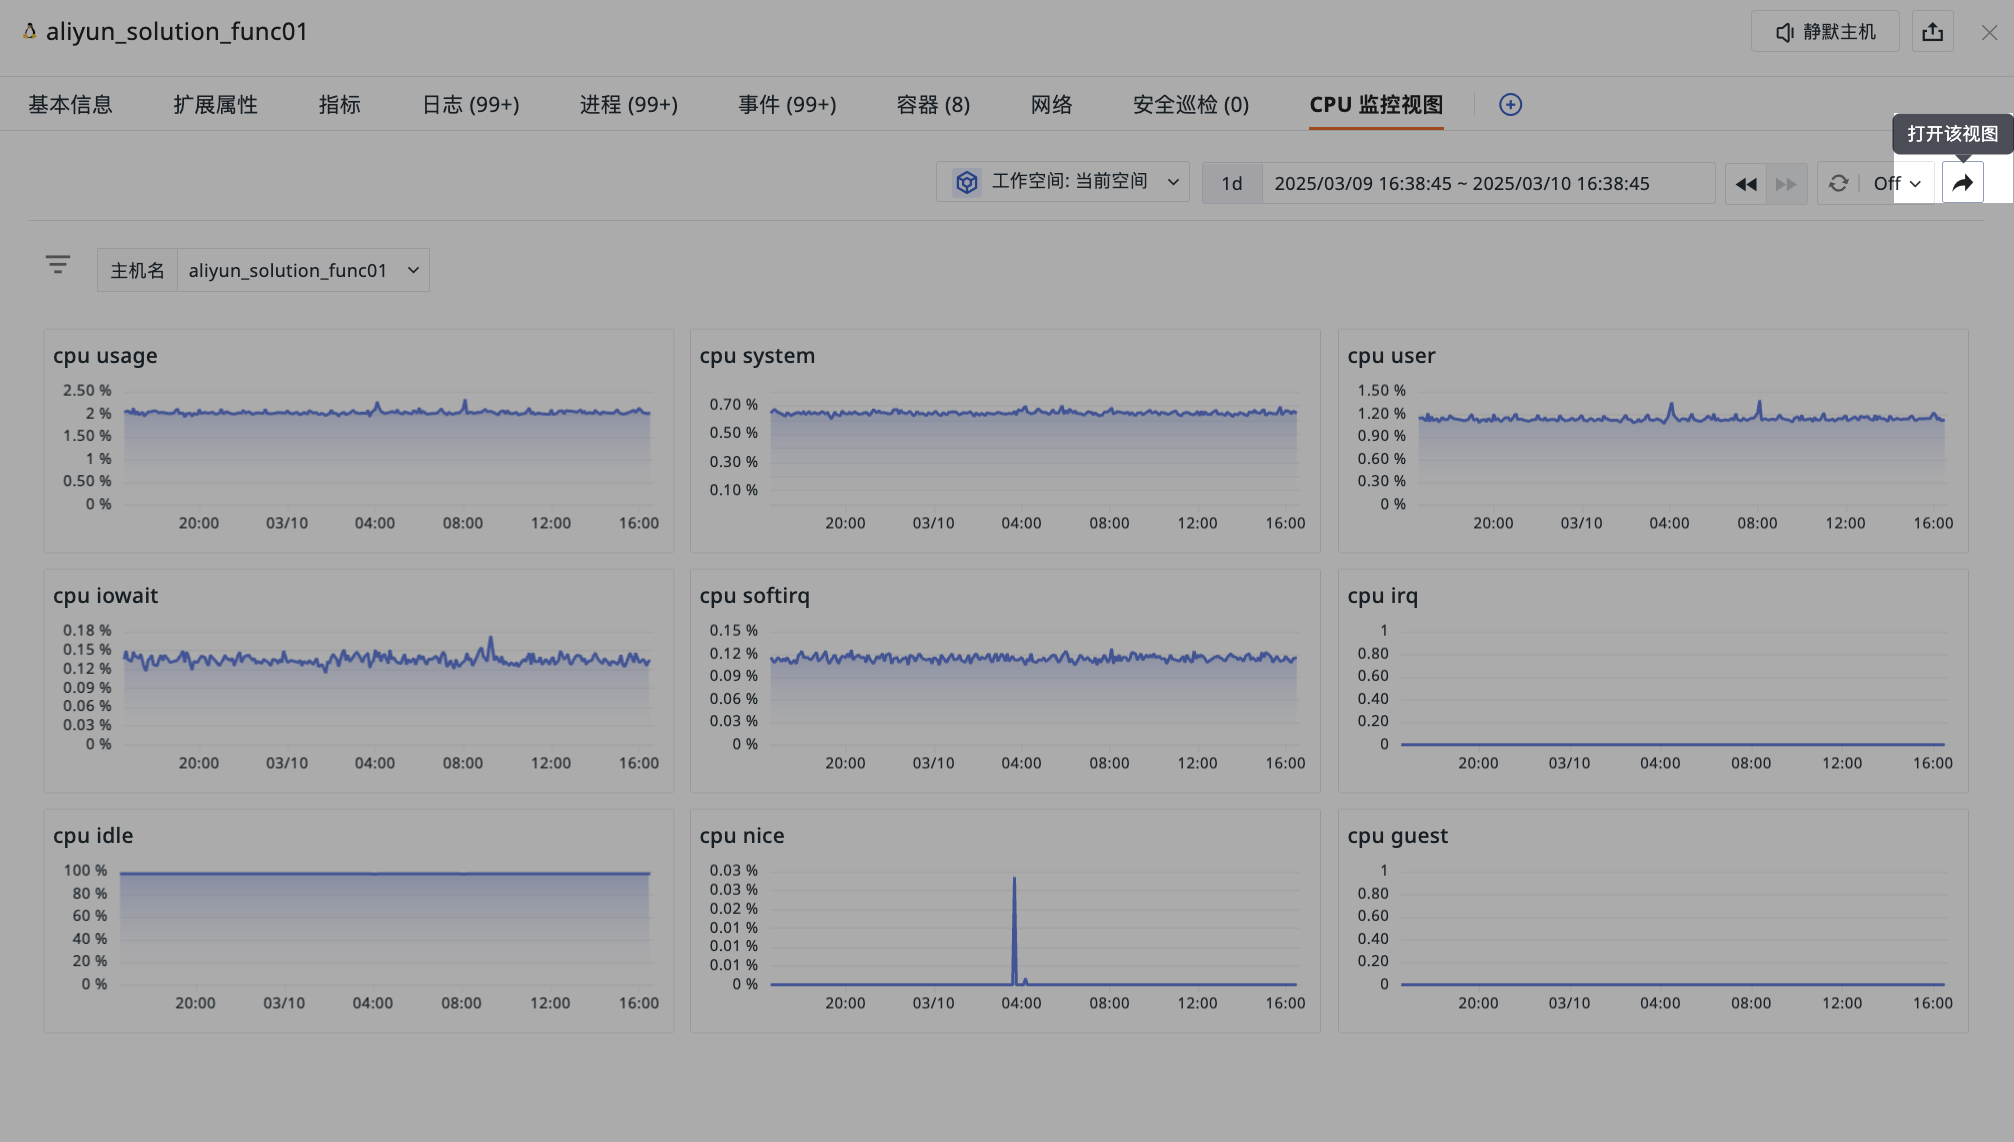
Collectors with the view symbol support directly opening the monitoring view on the current details page:
System Information
The host details page displays the host's system information, covering host name, operating system, processor, memory, network, disk, connection tracking, and files.
Cloud Vendor Information
For cloud hosts configured with Cloud Sync, the host details page also provides the following information: cloud platform, instance name, instance ID, instance specification, region, availability zone, creation time, network type, payment type, and IP address.
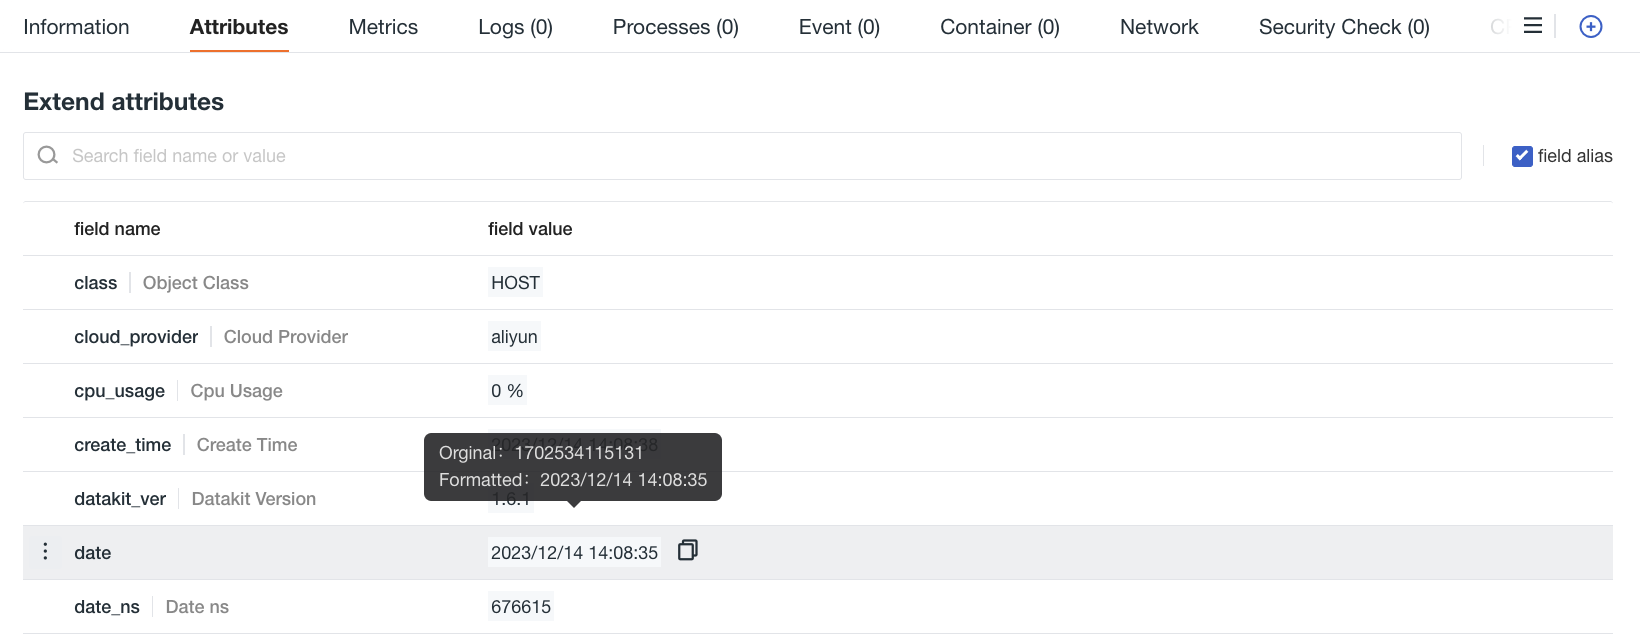
Extended Attributes
You can view all attributes of the related host. Supports searching and filtering by field name or value to narrow down the viewing scope.
Hover over the value of the corresponding field to display its original format.
Correlation Analysis
The system supports correlation analysis for each infrastructure object. Besides the host's basic information, you can also一站式了解 the host's corresponding metrics, logs, processes, events, containers, network, etc., enabling faster and more comprehensive monitoring of host operations.
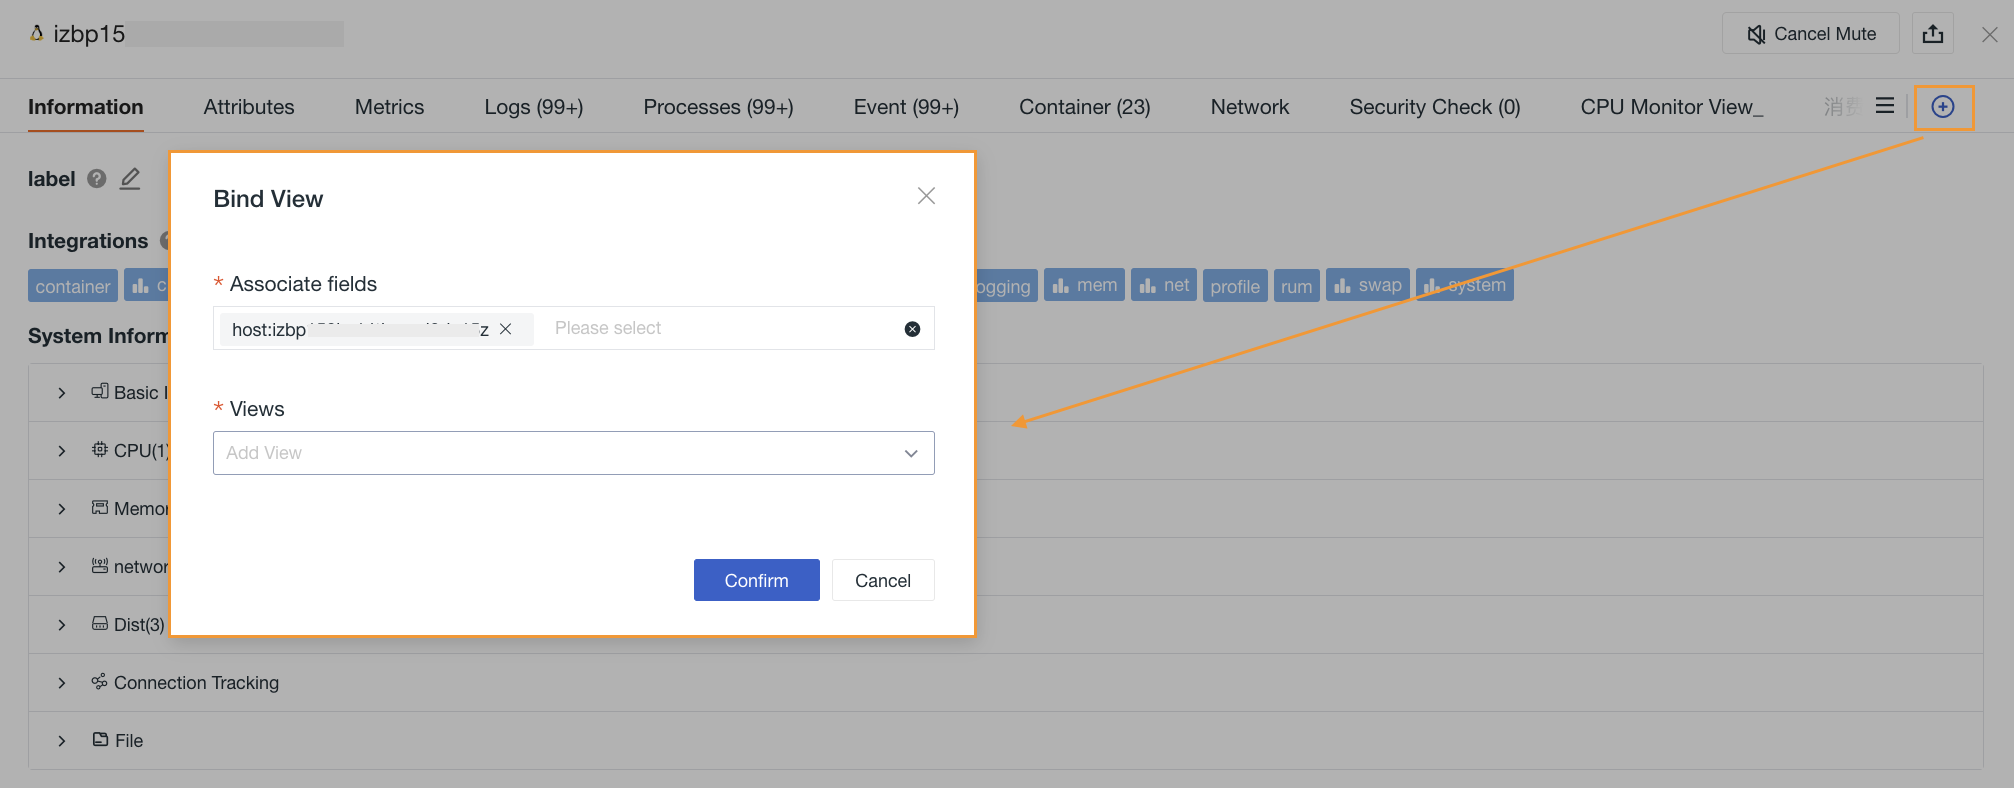
Bind Built-in Views
In addition to the views displayed by the system by default here, you can also bind user views.
-
Enter the built-in view binding page.
-
View the default associated fields. You can choose to keep or delete fields, and you can also add new
key:valuefields. -
Select a view.
-
After binding is completed, you can view the bound built-in views in the host object details. You can click the jump button to go to the corresponding built-in view page.
Note
If the current data does not contain the关联 fields of the bound view, the view will not be displayed on the details page; otherwise, it will be displayed.


Click the jump button to enter the corresponding built-in view page.
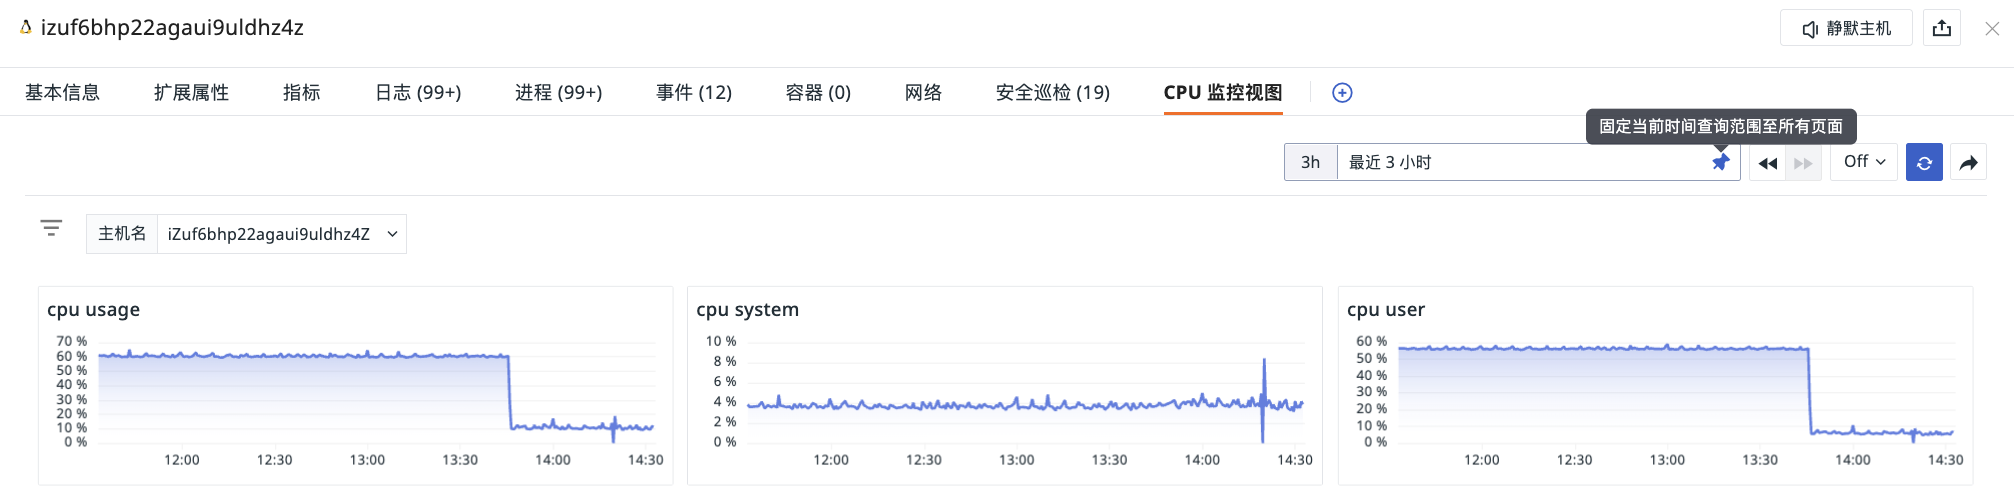
Time Widget
The associated views are equipped with a Time Widget, allowing you to determine the time range for data display by filtering time. Additionally, selecting "Pin" time range fixes the current query time, ensuring consistent time range settings across different pages.
For example, if you select "Last 3 hours" and "Pin" the time range in the Explorer/Dashboard selection/Details page/etc., and then switch to the host details page, the time range will remain "Last 3 hours".
Export Data
To export a piece of host data, click the icon in the upper right corner.
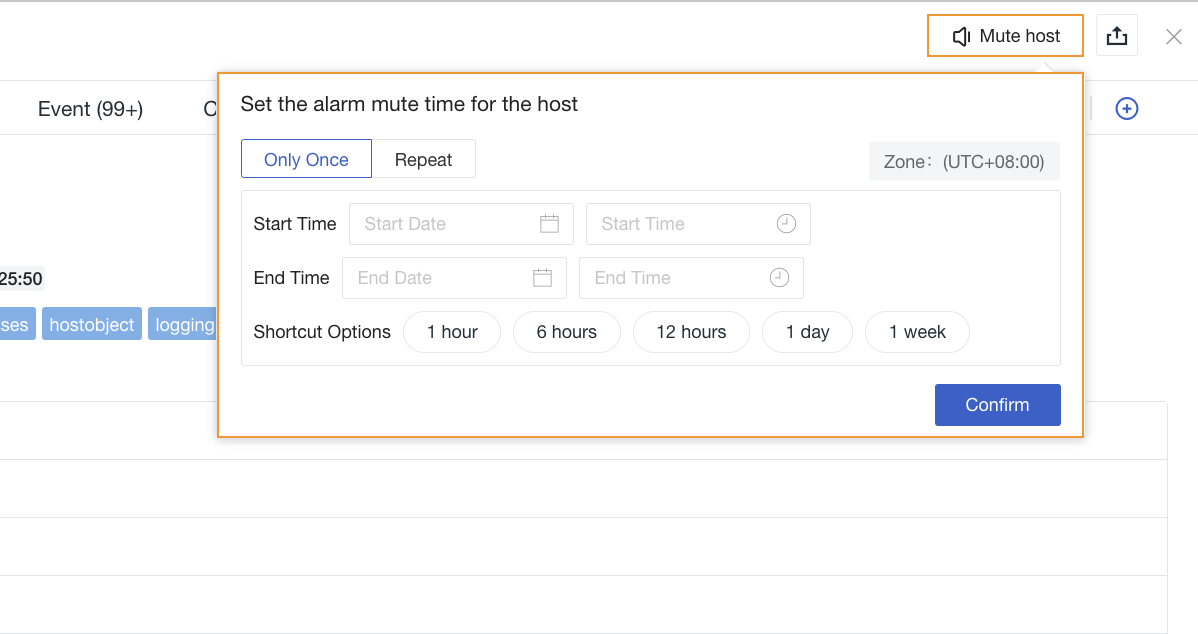
Mute Host
Can be used to temporarily ignore alert notifications for specific hosts, reducing干扰 and focusing on important tasks, such as known temporary issues or during maintenance.
-
On the host details page, click Mute Host.
-
Select the mute time type.
-
Confirm.
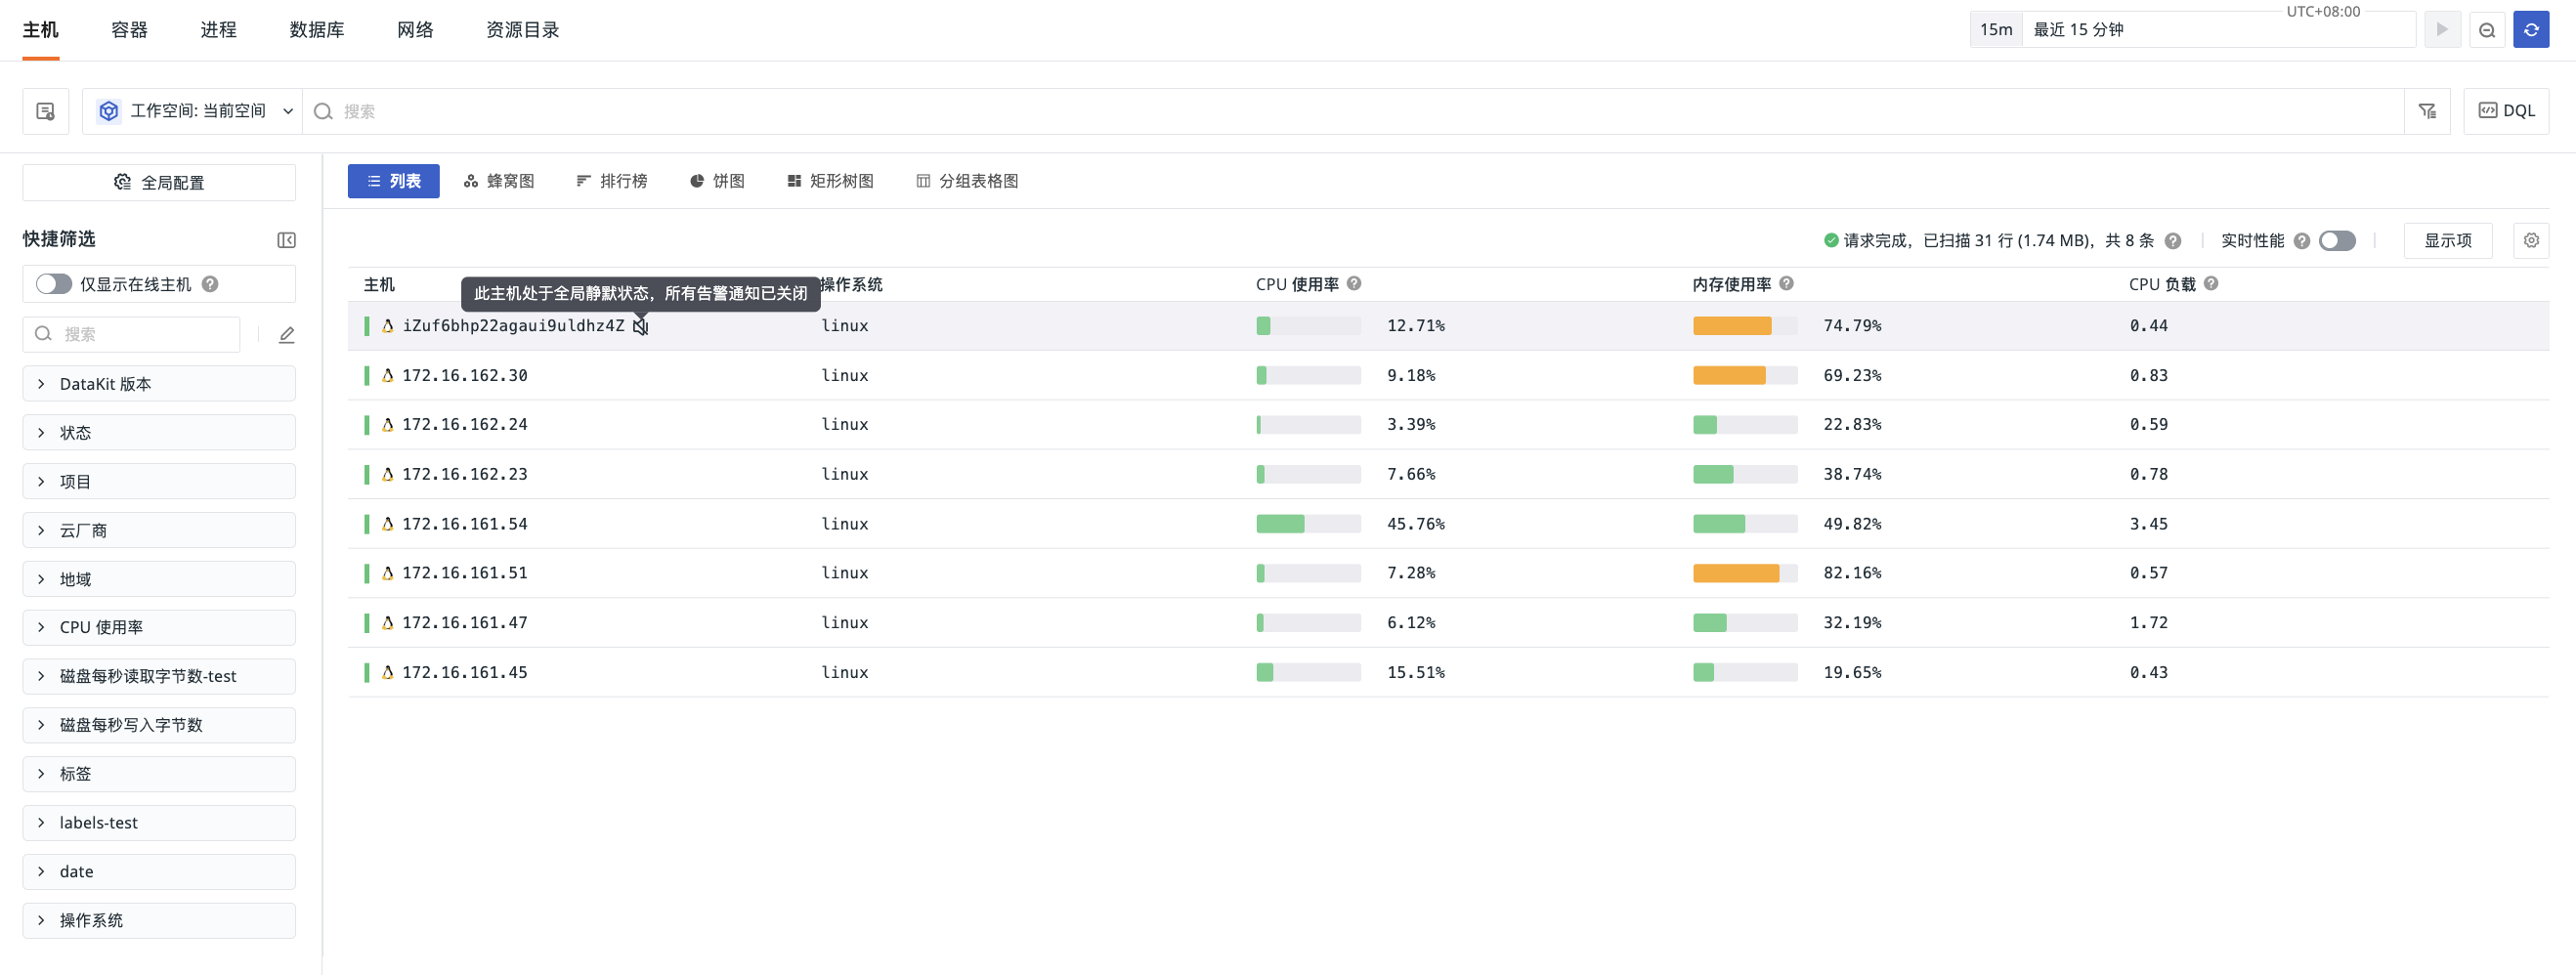
After configuration, return to the host list; muted hosts will display a mute identifier. If there are many hosts, you can filter the list using the df_mute field.
Other Sources of Muted Hosts
Through rule configuration (automatic/batch): When a mute rule is created via Open API or monitor rules, and the rule meets the following two conditions simultaneously, the hosts命中 by the rule will enter a global mute state:
-
Mute Scope is set to "All".
-
The matched event attributes are empty, or only have the
host(host) attribute.
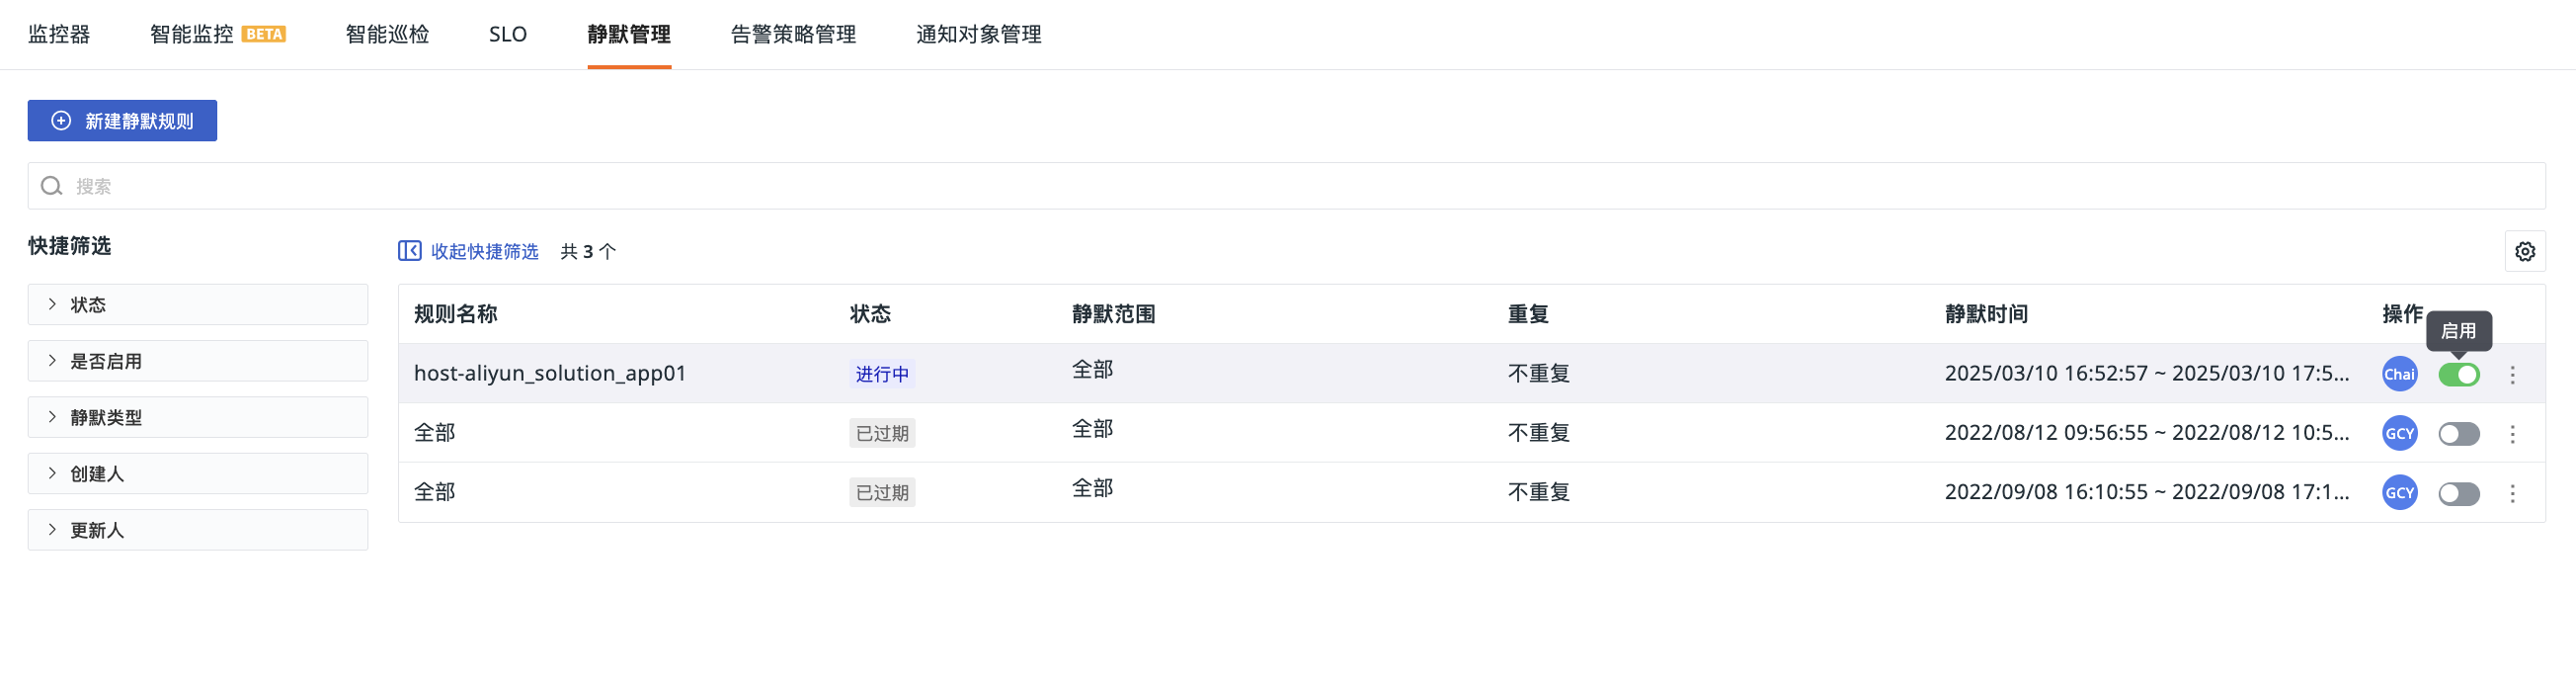
During the mute time, you will not receive all alert notifications for this host, and related alert events will be automatically stored in the Event Center. You can view all muted hosts in Monitoring > Mute Management.
To cancel the mute, you can directly click "Unmute" in the host details, or operate in "Monitoring > Mute Management".