Network Anomaly Detection
Network Anomaly Detection is used to monitor the metrics data of network performance in the workspace. By setting threshold ranges, alarms will be triggered when the metrics reach the threshold. Guance supports setting alarms for individual metrics and customizing alert levels.
Use Case
Support monitoring metric data from netflow/httpflow data sources. For example, monitor metrics such as request count, error count, and error rate for host data sources with httpflow.
Setup
Step 2. Detect the Configuration
Detection Frequency: The execution frequency of detection rules, including 1m/5m/15/30m/1h/6h (5m is selected by default).
Detection Interval: The time range of detection metric query when each task is executed. The optional detection interval will be different due to the influence of detection frequency.
| Detection Frequency | Detection Interval (Drop-down Option) |
|---|---|
| 1m | 1m/5m/15m/30m/1h/3h |
| 5m | 5m/15m/30m/1h/3h |
| 15m | 15m/30m/1h/3h/6h |
| 30m | 30m/1h/3h/6h |
| 1h | 1h/3h/6h/12h/24h |
| 6h | 6h/12h/24h |
Detection Metrics: Set the metric of detection data. Supports setting metric data within a certain time range in the list of all/single services in the workspace.
| Field | Decription |
|---|---|
| Source | Support: netflow,httpflow. |
| Metric | |
| Filtering | Based on the metric label, the data of detection metric is screened and the detection data range is limited. Support to add one or more label filters and fuzzy matching and mismatching filters. |
| Detection Dimension | The corresponding string type (keyword) fields in the configuration data can be selected as detection dimensions. At present, the detection dimensions support selecting up to three fields. Through the combination of fields of multiple detection dimensions, a certain detection object can be determined, and the guance will judge whether the statistical index corresponding to a detection object meets the threshold of trigger conditions, and if it meets the conditions, an event will be generated. (For example, if the instrumentation dimensions host and host_ip are selected, the instrumentation object can be {host: host1, host_ip: 127.0.0.1}.) |
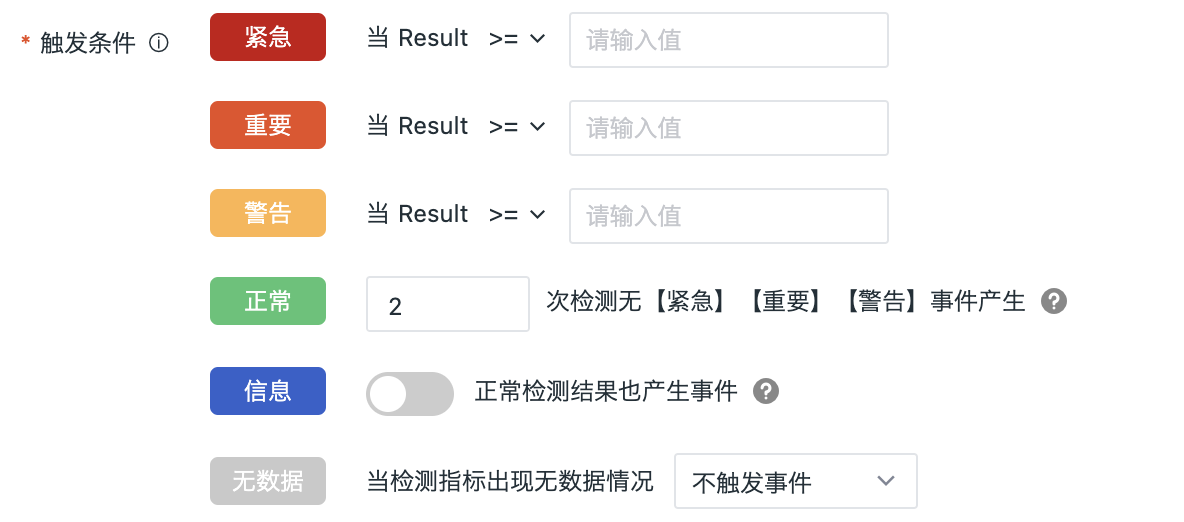
Trigger Condition: Set the trigger condition of alert level.
Configure the trigger condition and severity. When the query result is multiple values, an event will be generated if any value meets the trigger condition.
See Event Levels.
I. Alert levels: Critical (red), Important (orange), Warning (yellow): Based on the configured conditions using operators.
II. Alert levels: OK (green), Information (blue): Based on the configured number of detections, as explained below:
- One test is performed for each test task, if "test frequency = 5 minutes", then one test = 5 minutes
- You can customize the number of tests, such as "Test frequency = 5 minutes", then 3 tests = 15 minutes
| Level | Description |
|---|---|
| OK | After the detection rule takes effect, if the result of an urgent, important, or warning abnormal event returns to normal within the configured number of custom detections, a recovery alert event is generated.  Recovery alert events are not affected by Mute Alerting. If no detection count is set for recovery alert events, the alert event will not recover and will always appear in the Events > Unrecovered Events List. Recovery alert events are not affected by Mute Alerting. If no detection count is set for recovery alert events, the alert event will not recover and will always appear in the Events > Unrecovered Events List. |
| Information | Events are generated even for normal detection results. |
III. Alert level: No Data (gray): The no data state supports three configuration strategies: Trigger No-Data Event, Trigger Recovery Event, and Untrigger Event.
Step 2: Event Notification
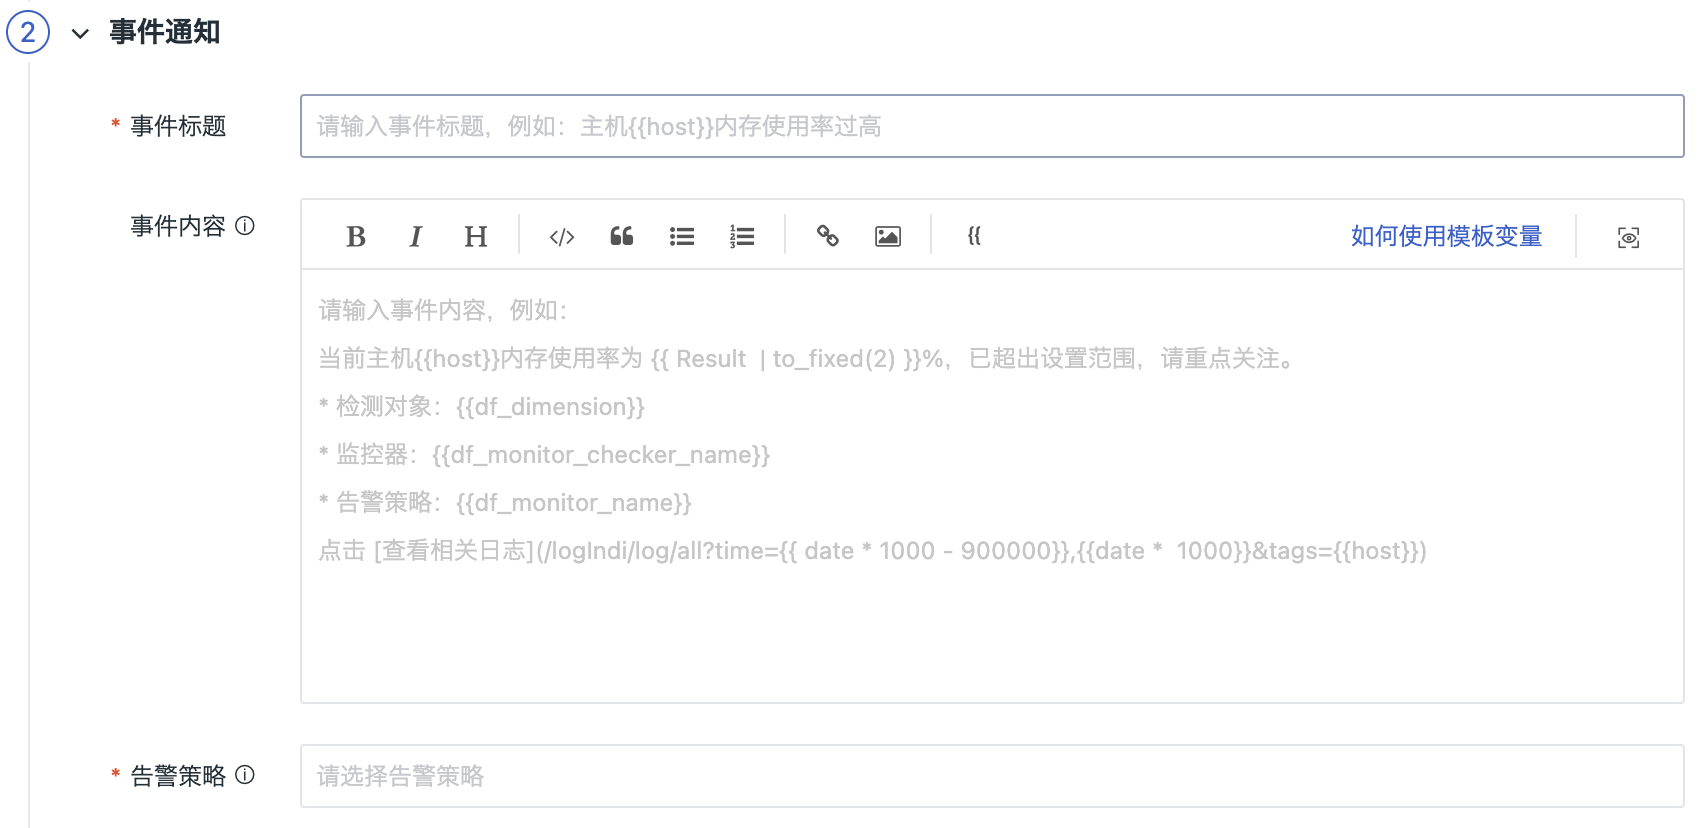
Event Title:Set the event name of the alert trigger condition; support the use of preset template variables.
Note: In the latest version, the Monitor Name will be automatically generated based on the Event Title input. In older monitors, there may be inconsistencies between the Monitor Name and the Event Title. To enjoy a better user experience, please synchronize to the latest version as soon as possible. One-click replacement with event title is supported.
Event Content: The content of the event notification sent when the trigger conditions are met. Support inputting text in Markdown format, previewing effects, the use of preset associated links and the use of preset template variables.
Note: Different alert notification objects support different Markdown syntax. For example, WeCom does not support unordered lists.
Alarm Strategy: After the monitoring meets the trigger conditions, immediately send an alert message to the specified notification targets. The Alert Strategy includes the event level that needs to be notified, the notification targets and the mute alerting period.
Synchronously create Issue: If abnormal events occur under this monitor, an issue for anomaly tracking will be created synchronously and delivered to the channel for anomaly tracking. You can go to Incident > Your selected Channel to view it.
Step 3: Association
Associate Dashboard: Every monitor supports associating with a dashboard for quick navigation and viewing.
Example
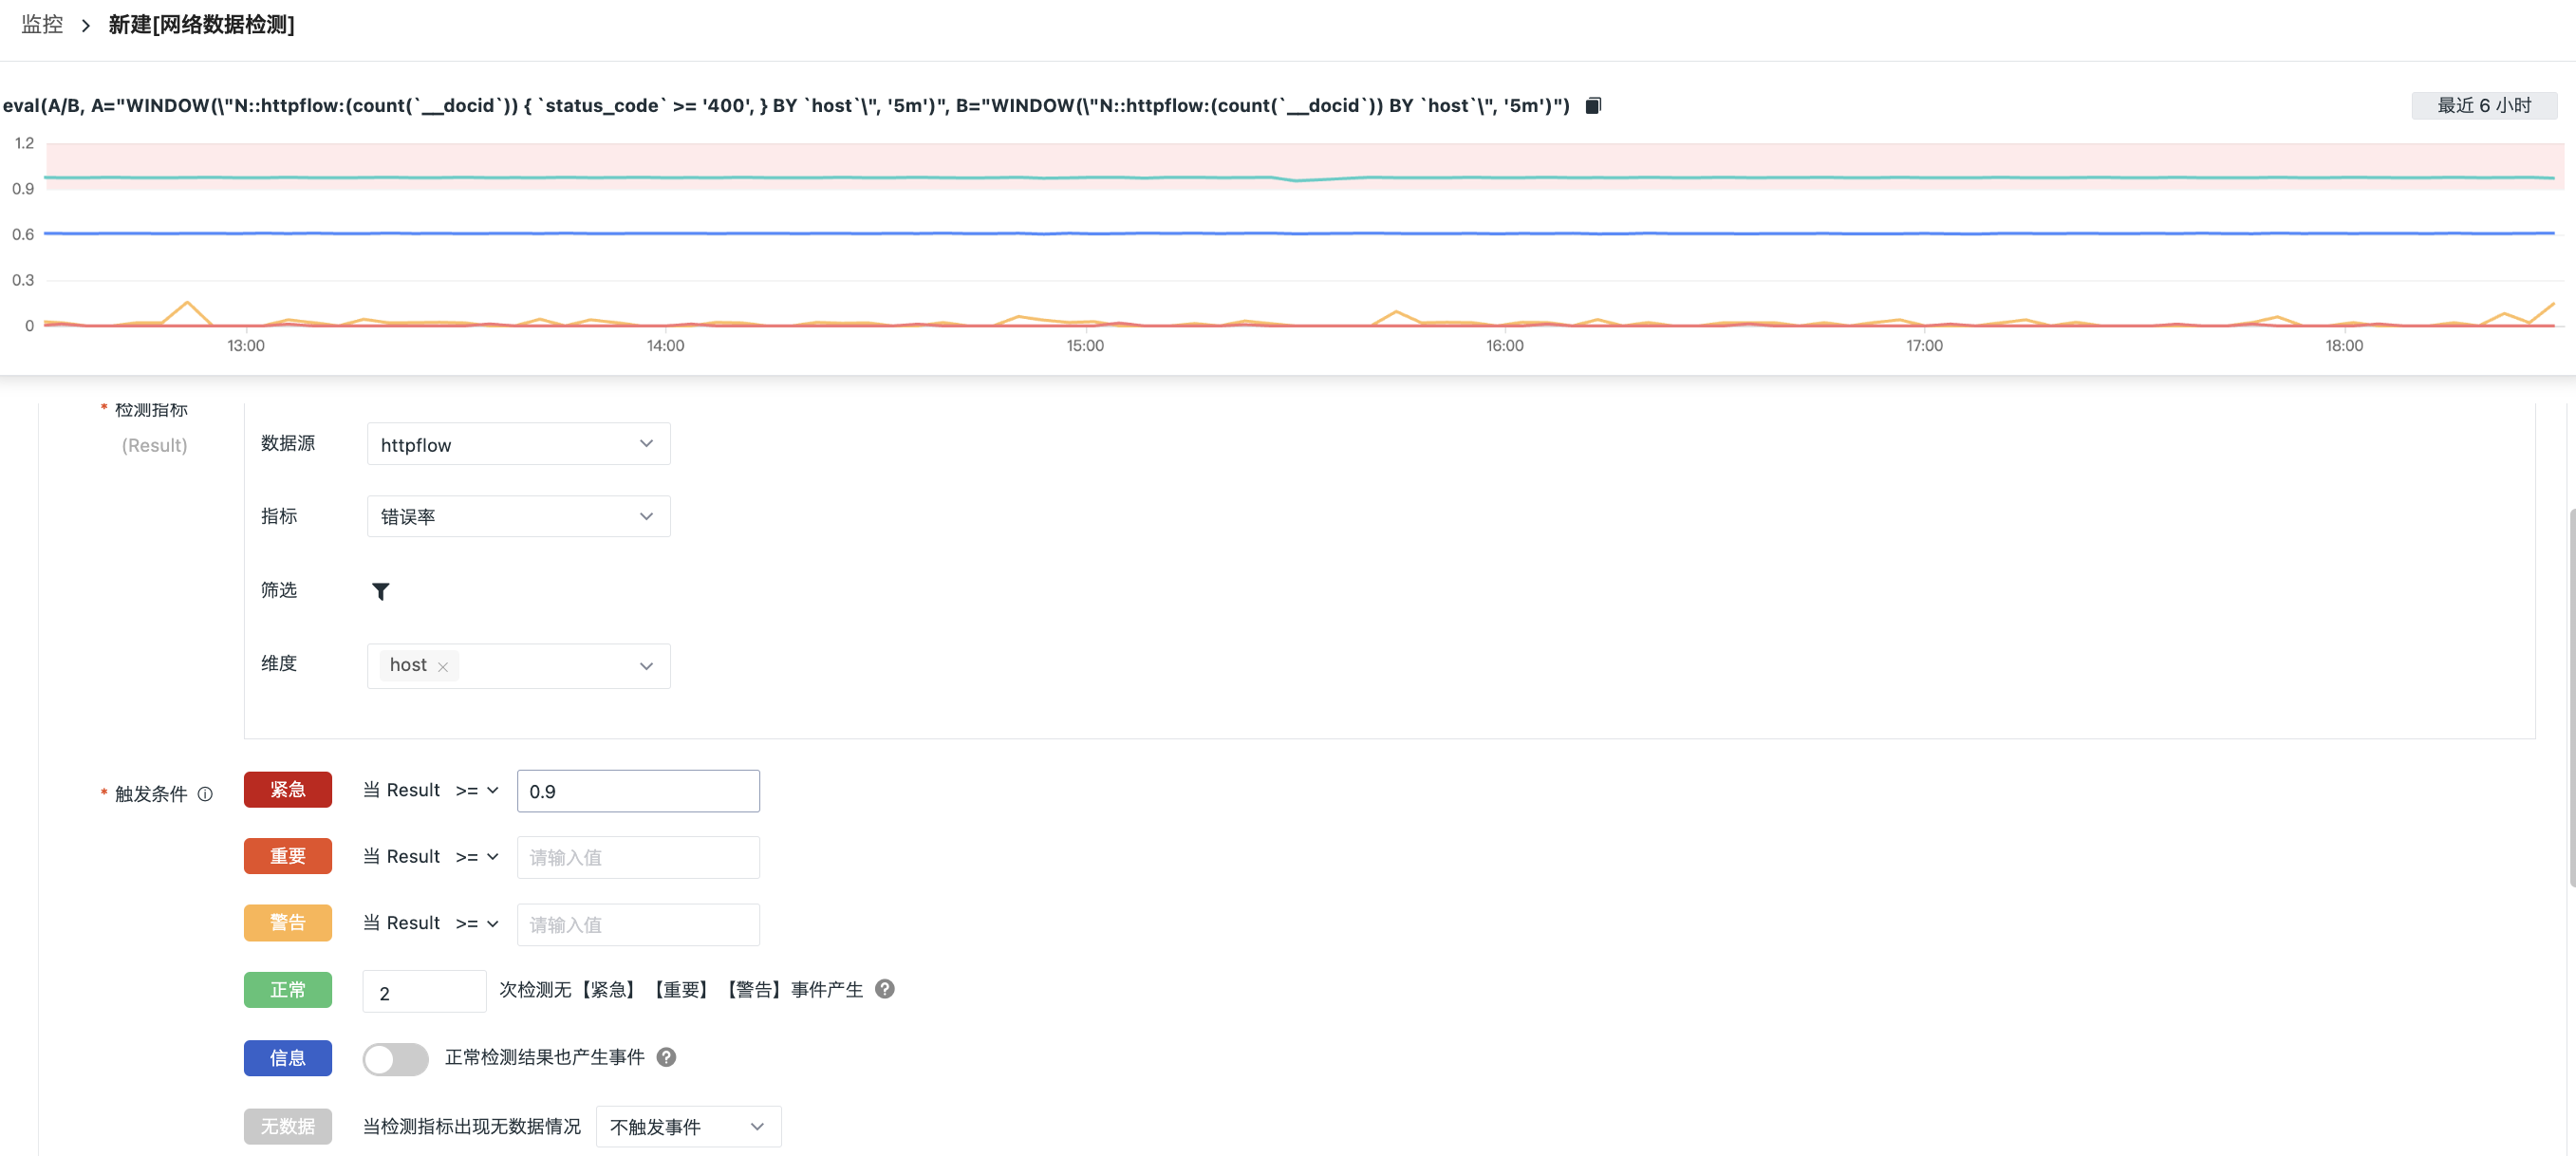
Monitor the error rate of the host data source as httpflow, and trigger an exception event when the error rate exceeds 90%.


