DDTrace Golang
There are two ways to instrument your Go application:
1. Compile-time Instrumentation
- Ensures maximum coverage of your tracing instrumentation.
- Does not require source code modifications, making it ideal for integrating at the CI/CD level.
- Install DataKit and config DDTrace
2. Manual Instrumentation
Use dd-trace-go in conjunction with our integration packages to automatically generate spans for libraries of your choosing. This option:
- Gives you complete control over which parts of your application are traced.
- Requires modifying the application’s source code.
Requirements
- Applications must be managed using Go modules. Module vendoring is supported.
- Go Tracer requires Go 1.18+.
- Install Orchestrion
If installation fails, try cloning the project locally and then compiling.
git clone https://github.com/DataDog/orchestrion.git
cd orchestrion/
go build
cp orchestrion $GOPATH/bin/
- Initialize Orchestrion
- Compile & Run
Use one of the following three methods to compile your project:
- Before the
go buildcommand:
- Using the
-toolexecmethod:
go build -toolexec="orchestrion toolexec" .
go run -toolexec="orchestrion toolexec" .
go test -toolexec="orchestrion toolexec" ./...
- Modify the environment variable
$GOFLAGS:
- Install Orchestrion
- Initialize Orchestrion
- Download dependencies
- Run
More Documentation
Manual instrumentation
Install the DDTrace Golang SDK:
Install the profiling library
Other libraries related to components, as needed, for example:
go get gopkg.in/DataDog/dd-trace-go.v1/contrib/gorilla/mux
go get gopkg.in/DataDog/dd-trace-go.v1/contrib/net/http
go get gopkg.in/DataDog/dd-trace-go.v1/contrib/database/sql
We can learn more about available tracing SDKs from the Github plugin library or Datadog's related support documentation.
Code Examples
Simple HTTP Server
package main

import (
  "log"
  "net/http"
  "time"

  httptrace "gopkg.in/DataDog/dd-trace-go.v1/contrib/net/http"
  "gopkg.in/DataDog/dd-trace-go.v1/ddtrace/tracer"
  "gopkg.in/DataDog/dd-trace-go.v1/profiler"
)

func main() {
  tracer.Start(
    tracer.WithService("test"),
    tracer.WithEnv("test"),
  )
  defer tracer.Stop()

  err := profiler.Start(
    profiler.WithService("test"),
    profiler.WithEnv("test"),
    profiler.WithProfileTypes(
      profiler.CPUProfile,
      profiler.HeapProfile,
      // The profiles below are disabled by
      // default to keep overhead low, but
      // can be enabled as needed.
      // profiler.BlockProfile,
      // profiler.MutexProfile,
      // profiler.GoroutineProfile,
    ),
  )
  if err != nil {
    log.Fatal(err)
  }
  defer profiler.Stop()

  // Create a traced mux router
  mux := httptrace.NewServeMux()
  // Continue using the router as you normally would.
  mux.HandleFunc("/", func(w http.ResponseWriter, r *http.Request) {
    time.Sleep(time.Second)
    w.Write([]byte("Hello World!"))
  })
  if err := http.ListenAndServe(":18080", mux); err != nil {
    log.Fatal(err)
  }
}
Compile and run
Manual Tracing
The following code demonstrates trace data collection for a file opening operation.
In the main() entry code, set the basic trace parameters and start tracing:
package main

import (
    "io/ioutil"
    "os"
    "time"

    "gopkg.in/DataDog/dd-trace-go.v1/ddtrace/ext"
    "gopkg.in/DataDog/dd-trace-go.v1/ddtrace/tracer"
)

func main() {
    tracer.Start(
        tracer.WithEnv("prod"),
        tracer.WithService("test-file-read"),
        tracer.WithServiceVersion("1.2.3"),
        tracer.WithGlobalTag("project", "add-ddtrace-in-golang-project"),
    )

    // end of app exit, make sure tracer stopped
    defer tracer.Stop()

    tick := time.NewTicker(time.Second)
    defer tick.Stop()

    // your-app-main-entry...
    for {
        runApp()
        runAppWithError()

        select {
        case <-tick.C:
        }
    }
}

func runApp() {
    var err error
    // Start a root span.
    span := tracer.StartSpan("get.data")
    defer span.Finish(tracer.WithError(err))

    // Create a child of it, computing the time needed to read a file.
    child := tracer.StartSpan("read.file", tracer.ChildOf(span.Context()))
    child.SetTag(ext.ResourceName, os.Args[0])

    // Perform an operation.
    var bts []byte
    bts, err = ioutil.ReadFile(os.Args[0])
    span.SetTag("file_len", len(bts))
    child.Finish(tracer.WithError(err))
}

func runAppWithError() {
    var err error
    // Start a root span.
    span := tracer.StartSpan("get.data")

    // Create a child of it, computing the time needed to read a file.
    child := tracer.StartSpan("read.file", tracer.ChildOf(span.Context()))
    child.SetTag(ext.ResourceName, "somefile-not-found.go")

    defer func() {
        child.Finish(tracer.WithError(err))
        span.Finish(tracer.WithError(err))
    }()

    // Perform an error operation.
    if _, err = ioutil.ReadFile("somefile-not-found.go"); err != nil {
        // error handle
    }
}
Compile and run
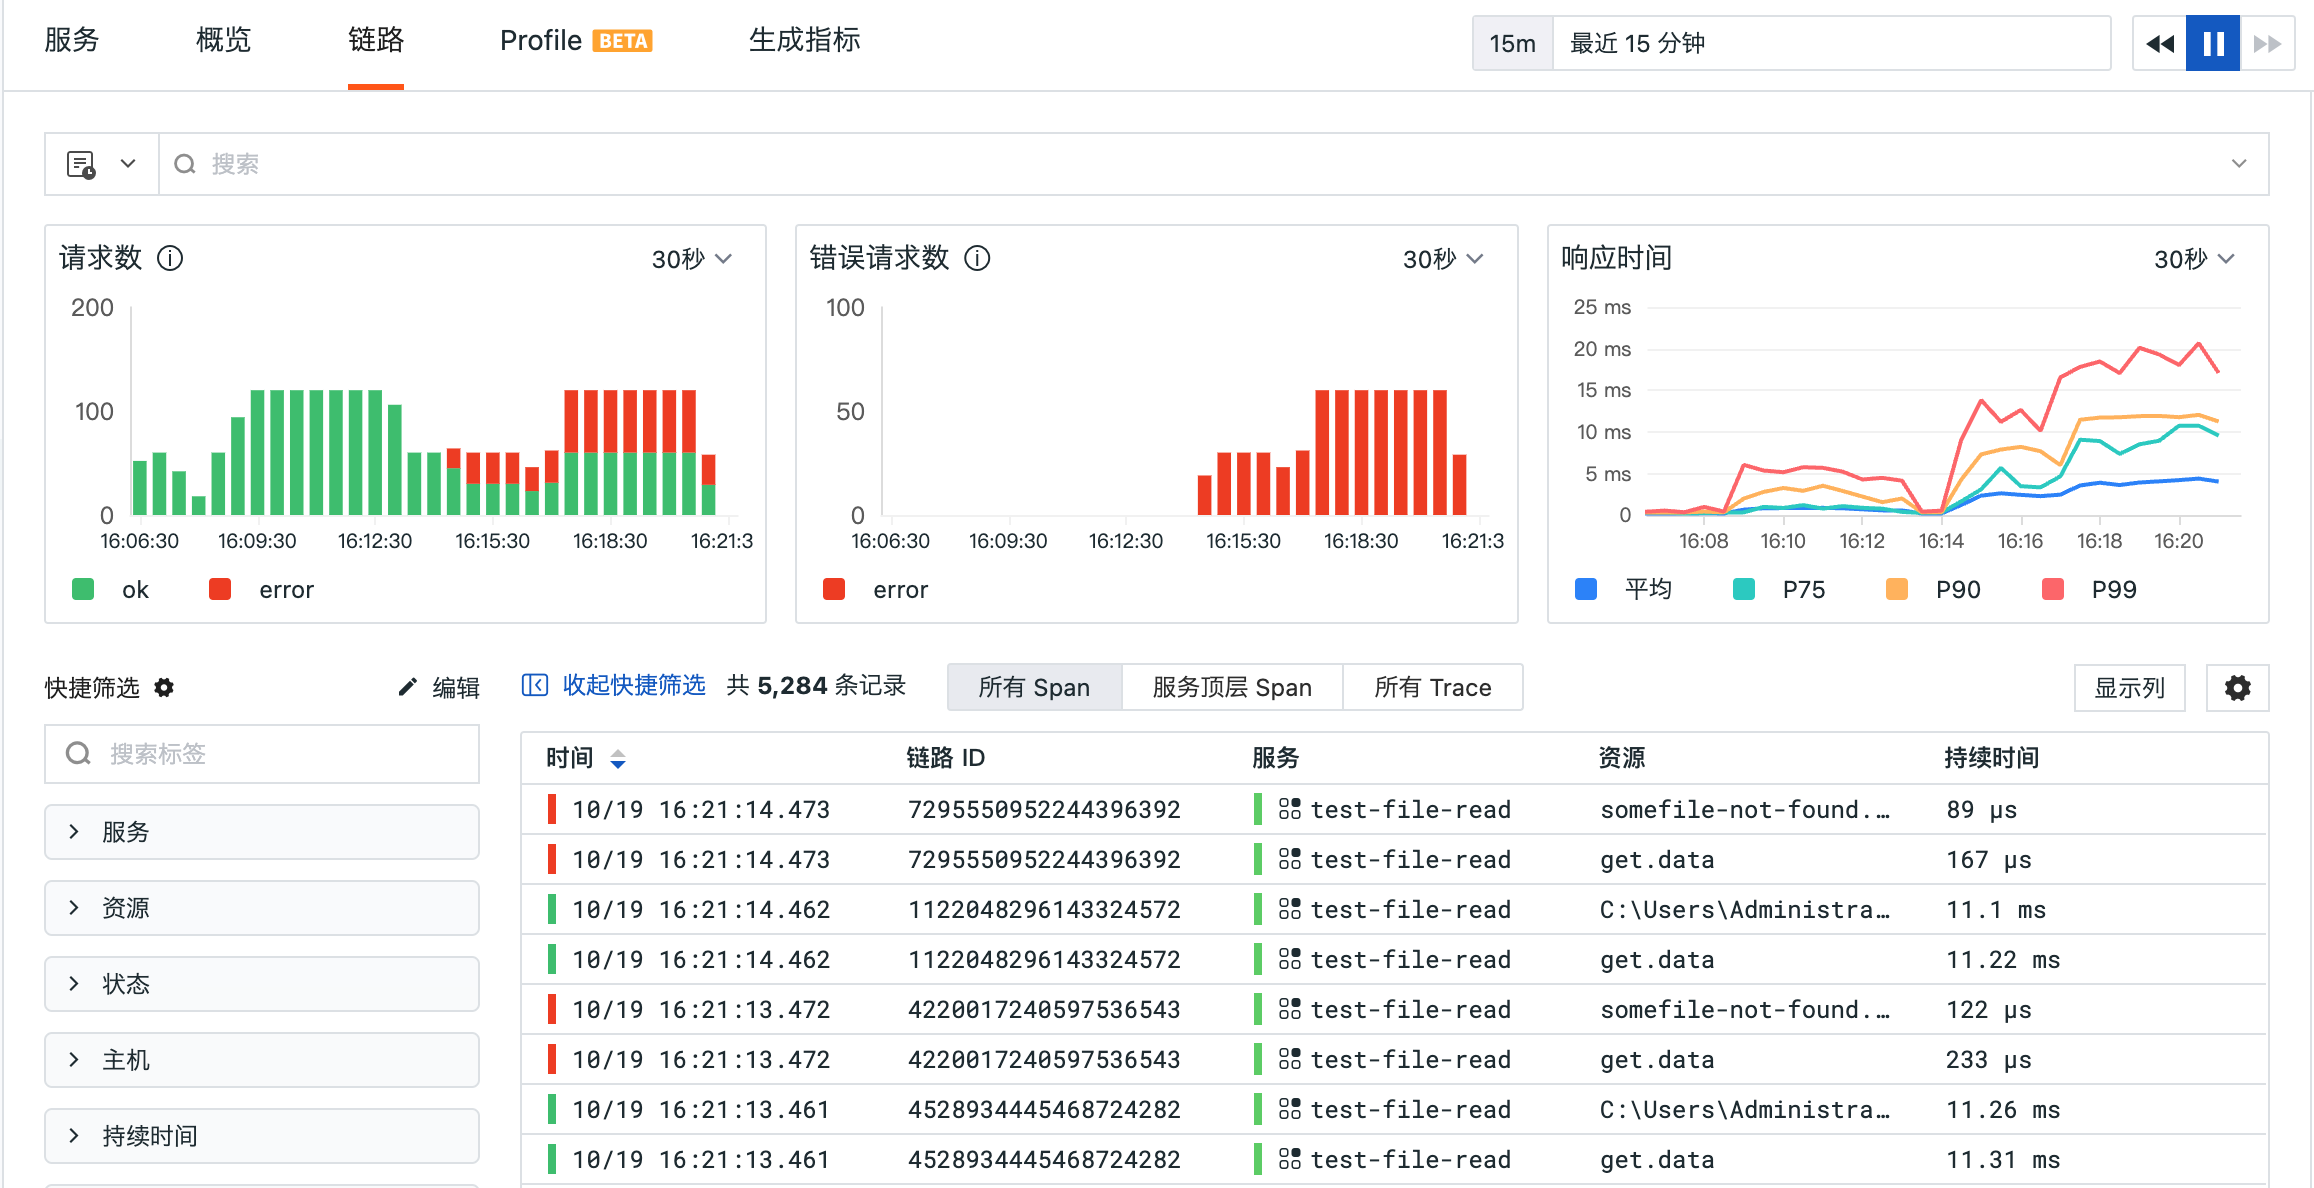
After running the program for a while, you can see trace data similar to the following in Guance:
Supported Environment Variables
The following environment variables are supported to specify some configuration parameters of DDTrace when starting the program, and their basic form is:
For more environment variable support, see DDTrace-Go Documentation.
Attention
These environment variables will be overridden by the corresponding fields injected with WithXXX() in the code, so the configuration injected by the code has a higher priority. These ENVs only take effect when the corresponding fields are not specified in the code.
-
DD_VERSIONSets the application version, such as
1.2.3,2022.02.13 -
DD_SERVICESets the application service name
-
DD_ENVSets the current environment of the application, such as
prod,pre-prod, etc. -
DD_AGENT_HOSTDefault:
localhostSets the IP address of DataKit, and the trace data generated by the application will be sent to DataKit
-
DD_TRACE_AGENT_PORTSets the DataKit trace data receiving port. Here you need to manually specify the DataKit HTTP port (usually 9529)
-
DD_DOGSTATSD_PORTDefault value:
8125If you want to receive StatsD data generated by DDTrace, you need to manually enable the StatsD collector on DataKit -
DD_TRACE_SAMPLING_RULESDefault:
nilHere a JSON array is used to represent the sampling settings (sampling rate application is in array order), where
sample_rateis the sampling rate, and the value range is[0.0, 1.0].Example 1: Set the global sampling rate to 20%:
DD_TRACE_SAMPLING_RULES='[{"sample_rate": 0.2}]' ./my-appExample 2: Service name wildcard
app1.*, and the span name isabc, set the sampling rate to 10%, otherwise, set the sampling rate to 20%:DD_TRACE_SAMPLING_RULES='[{"service": "app1.*", "name": "b", "sample_rate": 0.1}, {"sample_rate": 0.2}]' ./my-app -
DD_TRACE_SAMPLE_RATEDefault:
nilEnable the above sampling rate switch
-
DD_TRACE_RATE_LIMITSets the number of span samples per second for each Golang process. If
DD_TRACE_SAMPLE_RATEis already turned on, the default is 100 -
DD_TAGSDefault:
[]Here you can inject a set of global tags, which will appear in each span and profile data. Multiple tags can be separated by spaces and commas, such as
layer:api,team:intake,layer:api team:intake -
DD_TRACE_STARTUP_LOGSDefault:
trueEnable DDTrace-related configuration and diagnostic logs
-
DD_TRACE_DEBUGDefault:
falseEnable DDTrace-related debug logs
-
DD_TRACE_ENABLEDDefault:
trueEnable trace switch. If this switch is manually turned off, no trace data will be generated
-
DD_SERVICE_MAPPINGDefault:
nullDynamically rename service names, service name mappings can be separated by spaces and commas, such asmysql:mysql-service-name,postgres:postgres-service-name,mysql:mysql-service-name postgres:postgres-service-name