Analysis Dashboard
Based on the collected APM data, the system provides you with a real-time core data dashboard in APM > Analysis Dashboard.
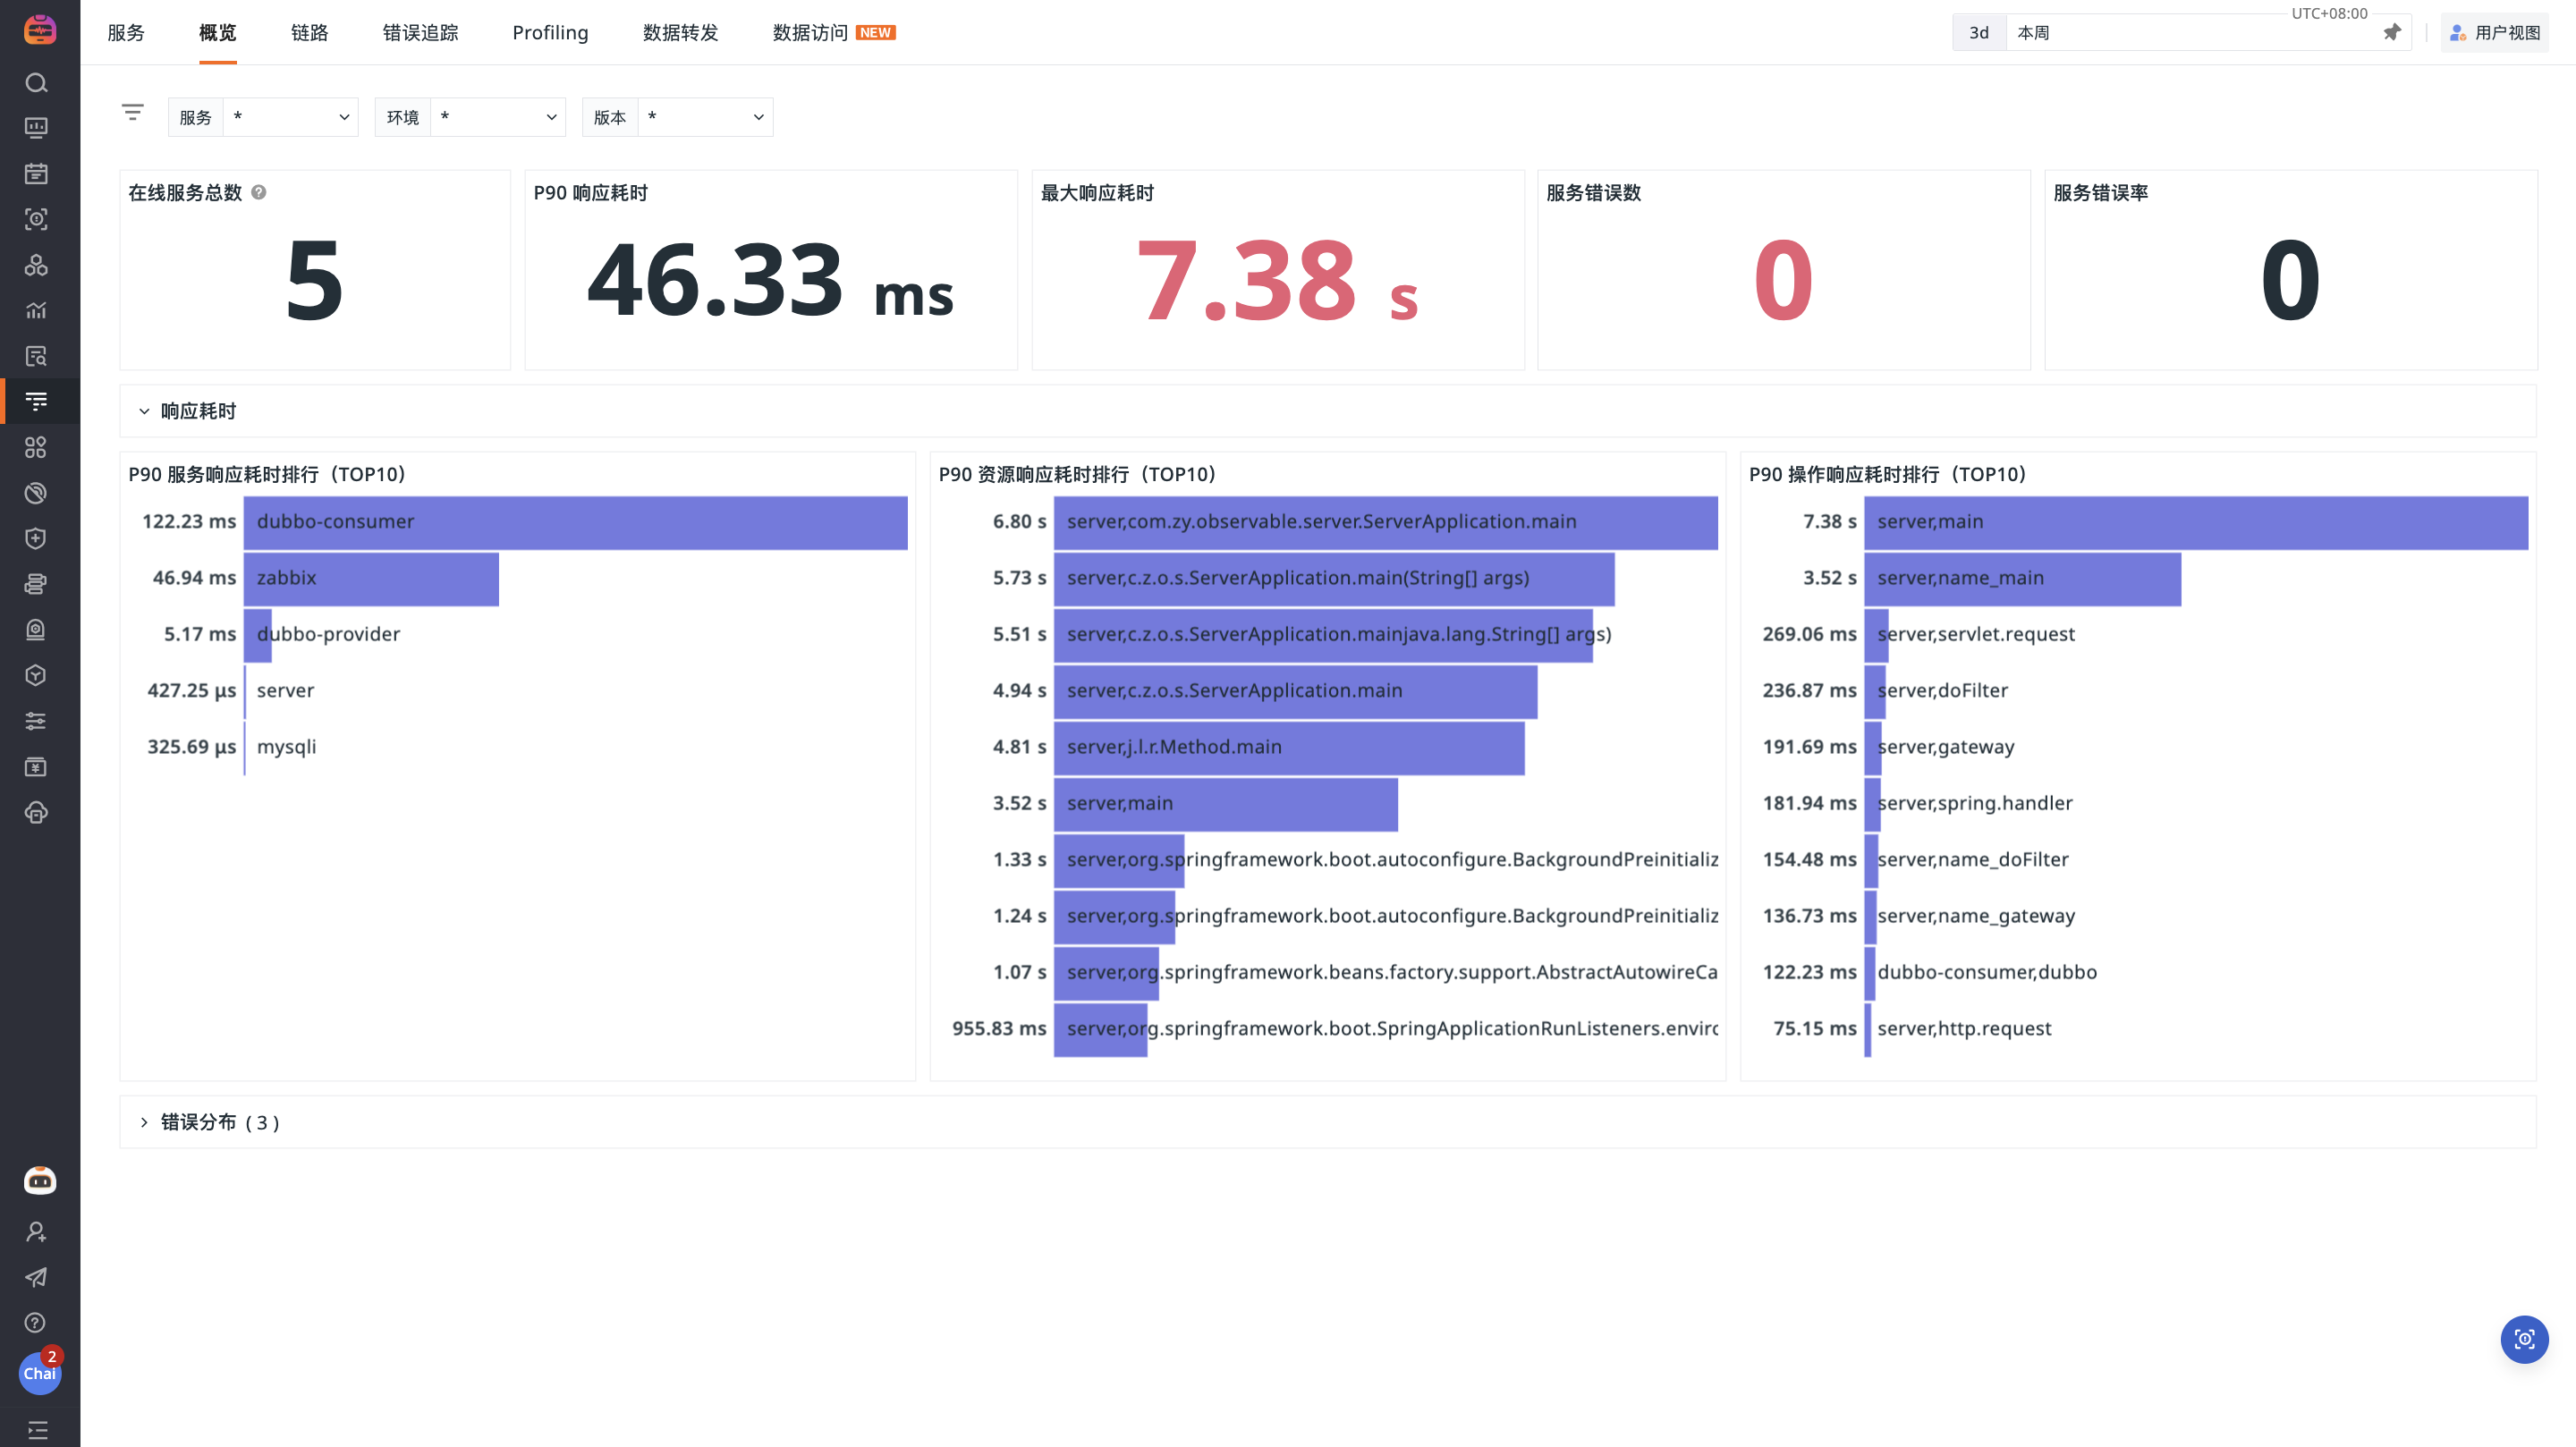
Based on service, environment, and version dimensions, the current Analysis Dashboard centrally displays the following key information:
-
Displays core statistics of traces and requests, along with the number of associated anomalies, which are fundamental for assessing system operation scale and stability. It mainly includes the following Metrics:
-
(Error) Span count
-
(Error) Request count
-
Error log count
-
-
Performance Analysis: Provides multi-dimensional analysis of application performance, mainly including the following Metrics:
-
Average Response Duration: Statistics the average duration of calls starting from the current service
-
Service Request Response Time
-
Slow Call Count: Statistics the number of spans whose duration exceeds 3s
-
Service Request Distribution
-
Error Request Distribution
-
Service Error Count (TOP 10)
-
Service Request Response Time Distribution
-
-
Resource Analysis: Resource call analysis (TOP 50), i.e., the most frequently called or most time-consuming key resources;
-
Anomaly Analysis: Displays anomalies actively discovered by the system and their associated context, mainly including the following Metrics:
-
Incident Associated Monitor Distribution TOP 10
-
Associated Log Status Distribution
-