Dashboards and Data Linking
Real-time visualized data can aggregate and intuitively display core data that enterprises focus on, such as IT and business data, enhancing information sharing and communication efficiency, and quickly identifying abnormal data. This helps teams focus on the right and effective tasks, enabling relevant personnel to make better decisions faster.
Guance dashboard functionality includes a rich set of built-in dashboard templates, providing high customization flexibility, truly connecting the correlation between data, achieving clear presentation of IT systems and business Metrics data that users care about, assisting enterprises in real-time monitoring of IT systems and business operations.
Ready-to-Use Templates
The System View is a standard dashboard template provided by Guance, ready-to-use out-of-the-box. It allows users to quickly observe connected data, helping them visually track, analyze, and display key performance indicators, monitoring the overall operation of systems and businesses.
Click on the Scenarios module on the left side, then click sequentially Dashboard > Create Dashboard, choose or search for the desired view template in System View, click Confirm, and you will successfully add it.
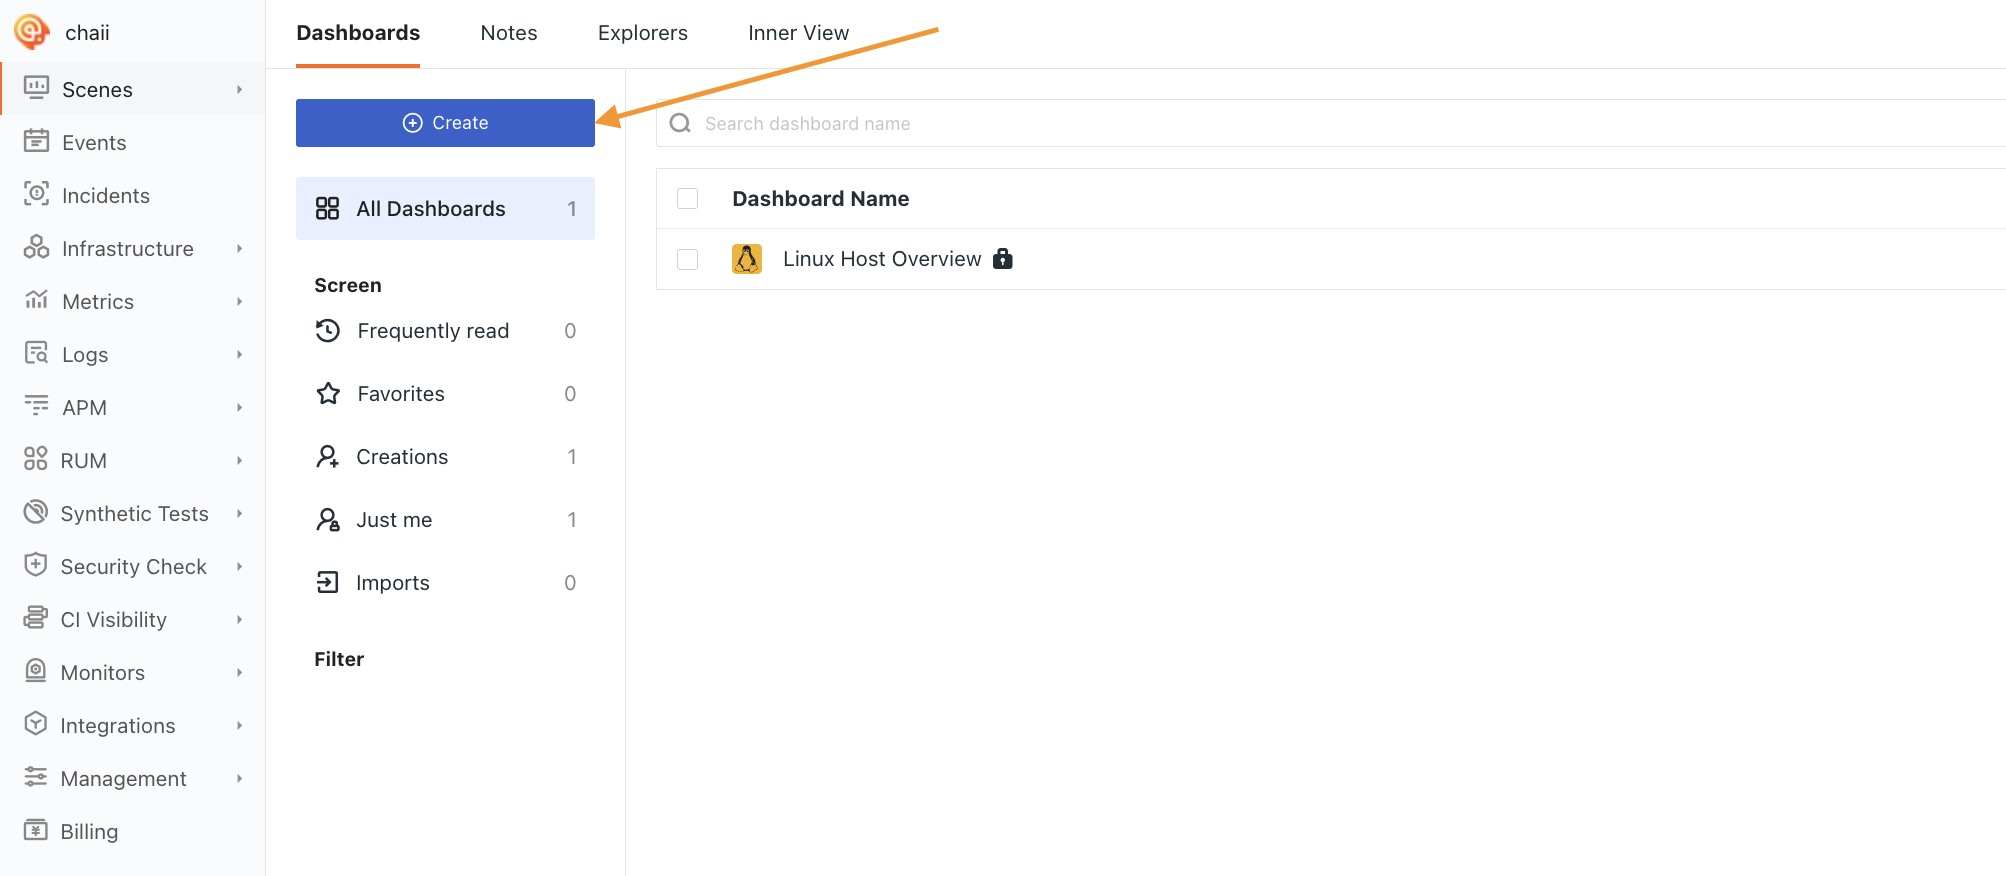
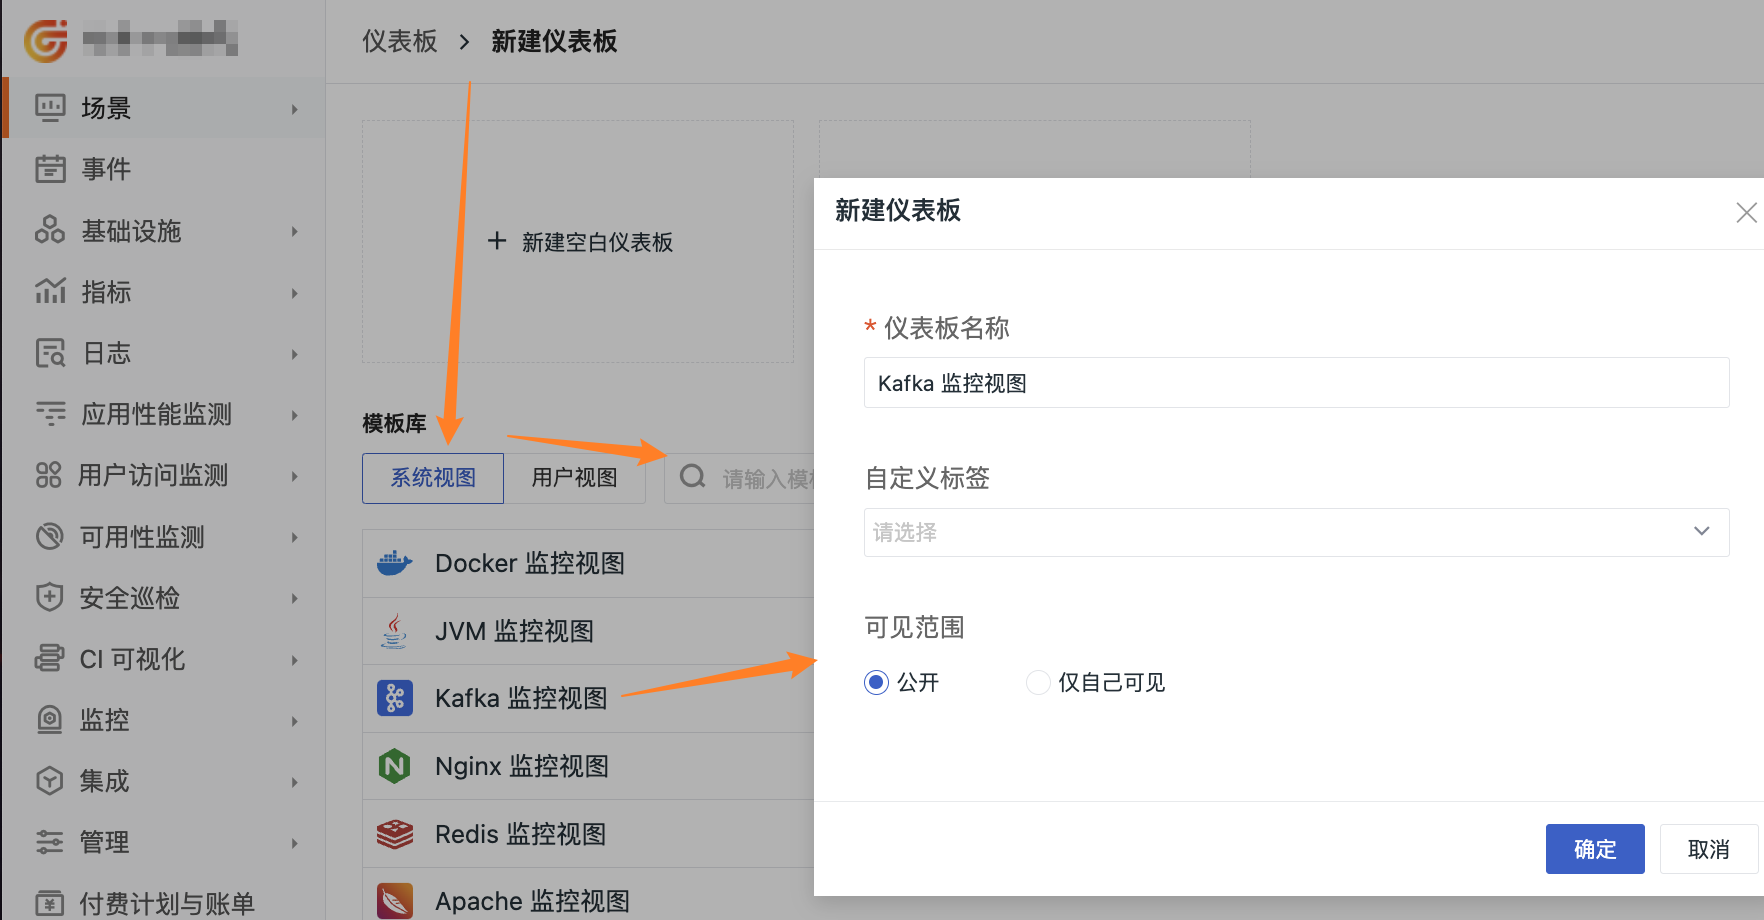
Note: If the current Template Library cannot meet your specific needs, you can click + Create Blank Dashboard to start building your exclusive view from scratch.
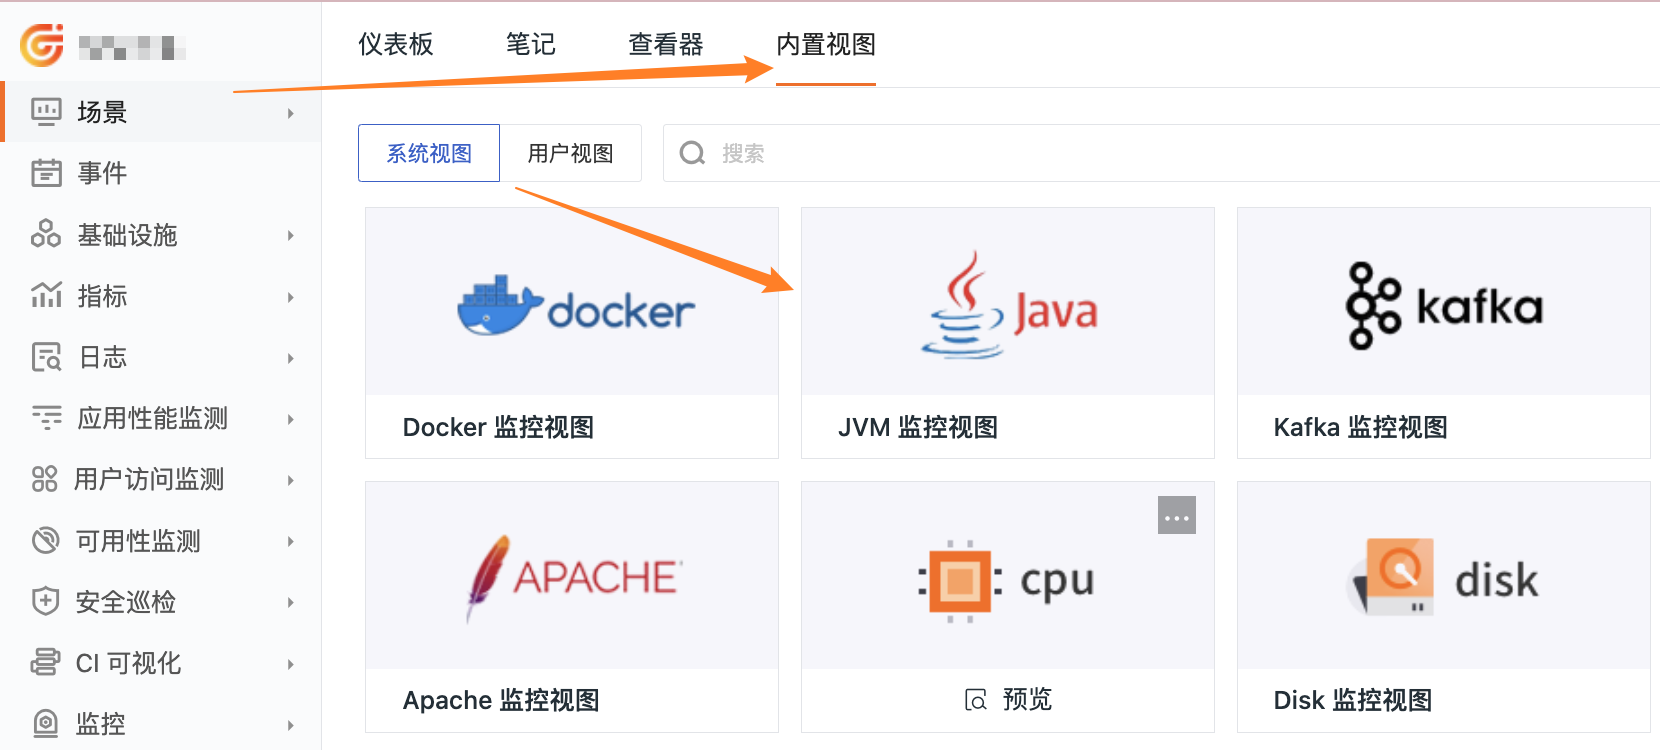
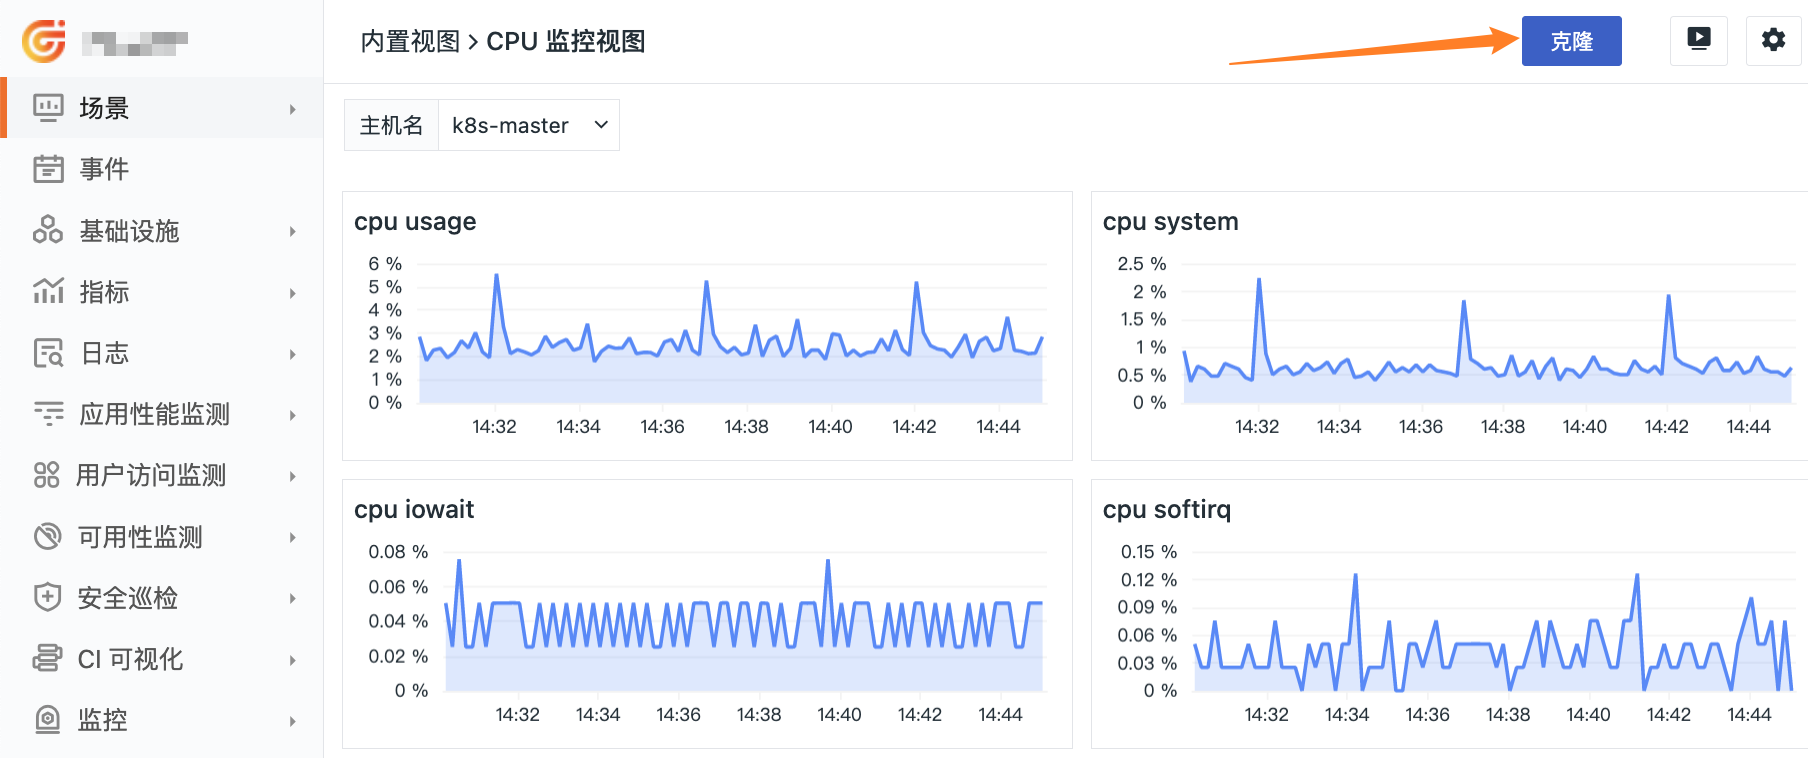
Click on the Scenarios module on the left side, then click Built-in Views, choose or search for the desired view template in System View, preview it, and click Clone to successfully add it.
After successfully adding the dashboard, you can immediately view it on the current page. Click Add Chart to customize and add various visualization charts. Re-enter to view from the Dashboard list.

Customizable Visualization Charts
Guance includes over 20 standard visualization charts, allowing users to quickly create different dashboards based on different business needs, meeting personalized data visualization requirements, ensuring data readability, format consistency, and efficient comprehensive presentation.
Currently supported chart types include: Time Series, Summary, Table, Treemap, Funnel, Pie, Bar, Histogram, SLO, Top List, Gauge, Scatter Plot, Bubble Chart, China Map, World Map, Hexbin, Text, Image, Video, Command Panel, IFrame, Log Flow, Object List, Alert Statistics, etc.
For detailed usage of each chart type, refer to the documentation Visualization Charts


Data Linking in Dashboards
Data connected to Guance has high correlation and interactivity.
- Highly correlated data provides more comprehensive and accurate information, helping users understand the true state of business systems, thus formulating more accurate strategies;
- Interactive data reduces inefficient collaboration across platforms, teams, and members, truly bringing you the experience of "one platform, overseeing all".
Using Labels
Guance dashboards can be linked with modules like Infrastructure, Logs, APM, RUM, Explorer, etc., through custom Label tags. When viewing data in other modules, you can also view the associated dashboard on the same page.
Example Background Description
- Requirement: Hope to view Kafka usage on hosts named
filebeat-logstashwith Labelkafkawithin the Infrastructure module; - Solution: By associating via
Label, you can bind the Kafka monitoring view from the Dashboard module to the Infrastructure module, achieving simultaneous viewing without navigation.

Taking the addition of kafka as an example:

- In Scenarios > Dashboards, enter an existing dashboard that needs binding; if none exists, create one
- Click Settings > Save as Built-in View, and bind the corresponding
Label. For example, “Kafka Monitoring View”


- Before Binding:

- After Binding:

Using Chart Links
Visualization charts in Guance dashboards can link to modules like Explorer, other dashboards, infrastructure, external links, etc., through chart links. You can jump directly to the target page from the current chart, enabling a quick overview of important metrics followed by targeted deep analysis.
Currently, chart links support built-in and custom association links, and can pass data information through template variables, completing data linking.
For more details, refer to the documentation Chart Links.

Using Monitoring Alerts
Guance has powerful anomaly detection capabilities, not only providing a series of monitoring templates but also supporting custom monitors. Combined with alert notification functions, it helps you quickly identify, locate, and resolve issues.
For more details, refer to the documentation Monitoring.
Guance dashboards can be linked with monitoring alerts, synchronizing monitoring information to comprehensively assist in monitoring and alerting, preventing important alerts from being missed and making it convenient for team members to observe.
Open an already created monitor, select the dashboard to associate under Associated Dashboard, and Save.
(Example shown: “Host Memory Less Than 100M Monitor”)

In the Monitor List, click View Related View to navigate to the associated dashboard.
