Mutation Detection
By comparing the absolute change or relative percentage change of the same metric across two different time periods, it determines whether an anomaly has occurred. This method is often used to track peaks or fluctuations in metrics. When an anomaly is detected, it can more accurately generate event records for subsequent analysis and handling.
Use Cases
Mutation detection is suitable for monitoring short-term versus long-term data relative changes or rates of change. For example, setting the percentage difference between the average number of MySQL connections over the last 15 minutes and the past day's average to be greater than 500% means that if the average number of connections over the last 15 minutes exceeds five times the daily average, the system will trigger a warning.
It is recommended to use statistical functions such as averages (AVG), maximums (MAX), minimums (MIN) rather than the last value (LAST) function to calculate these metrics, reducing the impact of anomalous data and enhancing the accuracy of monitoring.
Detection Configuration
Metrics to Detect
This refers to the monitored metric data. It can compare the difference or percentage difference of this metric across two time periods.
| Field | Description |
|---|---|
| Data Type | The data type of the current detection rule. |
| Measurement | The measurement set where the current detection metric resides. |
| Metrics | The specific metric targeted by the current detection. |
| Aggregation Algorithm | Includes Avg by (average), Min by (minimum), Max by (maximum), Sum by (sum), Last (last value), First by (first value), Count by (number of data points), Count_distinct by (number of distinct data points), p50 (median value), p75 (value at the 75th percentile), p90 (value at the 90th percentile), p99 (value at the 99th percentile). |
| Detection Dimensions | Any string-type (keyword) fields in the configuration data can be selected as detection dimensions. Currently, up to three fields can be chosen. By combining multiple detection dimension fields, a specific detection object can be determined. Guance will judge whether the statistical metric corresponding to a certain detection object meets the threshold condition for triggering an event, generating one if the condition is met.* (For example, selecting detection dimensions host and host_ip would result in a detection object like {host: host1, host_ip: 127.0.0.1}.) |
| Filtering Conditions | Filters the data of the detection metric based on the tags of the metric, limiting the scope of the detection data; supports adding one or more tag filters; supports fuzzy matching and non-matching filtering conditions. |
| Alias | Custom name for the detection metric. |
| Query Method | Supports simple queries and expression-based queries. |
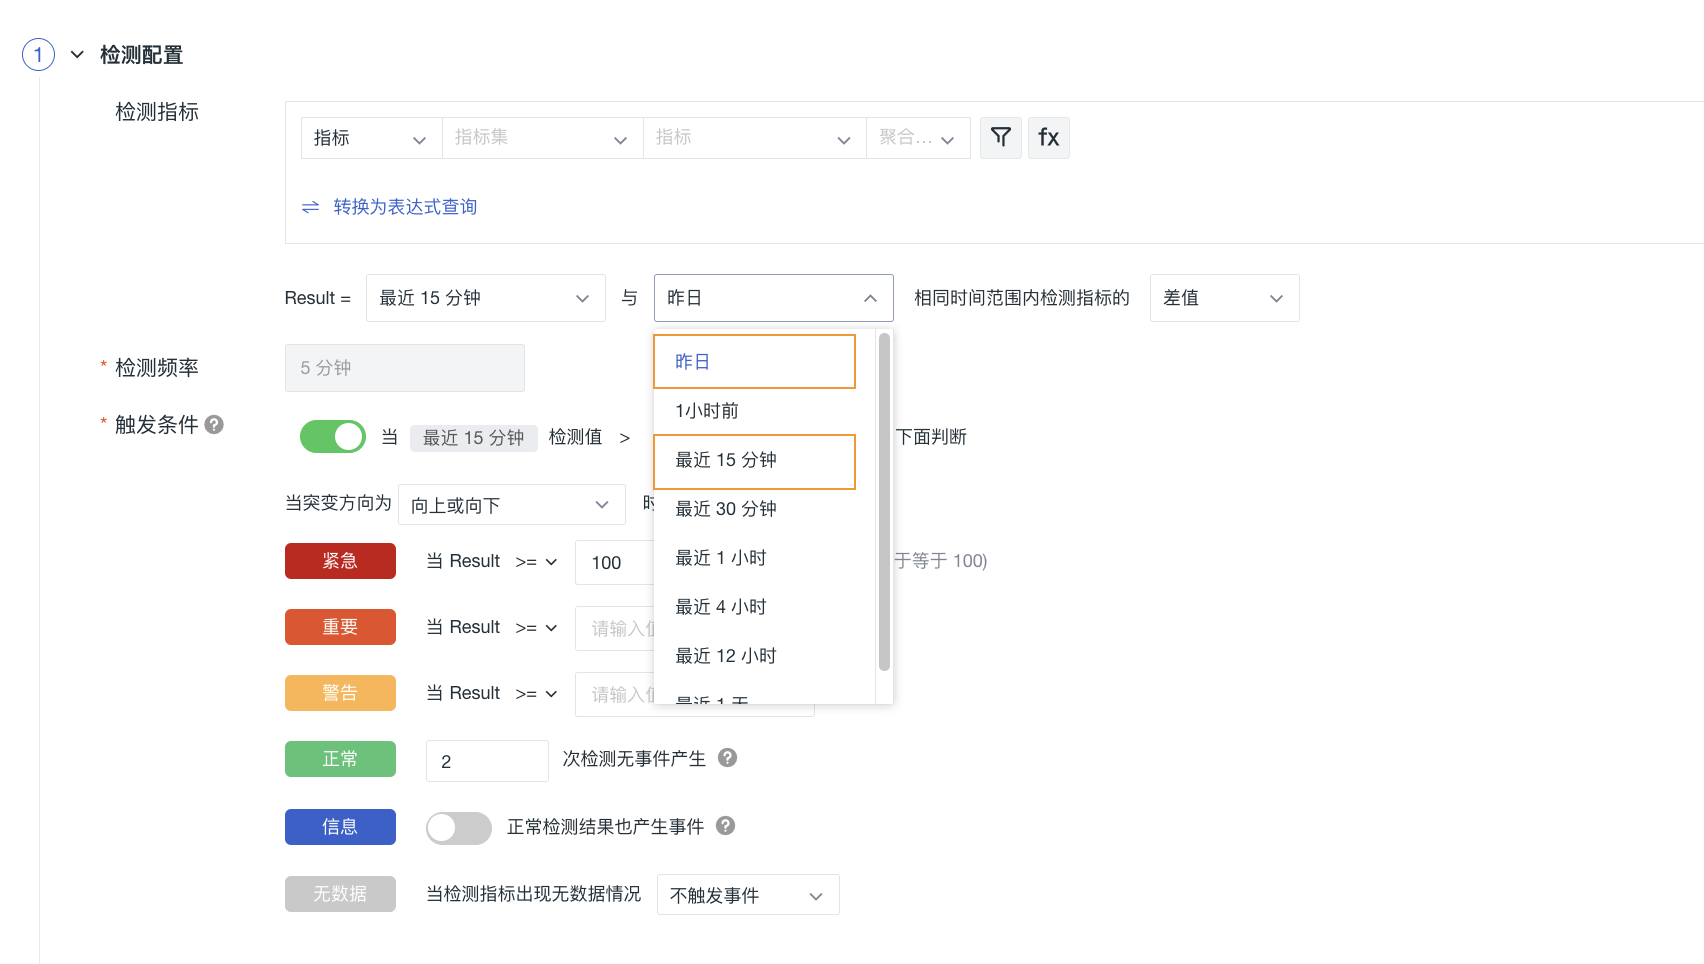
The time intervals available for selection include last month, last week, yesterday, one hour ago, compared with the previous period, last 15 minutes, last 30 minutes, last hour, last 4 hours, last 12 hours, and last day.
Note
The detection intervals "yesterday" and "one hour ago" compare the difference or percentage difference of the detection metric within the same time range, while other detection intervals compare the difference or percentage difference of the detection metric across two time periods.
Detection Frequency
The execution frequency of the detection rule automatically matches the larger time range among the two detection intervals selected by the user. Default is 5 minutes.
Trigger Conditions
Set the trigger conditions for alert levels: You can configure any one of emergency, important, warning, data gap, or informational trigger conditions:
-
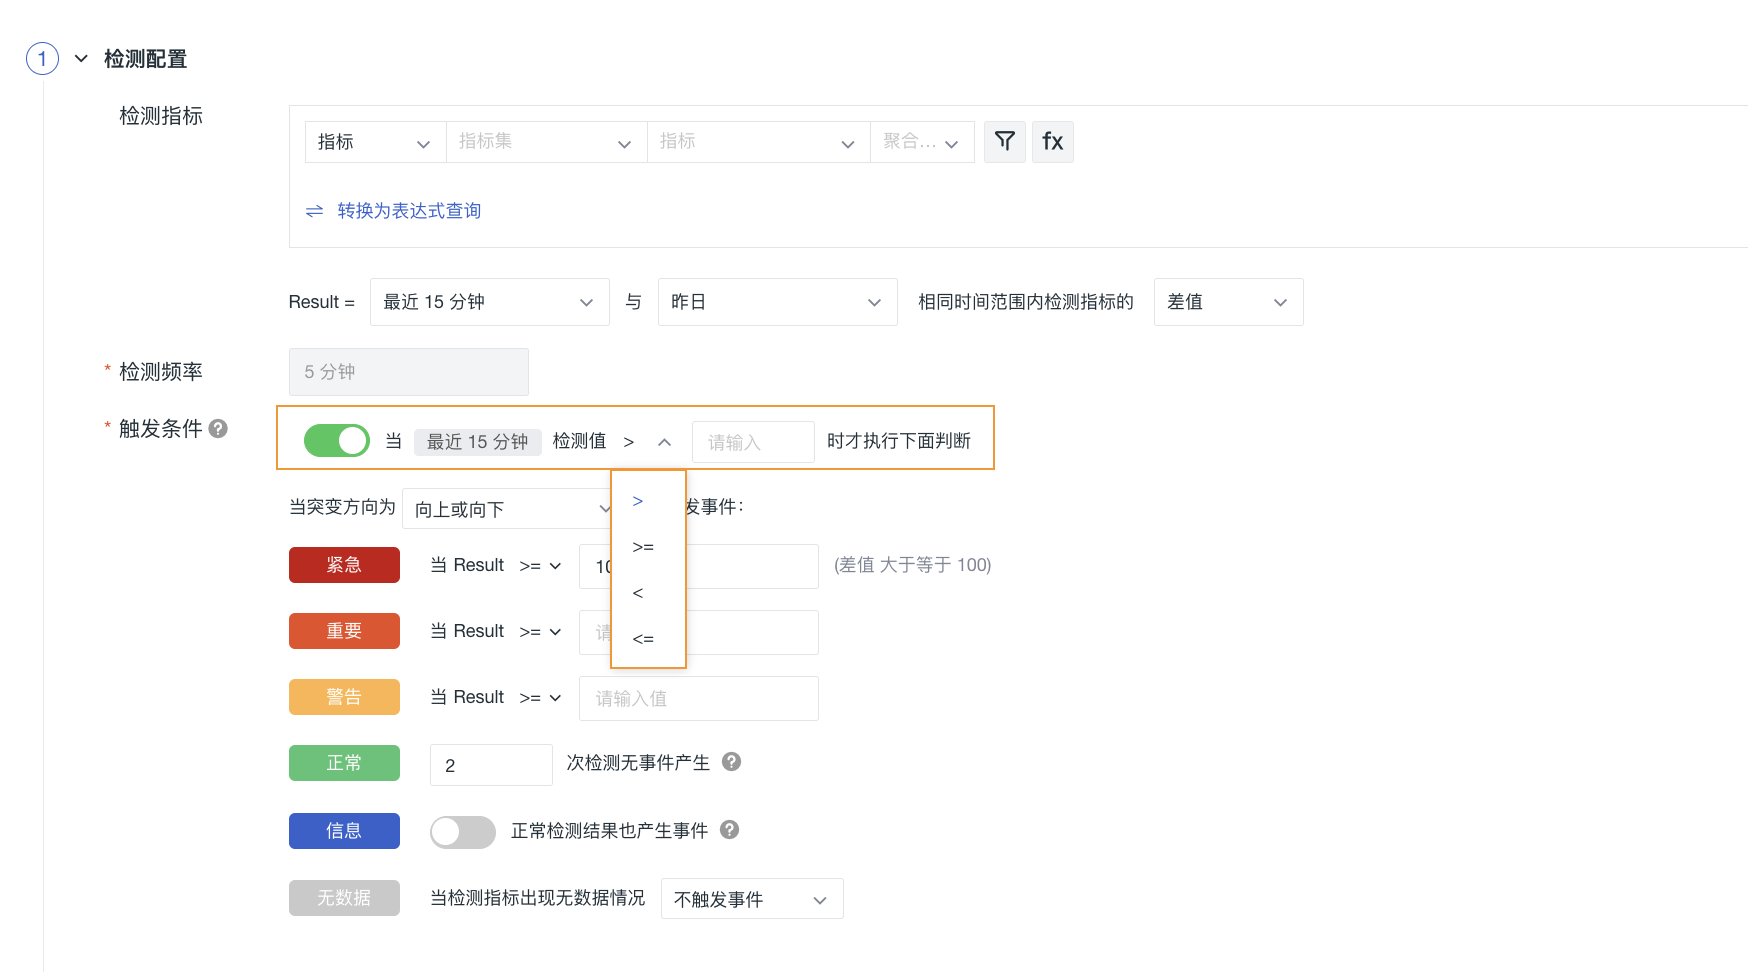
Pre-trigger condition configuration: Enabled by default; when the detection value meets the threshold set in the pre-trigger condition (supported operators are >, >=, <, <=, default is >), continue to evaluate the mutation detection rules; disabling this configuration skips directly to evaluating the mutation detection rules;
-
Mutation rule configuration: Comparing data in three forms — increasing (data rise), decreasing (data fall), or both increasing and decreasing — for mutation detection rule evaluation.
Configure trigger conditions and severity levels. If the query results contain multiple values, any value meeting the trigger condition will generate an event.
For more details, refer to Event Level Description.
Alert Levels
-
Alert Levels Emergency (Red), Important (Orange), Warning (Yellow): Based on configured condition judgment operators.
-
Alert Level Normal (Green): Based on configured detection count, explained as follows:
- Each execution of a detection task counts as one detection, e.g.,
detection frequency = 5 minutes, so 1 detection = 5 minutes; - You can customize the detection count, e.g.,
detection frequency = 5 minutes, then 3 detections = 15 minutes.
Level Description Normal After the detection rule takes effect, if critical, important, or warning abnormal events occur, and the data detection results return to normal within the configured custom detection count, a recovery alert event will be generated.
Recovery alert events are not subject to alert muting. If no recovery alert event detection count is set, the alert event will not recover and will always appear in the Events > Unrecovered Events List.
- Each execution of a detection task counts as one detection, e.g.,
Data Gaps
Seven strategies can be configured for data gaps.
-
Link the detection interval time range to judge the query results of the most recent minutes for the detection metric, no event triggered;
-
Link the detection interval time range to judge the query results of the most recent minutes for the detection metric, query results considered as 0; in this case, the query results will be re-compared with the thresholds configured in the trigger conditions, determining whether to trigger an anomaly event.
-
Customize fill-in for the detection interval value, trigger data gap events, trigger emergency events, trigger important events, trigger warning events, and trigger recovery events; if this type of configuration strategy is selected, it is recommended that the custom data gap time configuration be >= detection interval time span. If the configured time <= the detection interval time span, there may be simultaneous satisfaction of data gaps and anomalies, in which case only the data gap processing result will be applied.
Information Generation
When this option is enabled, detection results that do not match the above trigger conditions will generate "informational" events and write them into the log.
Note
If trigger conditions, data gaps, and information generation are configured simultaneously, the following priority applies for triggering: data gaps > trigger conditions > information event generation.
Other Configurations
For more details, refer to Rule Configuration.

