Threshold Detection
Current Document Location
This document is the second step in the detection rule configuration process. After completing the configuration, please return to the main document to continue with the third step: Event Notification.
Data Scope: Supports all data types, such as Metrics M, Logs L, Traces T, RUM data R, Objects O, etc.).
Detection Configuration
Detection Frequency
Set the time period for executing detection.
-
Preset Options: 1 minute, 5 minutes, 10 minutes, 15 minutes, 30 minutes, 1 hour
-
Crontab Mode: Click "Switch to Crontab Mode" to configure a custom schedule. Supports configuring scheduled task execution based on seconds, minutes, hours, days, months, weeks, etc.

Detection Interval
Set the data time range queried for each detection (❗️The detection interval should be greater than or equal to the detection frequency, and should match the actual data reporting cycle to avoid missed detections or false alarms).
- Preset Options:
| Detection Frequency | Detection Interval (Dropdown Options) |
|---|---|
| 30s | 1m/5m/15m/30m/1h/3h |
| 1m | 1m/5m/15m/30m/1h/3h |
| 5m | 5m/15m/30m/1h/3h |
| 15m | 15m/30m/1h/3h/6h |
| 30m | 30m/1h/3h/6h |
| 1h | 1h/3h/6h/12h/24h |
| 6h | 6h/12h/24h |
| 12h | 12h/24h |
| 24h | 24h |
- Custom Format: Custom input for detection interval, e.g., 20m (last 20 minutes), 2h (last 2 hours), 1d (last 1 day).
Detection Metric
Define the detection data source and aggregation method based on DQL.
Please avoid selecting high-cardinality fields as detection dimensions. Improper configuration with overly lenient trigger conditions may lead to frequent alerts. The current query returns a maximum of 100,000 records.
Configuration Example: When configuring the detection metric for a monitor, by trace_id was selected as the grouping field.
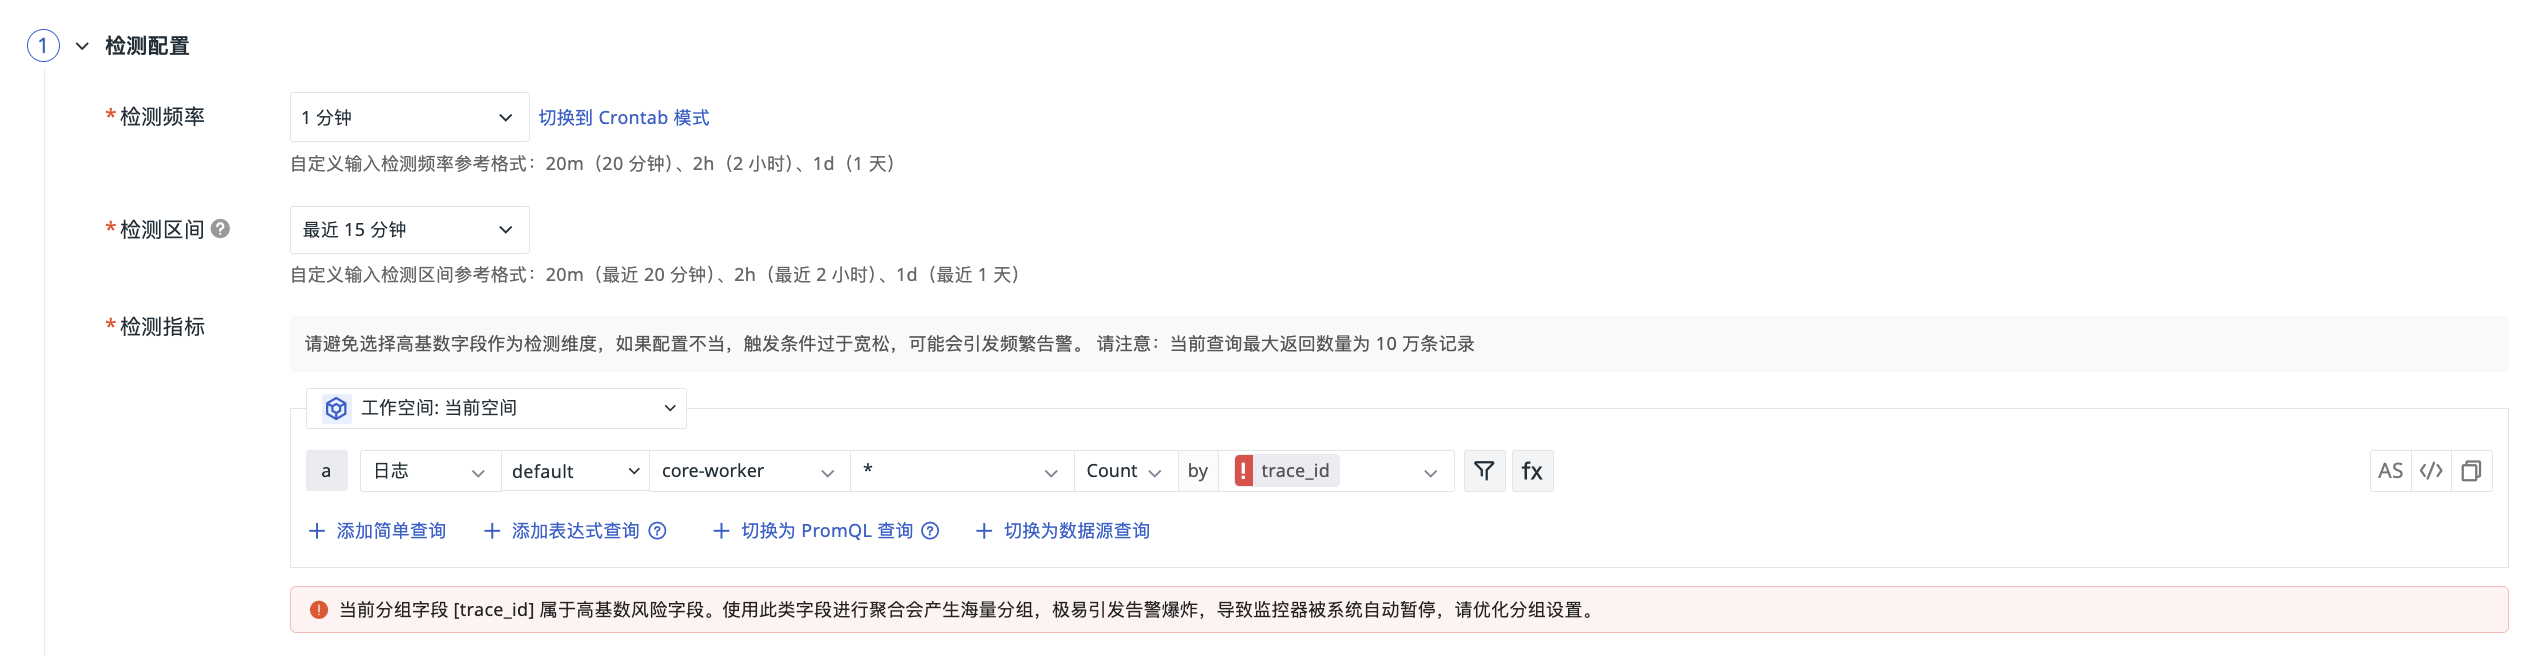
The system will then prompt you:
The current grouping field trace_id is a high-cardinality risk field. Using such fields for aggregation will generate a massive number of groups, which can easily trigger alert explosions, leading to the monitor being automatically paused by the system. Please optimize the grouping settings.
Configuration Elements
| Configuration Item | Description |
|---|---|
| Workspace | Defaults to the current workspace, can be switched to other authorized workspaces After authorization, you can use detection metrics from other workspaces under the current account to create monitors. Once the rule is created successfully, cross-workspace alert configuration is achieved. Note that when you select another workspace, the data type dropdown list for detection metrics will only display data types that the current workspace is authorized to use. |
| Data Source Type | Metrics, Logs, Traces, RUM data, etc. |
| Query Method | Simple Query, Expression Query, PromQL Query, Data Source Query |
| Filter Conditions | Filter detection objects via tags |
| Aggregation Method | avg, sum, max, min, count, etc. |
| Function Support | Click the fx button to support selecting the following functions:❗️When selecting conversion functions derivative, difference, non_negative_derivative, non_negative_difference, an interval needs to be added. For example: [::5m] |
Click to view Detailed Explanation of Query Methods, More Instructions on Function Usage.
Trigger Conditions
Configure trigger conditions and severity levels. When the query result contains multiple values, an event is generated if any value meets the trigger condition.
Supports configuring four-level thresholds: Critical, Error, Warning, Info, and OK recovery conditions.
| Level | Configuration | Description |
|---|---|---|
| Critical | When Result >= [value] |
Highest level alert, requires immediate action |
| Error | When Result >= [value] |
High-level alert, requires priority handling |
| Warning | When Result >= [value] |
Medium-level alert, requires attention |
| Info | When Result >= [value] |
Low-level alert, needs to be noted |
| OK | No events generated for [N] consecutive detections |
If the detection metric triggers "Critical", "Error", "Warning", "Info" abnormal events, and then N consecutive detections are normal, an "OK" event is generated. Used to determine if an abnormal event has returned to normal, recommended for configuration |
For more details, refer to Event Level Description.
Advanced Options
Consecutive Trigger Judgment
When enabled, events are generated only when trigger conditions are continuously met, avoiding false alarms from transient fluctuations (❗️Maximum configuration limit is 10 times).
Bulk Alert Protection
Enabled by default in the system.
When the number of alerts generated by a single detection exceeds a preset threshold, the system automatically switches to a status summary strategy: instead of processing each alert object individually, it generates a small number of summary alerts based on event status and pushes them.
This ensures timely notification while significantly reducing alert noise and avoiding timeout risks caused by processing too many alerts.
When this switch is enabled, subsequent event details generated by this monitor after detecting anomalies will not display historical records and associated events.
Recovery Conditions
Configure recovery conditions and severity levels. When the query result contains multiple values, a recovery event is generated if any value meets the trigger condition.
Set independent recovery thresholds for different levels to achieve downgraded recovery. For example: a Critical alert recovers when the value drops below 70, while a Warning alert recovers below 80.
Recovery Alert Logic
After enabling "Recovery Conditions", the system uses the Fault ID as a unique identifier to manage the entire lifecycle of an alert (including operations like creating Issues).
When hierarchical recovery is also enabled:
-
The platform configures a separate set of recovery rules (i.e., recovery thresholds) for each alert level (e.g.,
critical,warning) -
The alert status and recovery status for each level are calculated independently
-
This does not affect the alert lifecycle identified by the original Fault ID
Therefore, when a monitor triggers an alert for the first time (i.e., starting a new alert lifecycle), the system simultaneously generates two alert messages. They appear similar because:
-
Source of the first alert: Overall detection (
check), representing the start of the entire fault lifecycle (based on the original rule); -
Source of the second alert: Hierarchical detection (
critical/error/warning/…), indicating that the enabled hierarchical recovery function has started, used to present the specific alert level and its subsequent recovery status (e.g.,critical_ok).
In the above, the df_monitor_checker_sub field is the core basis for distinguishing the two types of alerts:
-
check: Represents the result of the overall detection; -
Other values (e.g.,
critical,error,warning, etc.): Correspond to the results of hierarchical detection rules.
Thus, when an alert is first triggered, two records appear with similar content but different sources and purposes.
df_monitor_checker_sub |
T+0 | T+1 | T+2 | T+3 |
|---|---|---|---|---|
check |
check |
error |
warning |
ok |
critical |
critical |
critical_ok |
||
error |
error |
error_ok |
||
warning |
warning |
warning_ok |
Data Gap
The handling strategy when the detection metric query result is empty within the detection interval:
| Option | Description |
|---|---|
| Do Not Trigger Event (Default) | No alert is generated when data is missing, suitable for scenarios where data gaps are allowed |
| Treat Query Result as 0 | Treats empty data as a value of 0 for threshold judgment |
| Trigger Data Gap Event | Treats no data as an anomaly, triggering a data gap event |
| Trigger Critical Event | Triggers a Critical level event when data is missing |
| Trigger Error Event | Triggers an Error level event when data is missing |
| Trigger Warning Event | Triggers a Warning level event when data is missing |
| Trigger Info Event | Triggers an Info level event when data is missing |
| Trigger Recovery Event | Triggers a recovery event when data is missing |
When trigger conditions, data gap handling, and info generation are configured simultaneously, the triggering priority is judged as follows: Data Gap > Trigger Conditions > Info Event Generation.
That is: first judge if there is a data gap, then judge if thresholds are triggered, and finally judge if info events should be generated.
Info Generation
When this option is enabled, the system writes all detection results that do not match the above trigger conditions as "Info" events.
Suitable for scenarios where recording normal status changes or low-priority information is needed.
Subsequent Configuration
After completing the above detection configuration, please continue to configure:
-
Event Notification: Define event title, content, notification members, data gap handling, and associated faults;
-
Alert Configuration: Select alert strategies, set notification targets, and mute periods;
-
Association: Associate dashboards for quick jump to view data;
-
Permissions: Set operation permissions to control who can edit/delete this monitor.