Status Page
Guance provides Status Page, where you can view the operational status of various sites in real-time, as well as historical issues and their resolution records.
We continuously monitor the service status of all sites. Once a service issue occurs, the team will respond and handle it promptly. If you encounter any abnormalities during usage, it is recommended to first check the service status of Guance to determine if it is due to temporary platform service fluctuations. For example, if log uploads fail, you can first check whether the log service of Guance is functioning normally.
Service Sites
Navigate to Help > Status Page:
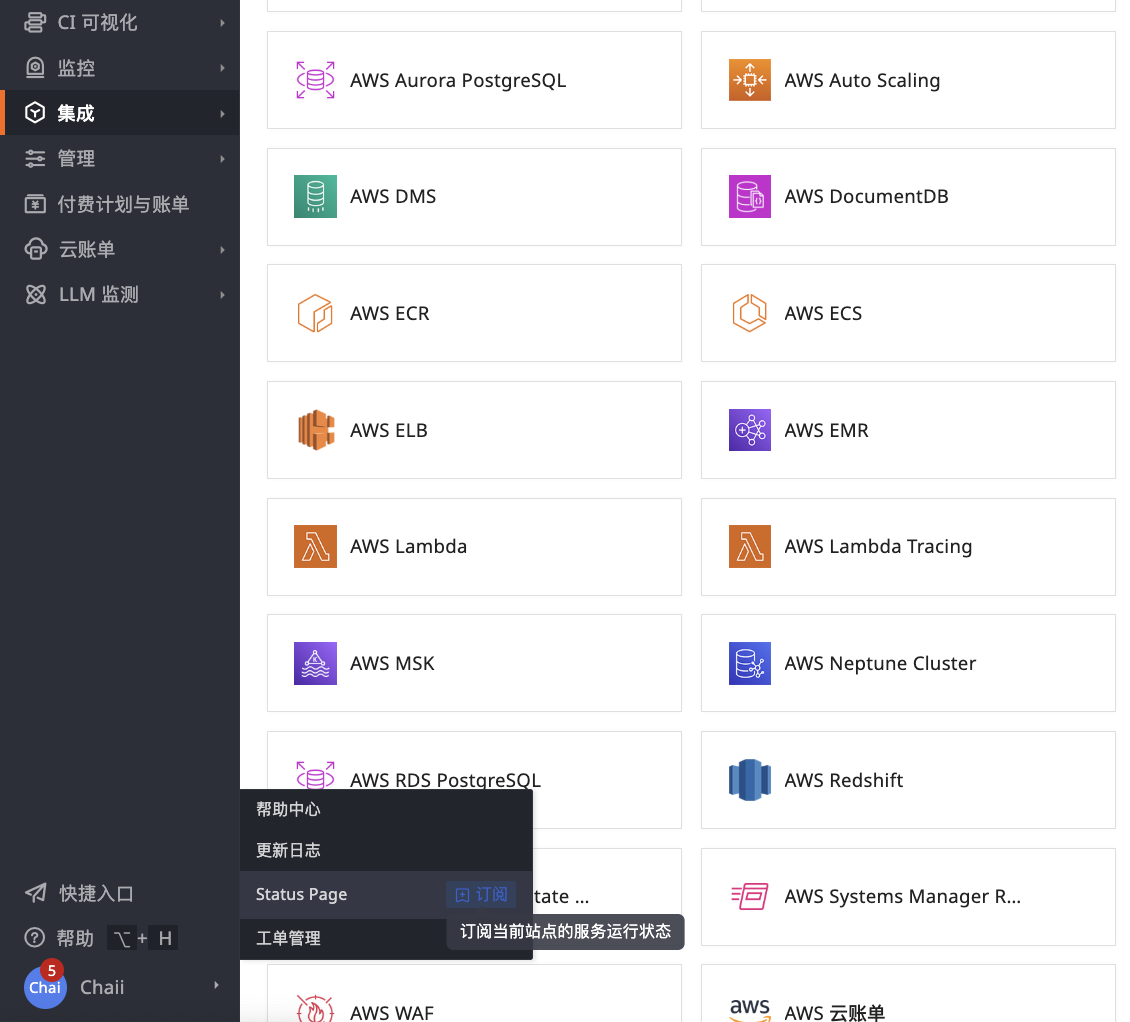
Click the subscribe button to start monitoring the operational status of this site. After subscribing, you will receive email notifications when service abnormalities occur.
Note
Guance continuously monitors each functional module of the workspace under the site: it performs checks at a frequency of once per minute and aggregates results every 5 minutes. If any single abnormality occurs within any 5-minute period, that cycle is deemed abnormal. If a module remains abnormal for 30 consecutive minutes (i.e., 6 consecutive aggregated results), an alert email will be triggered. After the first alert, if the next 5-minute aggregated result for that module returns to normal, the abnormal event is considered resolved.
You can directly click the links below to view the service status of each site of Guance:
| Site | Login URL | Operator |
|---|---|---|
| China 1 (Hangzhou) | https://auth.guance.com/ | Alibaba Cloud (Hangzhou, China) |
| China 2 (Ningxia) | https://aws-auth.guance.com/ | AWS (Ningxia, China) |
| China 4 (Guangzhou) | https://cn4-auth.guance.com/ | Huawei Cloud (Guangzhou, China) |
| China 6 (Hong Kong) | https://cn6-auth.guance.com/ | Alibaba Cloud (International) |
| Americas 1 (Oregon) | https://us1-auth.guance.com/ | AWS (Oregon, US) |
| Asia Pacific 1 (Singapore) | https://ap1-auth.guance.com/ | AWS (Singapore) |
| Europe 1 (Frankfurt) | https://eu1-auth.guance.com/ | AWS (Frankfurt) |
| Indonesia 1 (Jakarta) | https://id1-auth.guance.com/ | Tencent Cloud (Jakarta) |
| Africa 1 (South Africa) | https://za1-auth.guance.com/ | Huawei Cloud (South Africa) |
| Middle East 1 (UAE) | https://me1-auth.guance.com/ | AWS (UAE) |
Service Status
Each site service may have the following statuses:
| Service Status | Description |
|---|---|
| Normal | Indicates that the current site's service is operating normally, with no data loss. |
| Abnormal | Indicates that the current site's service is experiencing abnormalities, with potential data loss. |
| Delayed | Indicates that the current site's service is experiencing delays, with data gaps, loss, and delayed data queries. |
| Under Maintenance | Indicates that Guance technicians are performing maintenance on the current site. |
Abnormal/Delayed Judgment Logic
On the Status Page, you can view the status of key functional modules including Events, Infrastructure, RUM, APM, Metrics, Logs, Synthetic Tests, and CI Visualization.
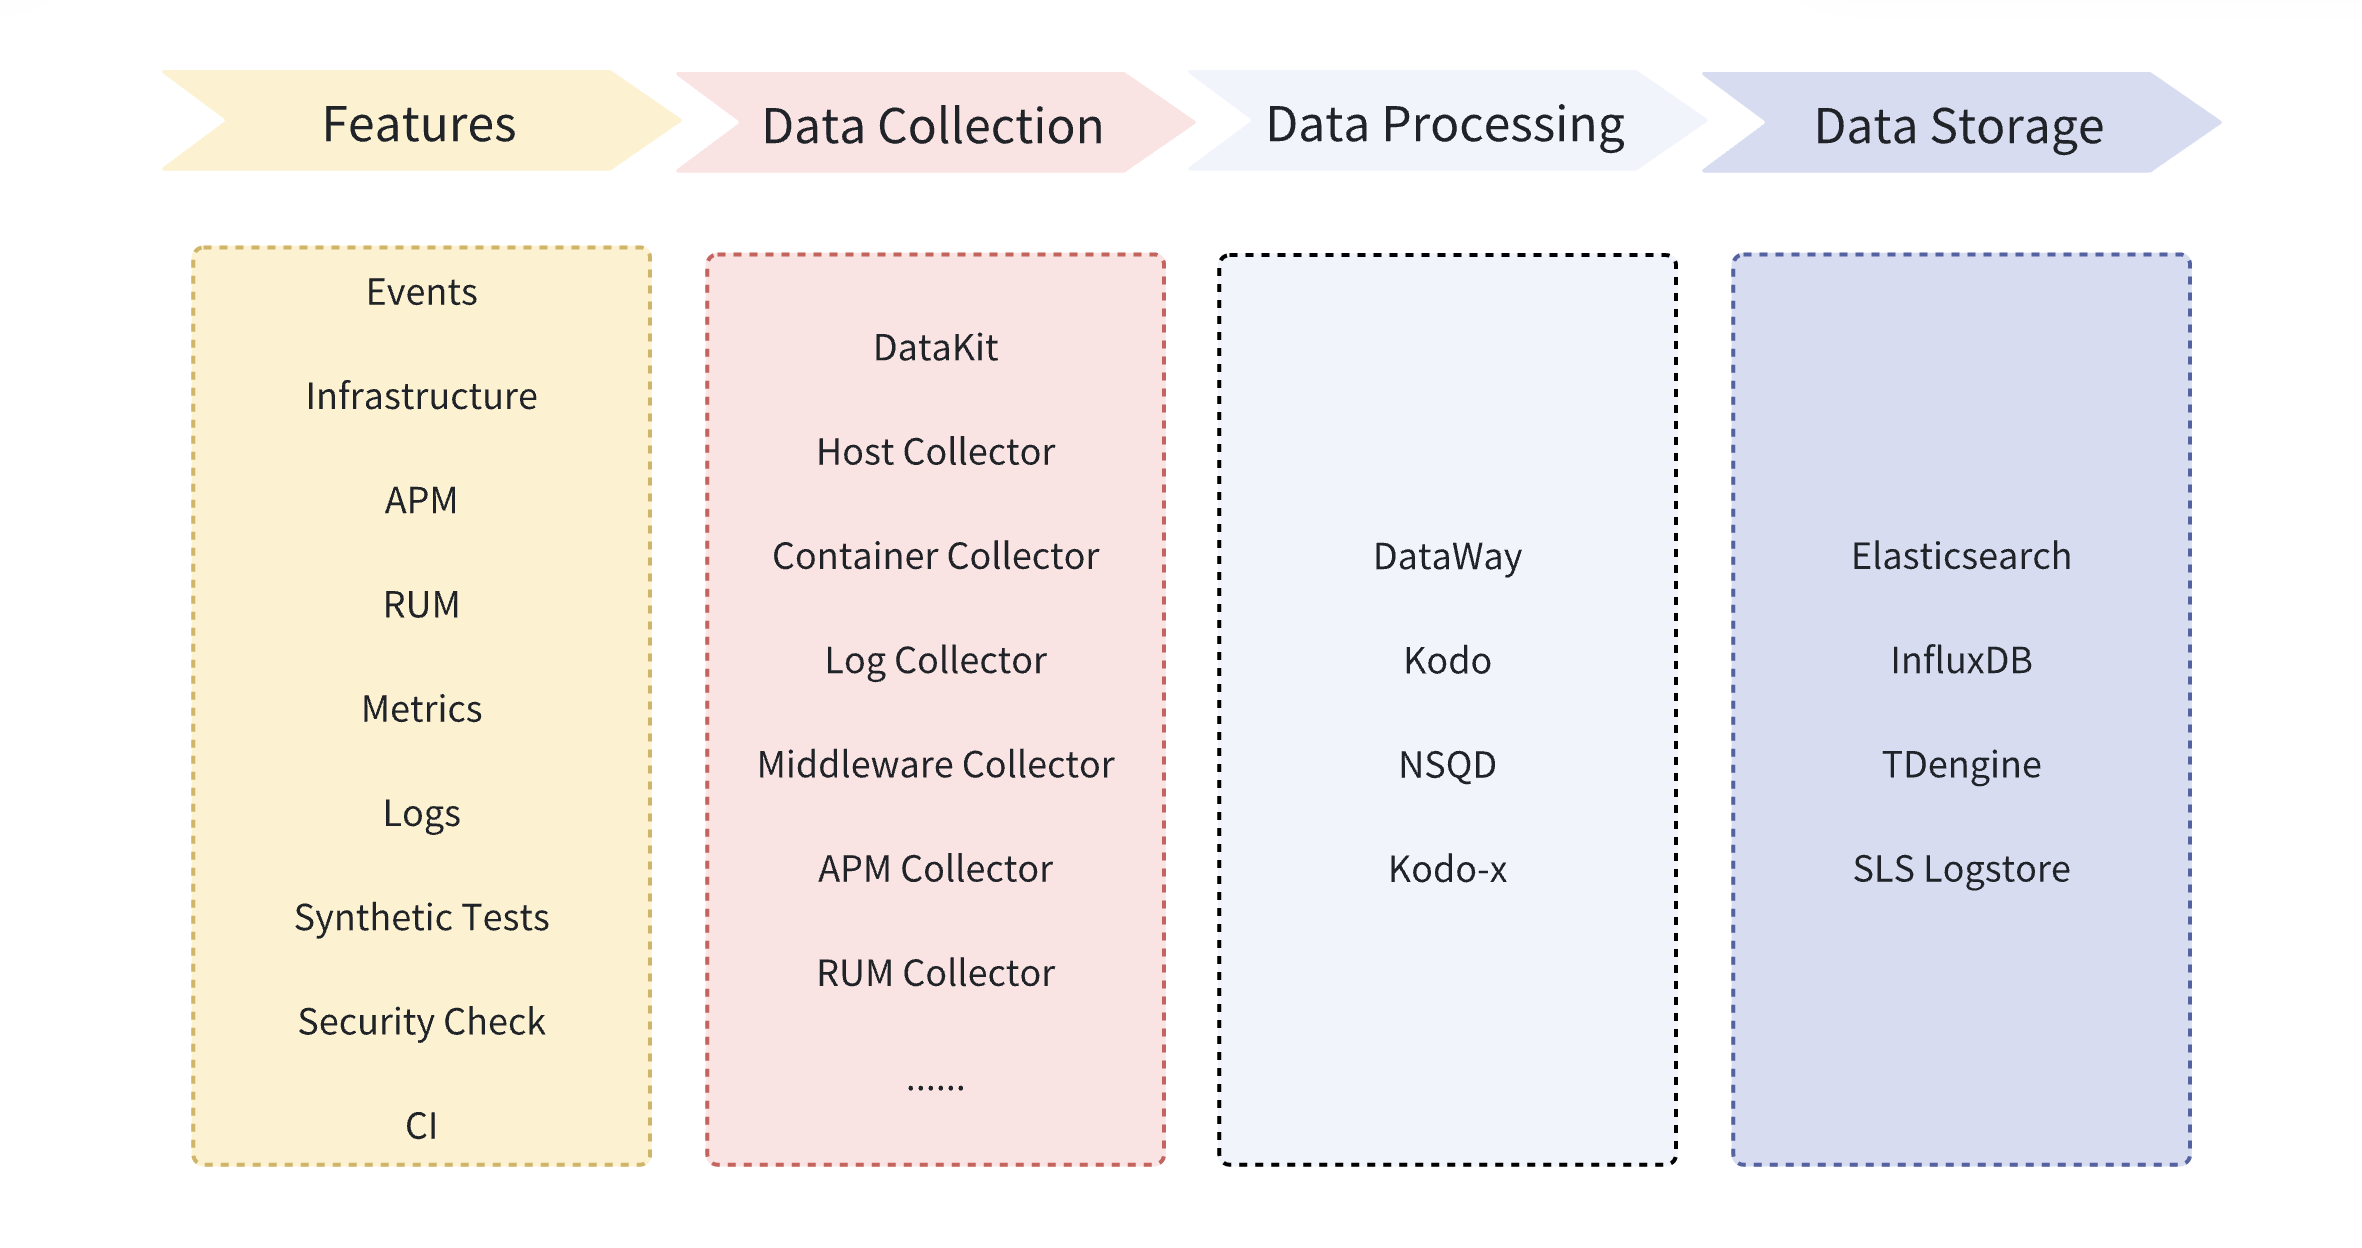
Based on the data processing flow above, the Status Page determines the service status during the data processing and data storage phases, as shown in the table below:
Judgment Item |
Judgment Condition | Service Status | Example |
|---|---|---|---|
| Data Push Failure Rate | Greater than 90% | Abnormal | When collecting log data, the failure rate of pushing data from Kodo to the message queue exceeds 90%, the Logs service status is Abnormal. |
| Data Write Failure Rate | Greater than 90% | Abnormal | When collecting log data, the failure rate of writing data from Kodo-x to the database exceeds 90%, the Logs service status is Abnormal. |
| Message Subscription Delay P99 | Greater than 5 minutes | Delayed | When collecting APM data, the P99 delay of data sent from the message queue to Kodo-x exceeds 5 minutes, the APM service status is Delayed. |
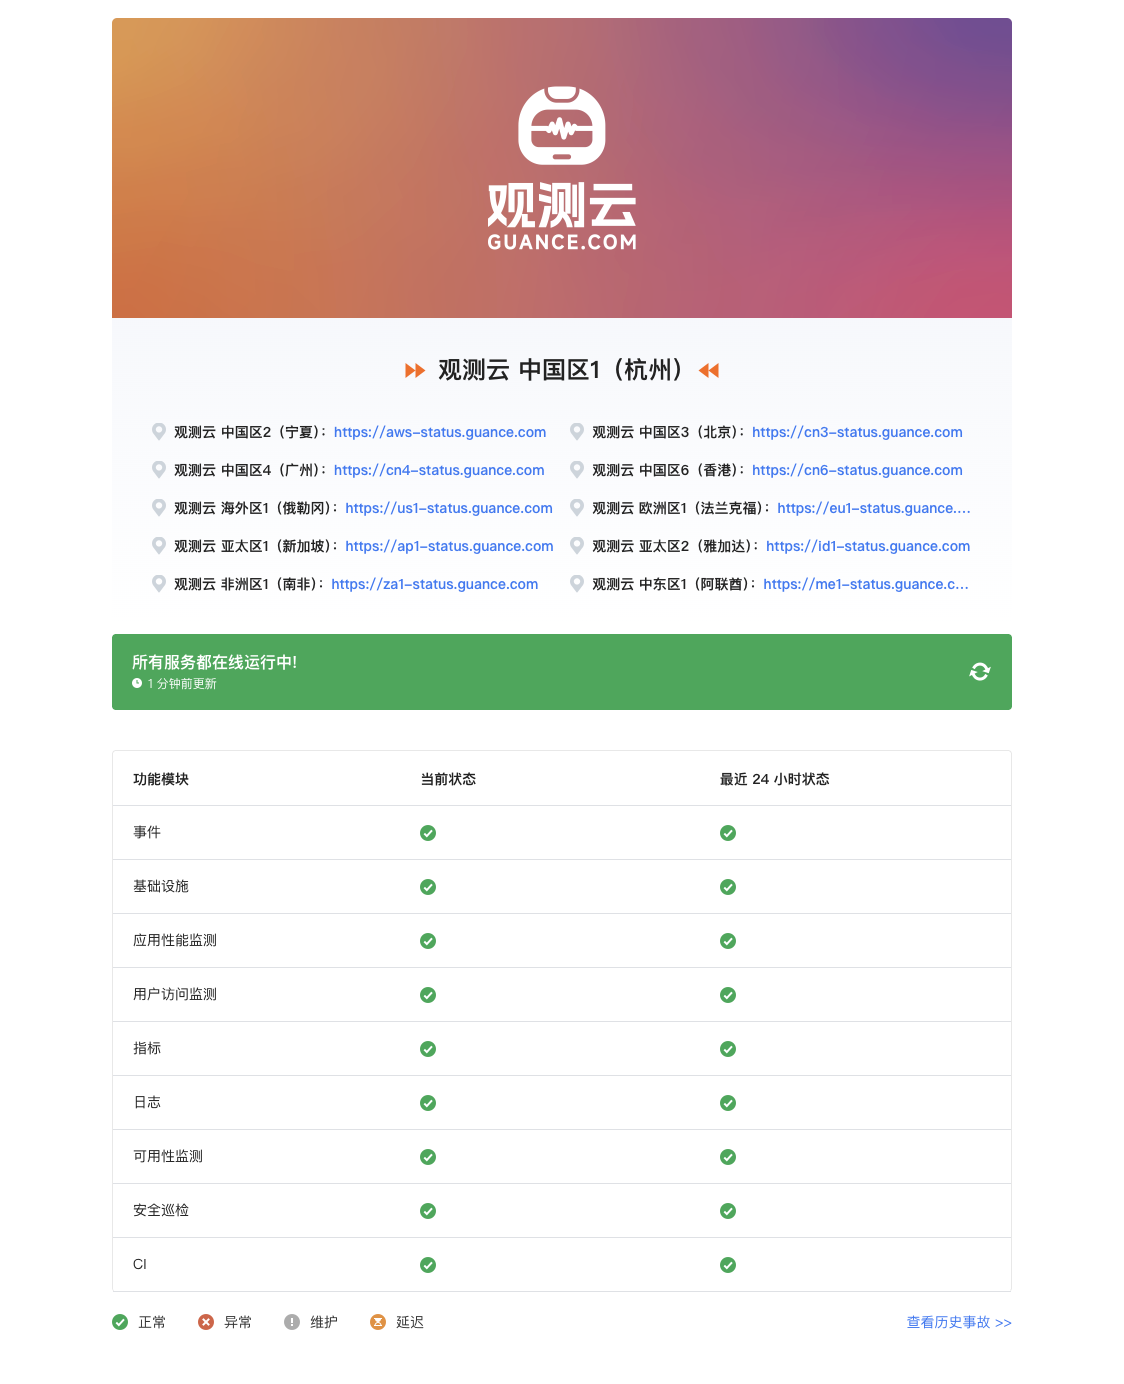
Managing Service Status
On the service status page, you can:
- Click the links of various service sites to switch and view their corresponding service statuses.
- Refresh the service status in real-time.
- View the current status and the status over the past 24 hours for functional modules including Events, Infrastructure, RUM, APM, Metrics, Logs, Synthetic Tests, and CI.
- Switch to view Historical Incidents.
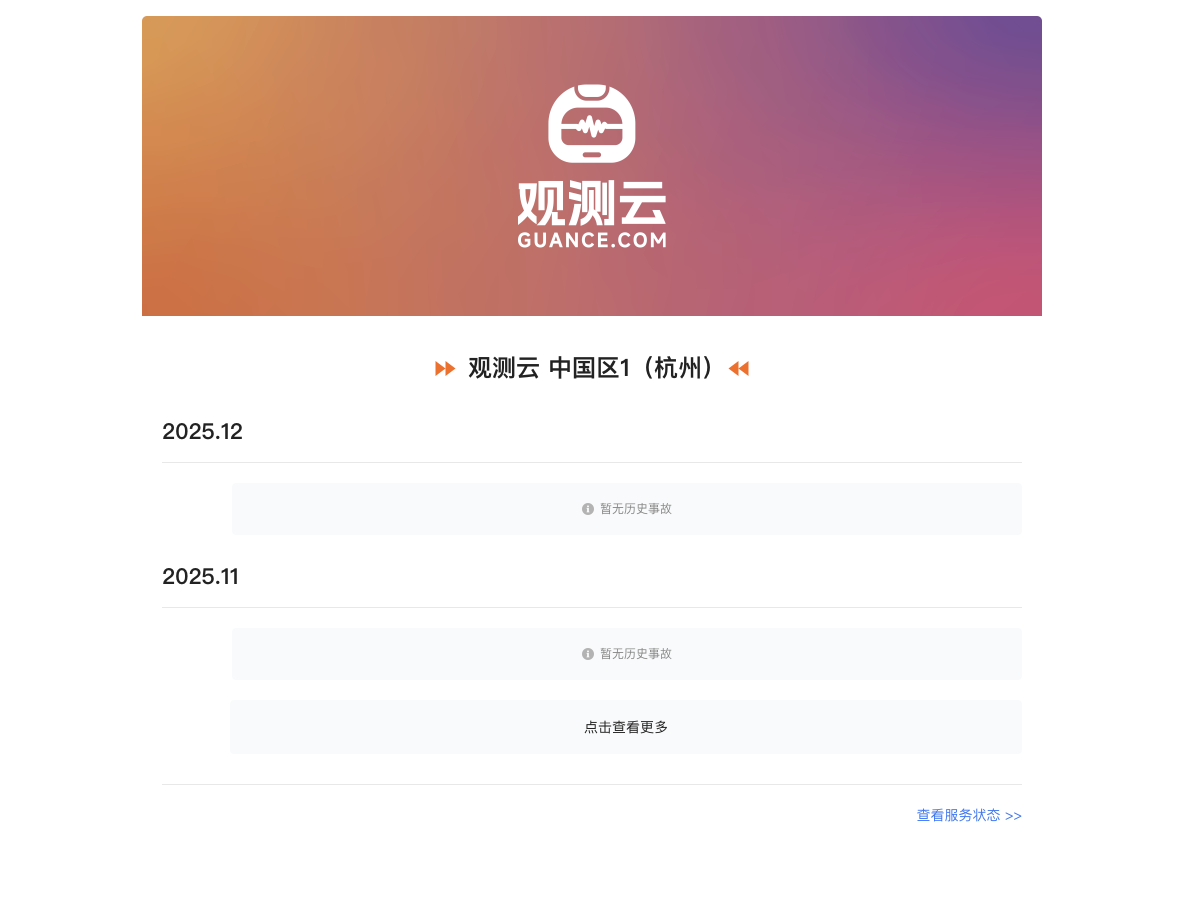
Historical Incidents
On the historical incidents page, you can:
- View all service failures that occurred each month.
- Switch to view service status.