View
You can view the user access environment, trace the user's operation path, analyze the response time of user operations, and understand the performance metrics of the backend application call chains triggered by user operations.
In the View explorer, you can:
- Track user access data for each page, including load time, dwell time, etc.
- Combine data such as resource requests, resource errors, and logs associated with each page to comprehensively analyze the performance of user access to business applications, helping to quickly identify and optimize code issues in the application.
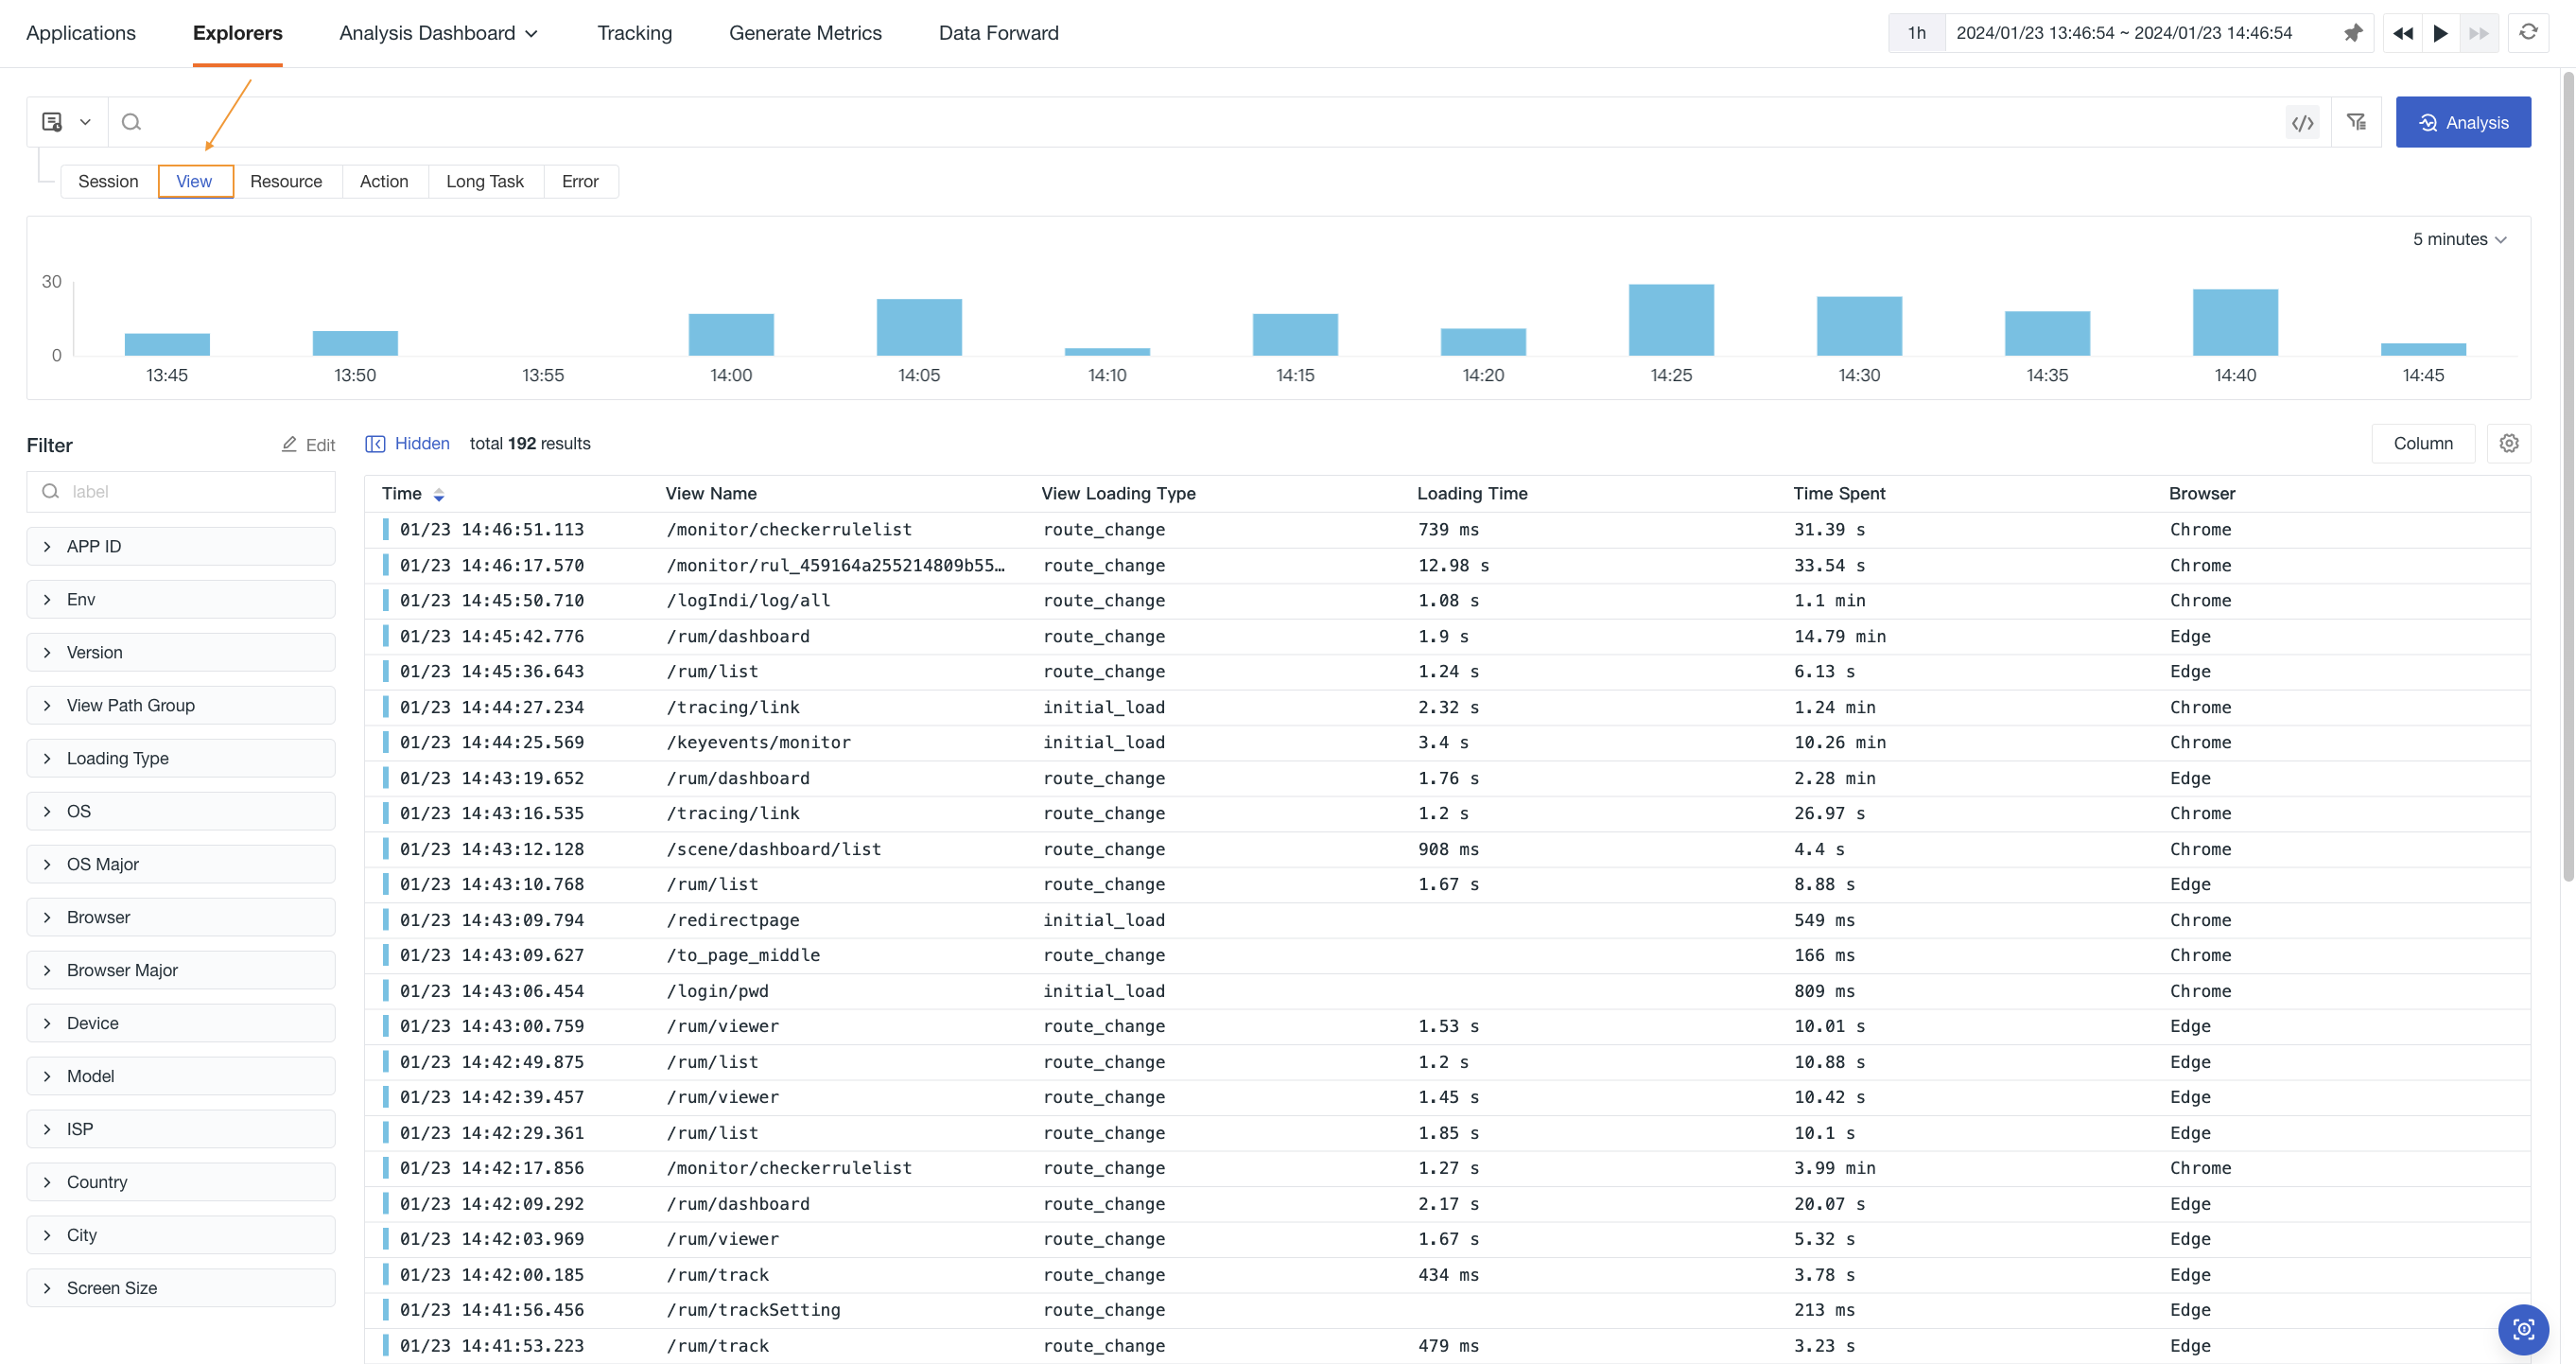
Explorer List
In the View explorer, you can quickly view the page URL, page load type, page load time, and user dwell time during user access.
Details Page
Click on the data entry in the list that you want to view in detail. You can view the page performance details of the user's visit, including attributes, source, performance details, trace details, error details, associated logs, etc.
Source
In the Source section, you can view the Session details for the current View, and filter/copy the current Session ID.
Performance
The Performance page helps you view the frontend page performance when a user accesses the specified application, including page load time, content paint time, interaction time, input delay, etc. Taking the following figure as an example, it can be seen that the LCP (Largest Contentful Paint) metric reached 8.4 seconds, while the recommended time is within 2.5 seconds, indicating that the page loads slowly and needs optimization.
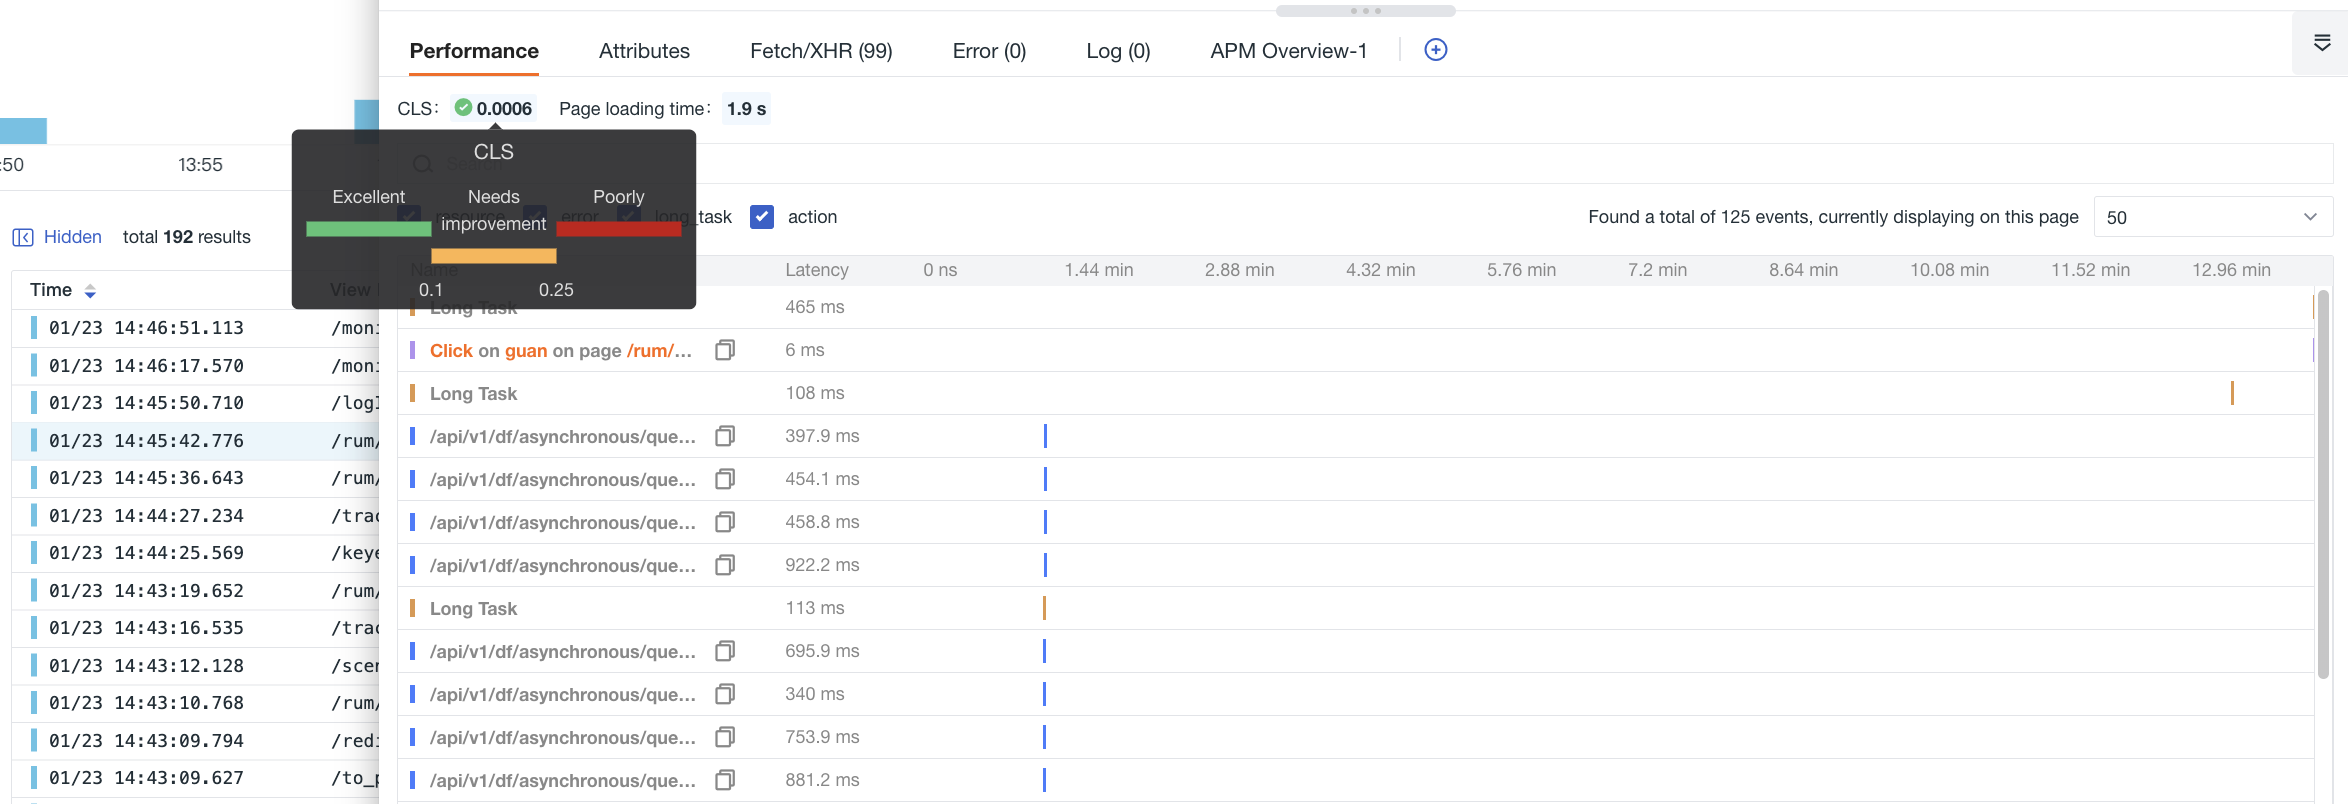
For events on the current page, you can choose to display the most recent 50, 100, 200 entries, or all entries:
Obsy AI Error Analysis
Guance provides the ability to parse error data with one click. It leverages large language models to automatically extract key information from the data, combines online search engines and operation knowledge bases, quickly analyzes possible fault causes, and provides preliminary solutions.
- Click on a single data entry to expand its details page.
- Click "Obsy AI Error Analysis" in the upper right corner.
- Begin the anomaly analysis.
Extended Fields
Attributes are the properties and characteristics of data objects, defining the value of each attribute.
In the search bar, you can enter a field name or value to quickly search and locate it.
After checking the field alias, you can view it after the field name. You can choose as needed.
On the trace details page, you can view the relevant field attributes of the current trace in the Extended Fields section:
| Operation | Description |
|---|---|
| Filter by field value | Adds this field to the explorer to view all data related to this field. |
| Exclude by field value | Adds this field to the explorer to view all data except that related to this field. |
| Add to display columns | Adds this field to the explorer list for viewing. |
| Copy | Copies this field to the clipboard. |
Associated Fetch/XHR
When switching to Fetch/XHR, you can view each network request made to the backend application during user access, including the occurrence time, requested trace, and duration.
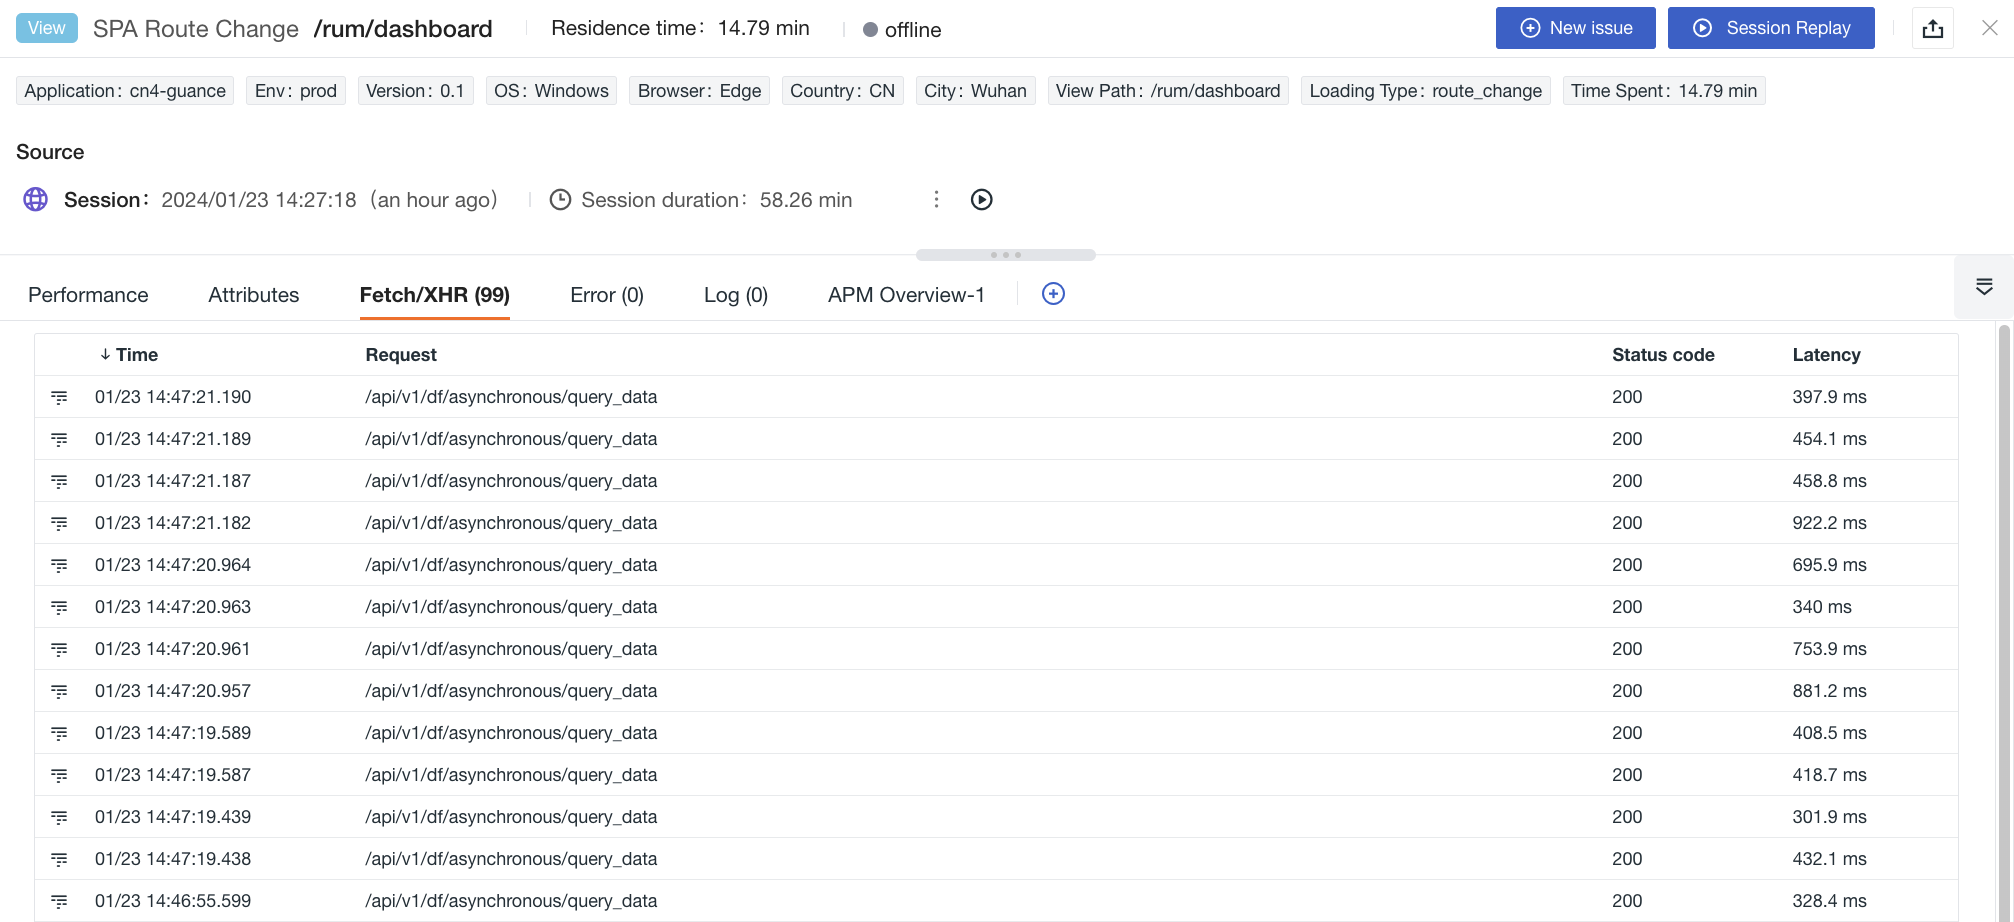
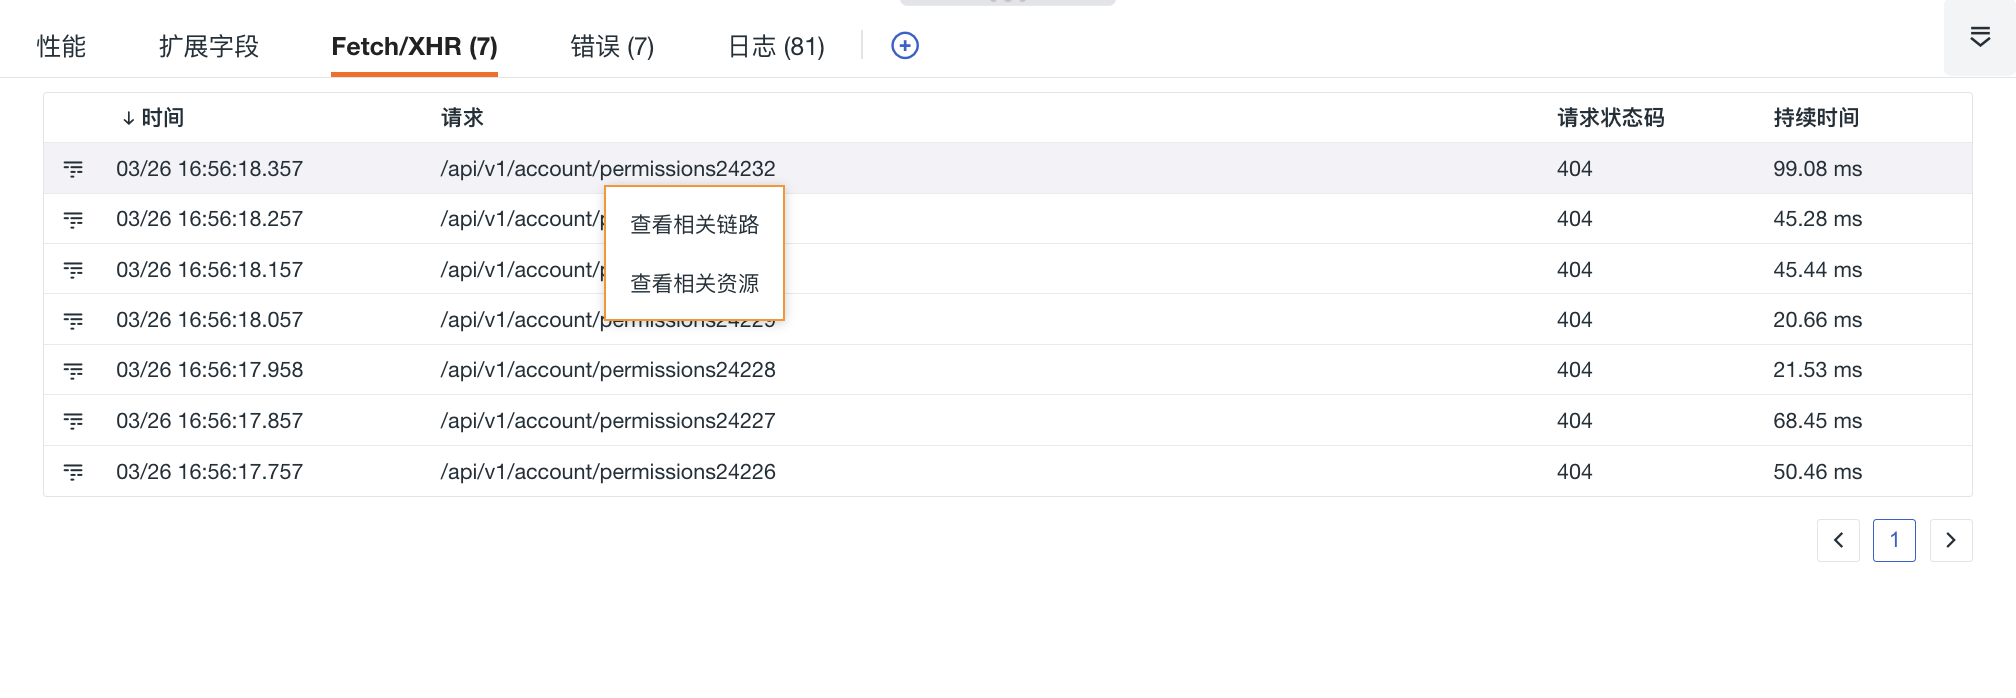
If a network request has a corresponding trace_id, a small icon will appear as a prompt before the request. Clicking it will jump to the details page of the corresponding trace.
Click on a data row, and you can choose to view the related trace or resources for that data entry:
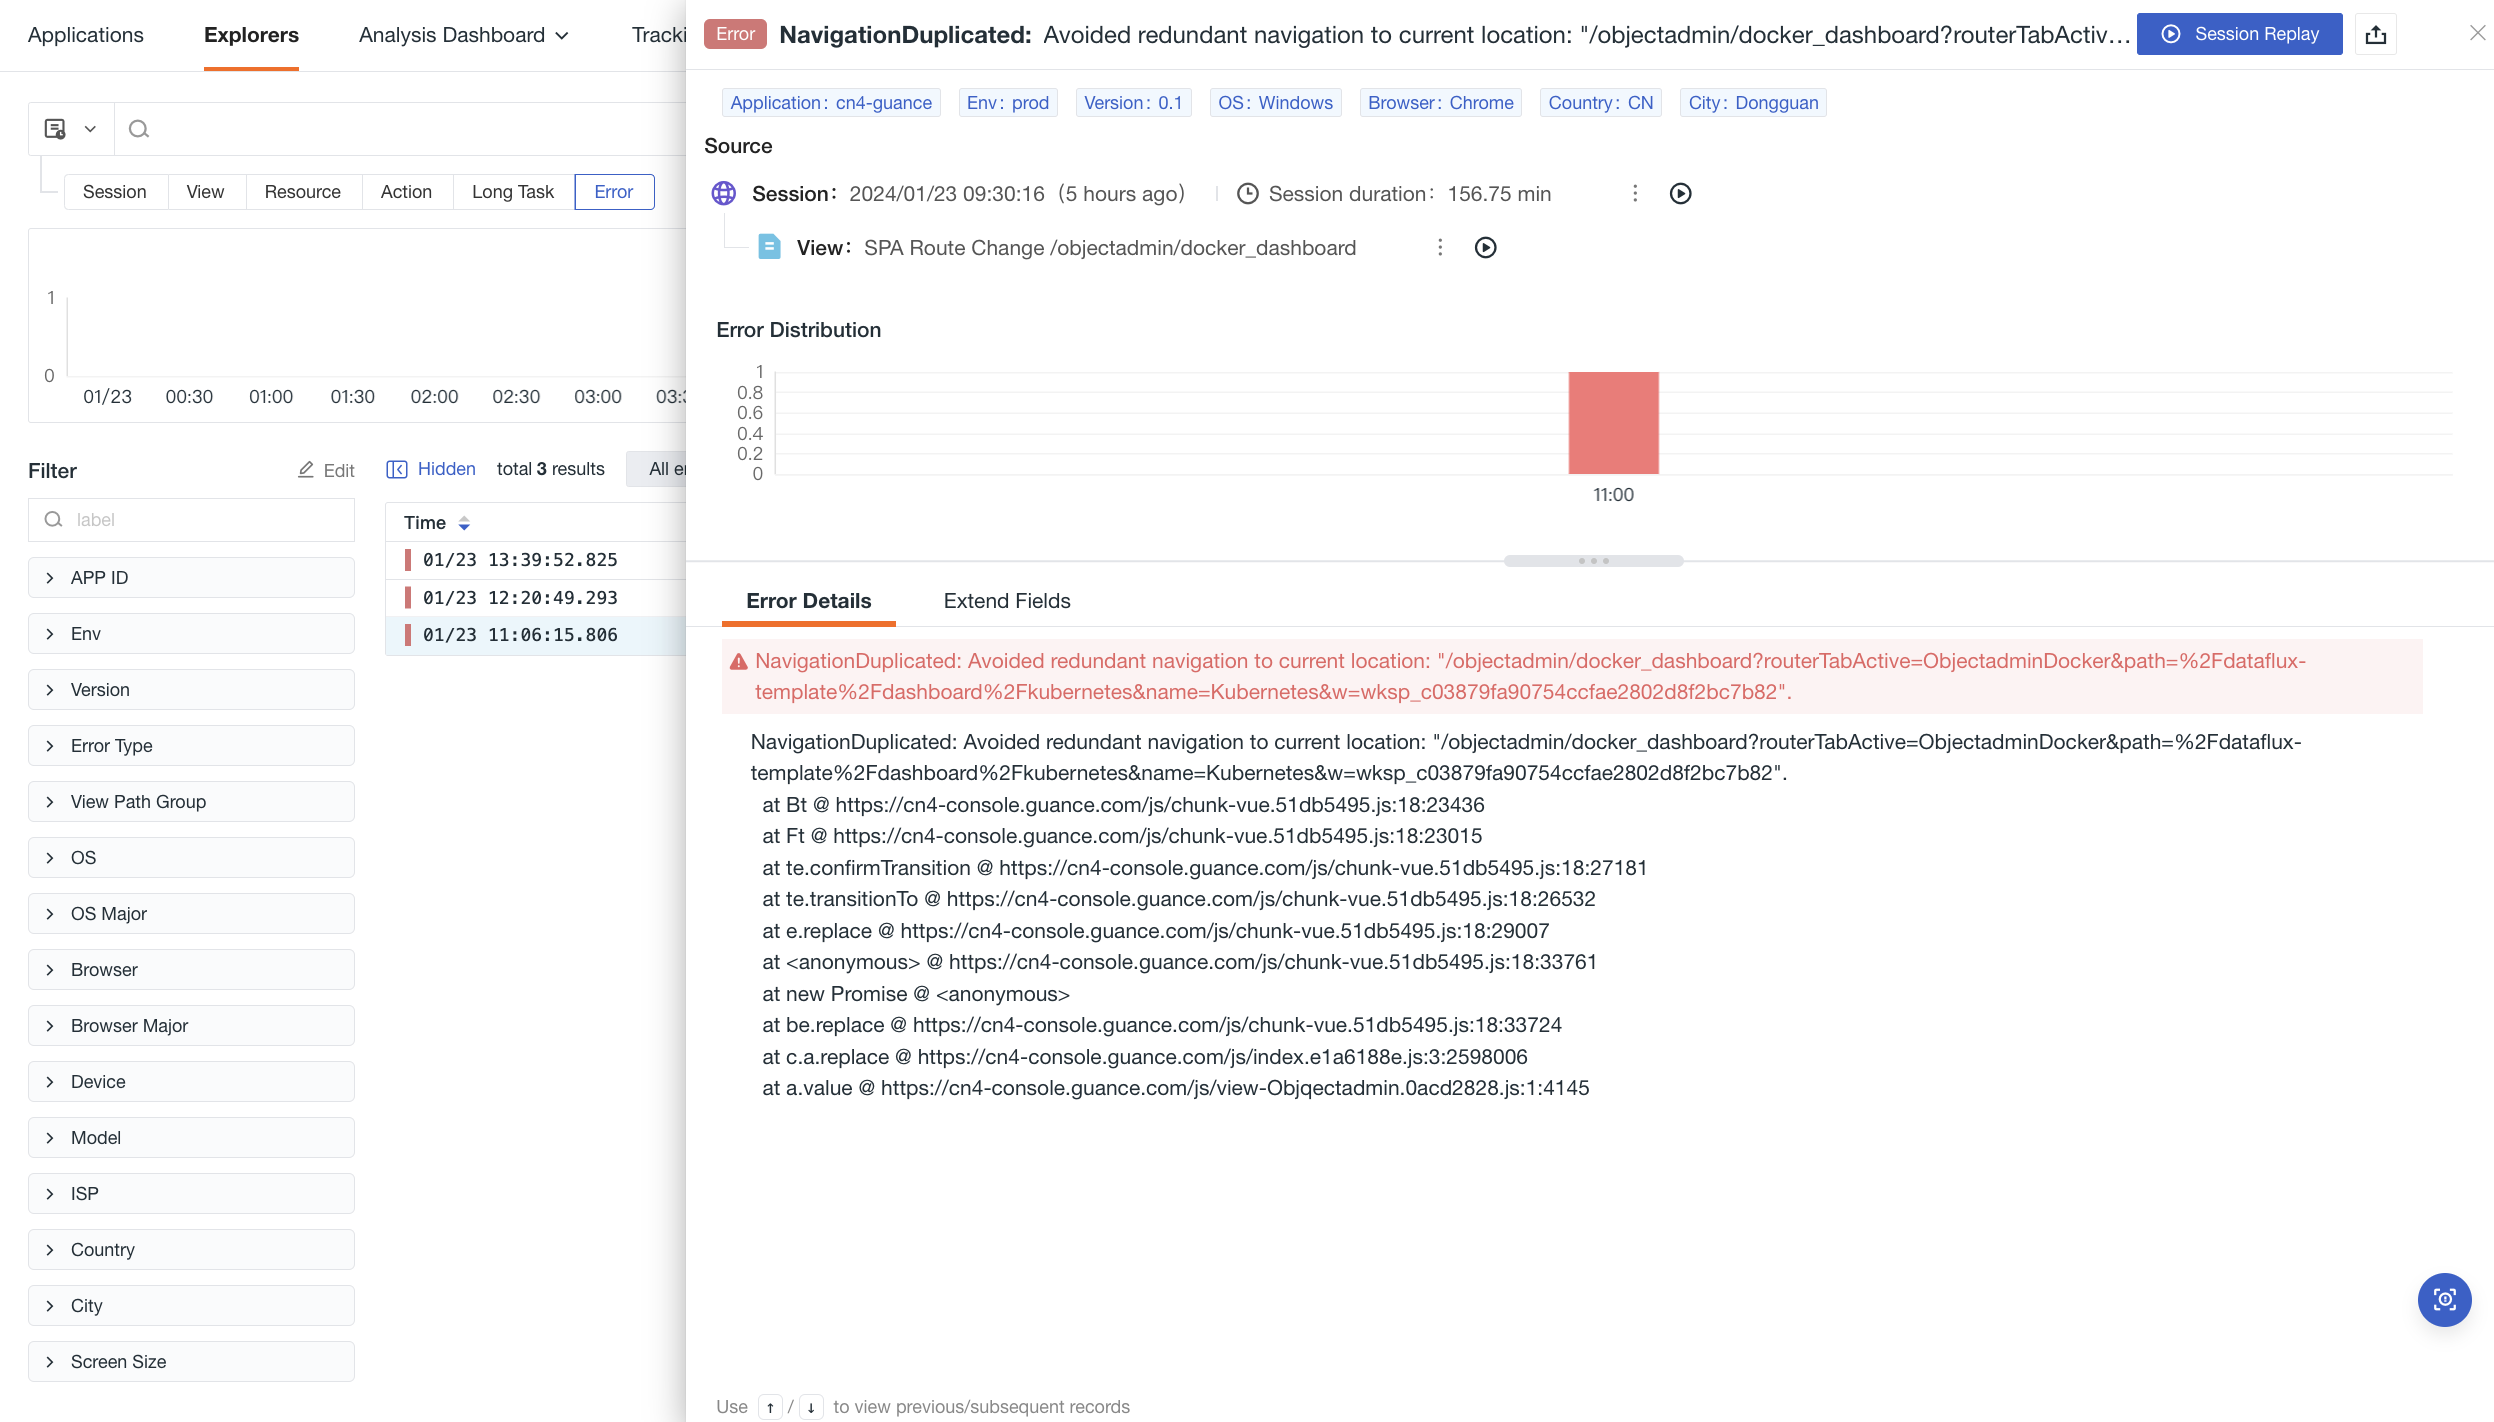
Associated Errors
When switching to Errors, you can view the error data information, error type, and error occurrence time that appeared during this user access.
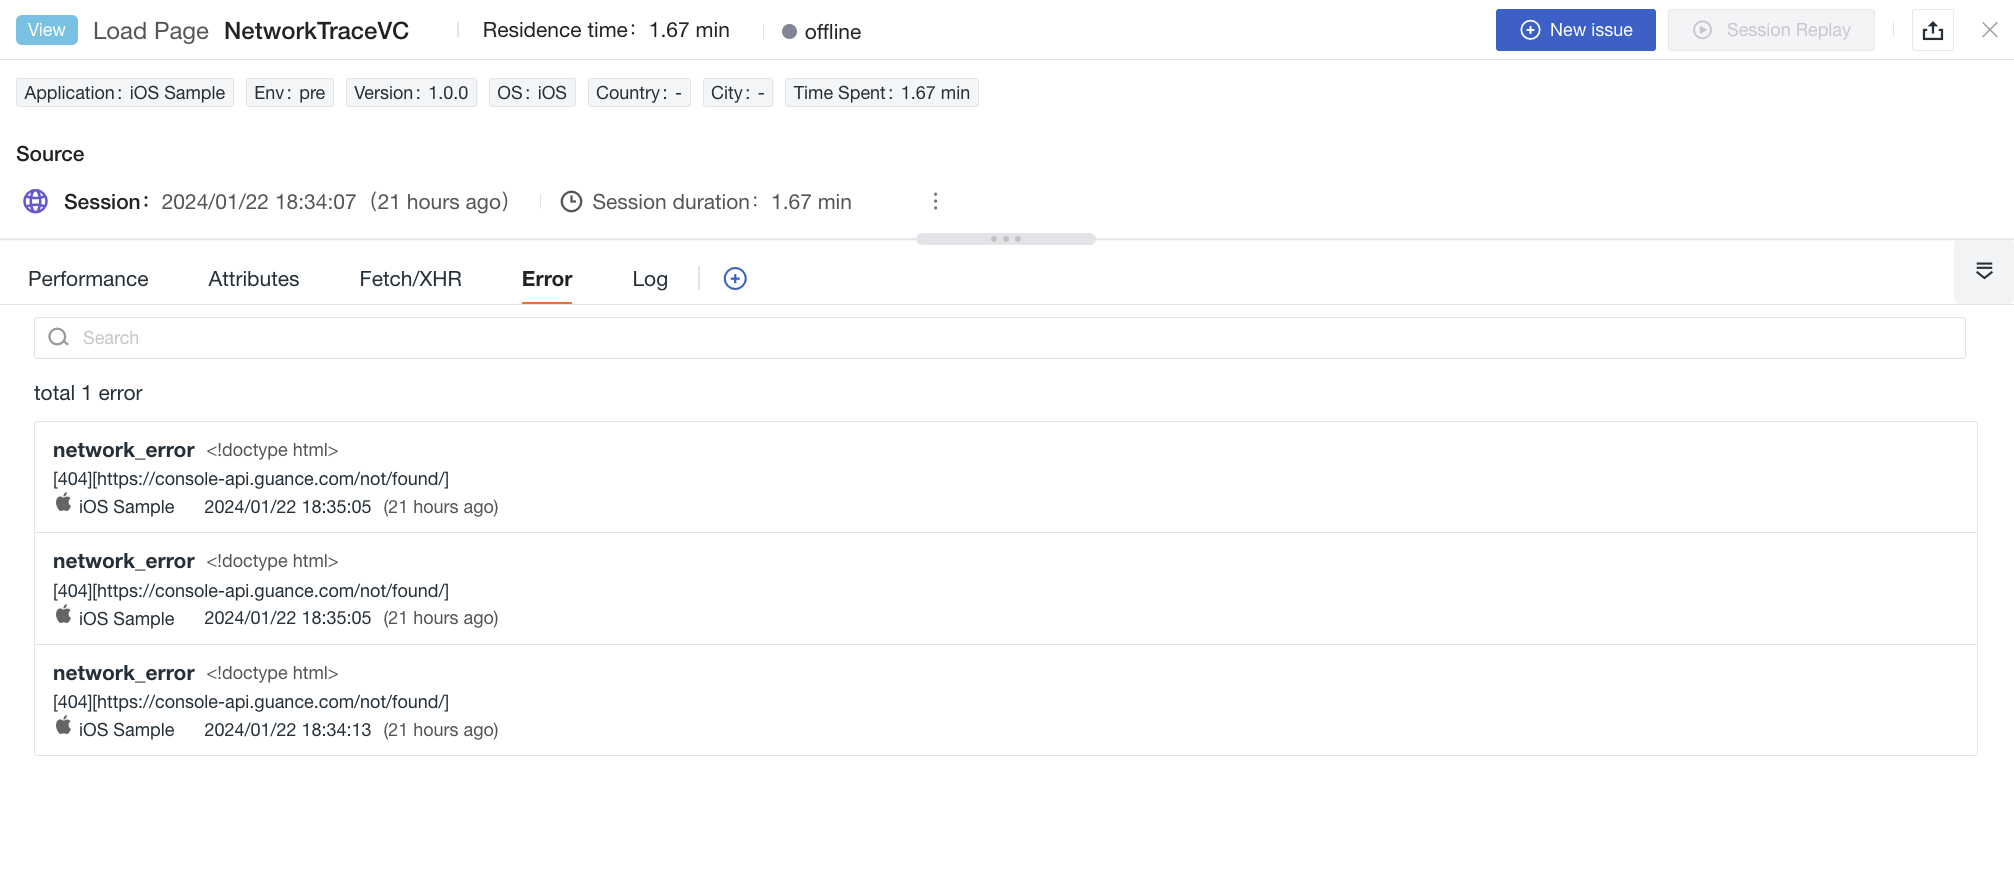
Clicking on the error message will jump to the details page of the corresponding error.
For more error details, refer to Error Explorer.
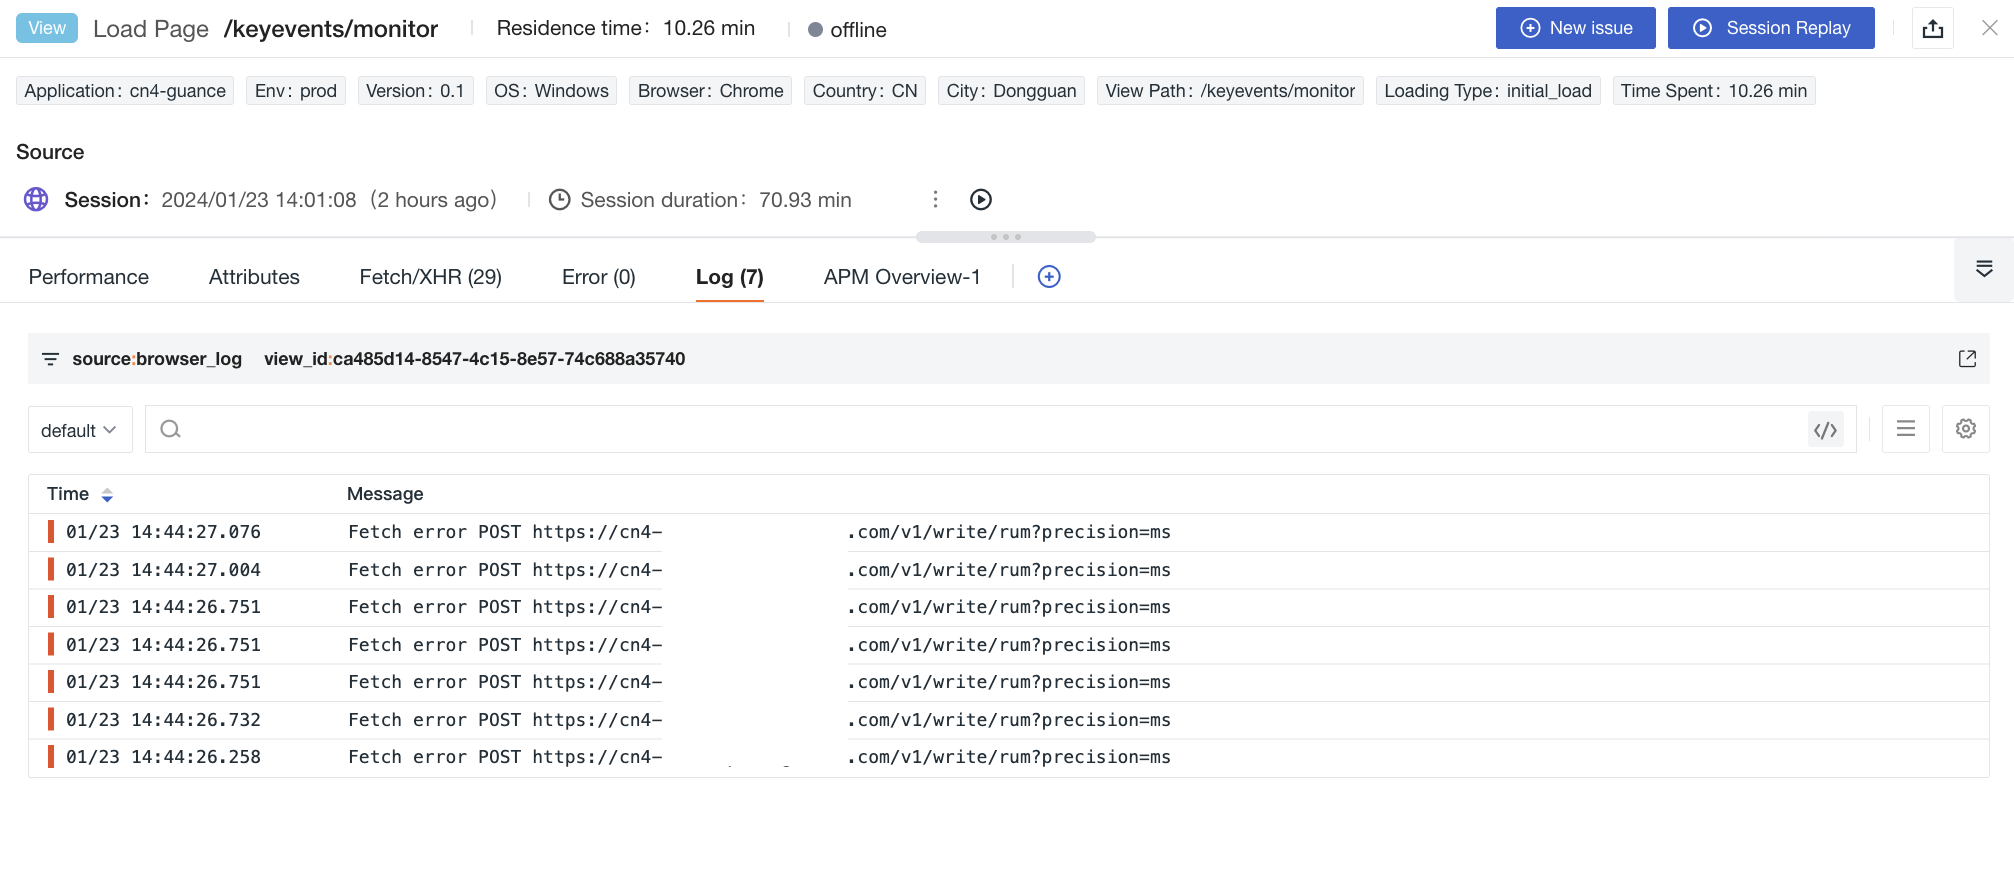
Associated Logs
Through the Logs section at the bottom of the details page, you can view logs from the last 1 hour related to the current user access and their count. You can perform keyword searches, multi-tag filtering, and time sorting on these related logs.
- If you need to view more detailed log information: you can click on the log content to jump to the corresponding log details page, or click Jump to go to Logs to view all logs related to this host.
- If you need to view more log fields or more complete log content: you can customize the Maximum Display Lines and Display Columns through the associated log explorer's Display Columns.
Note: For a smoother user query experience, Guance saves the user's browsing settings in Logs (including "Maximum Display Lines" and "Display Columns") instantly by default, to keep the Associated Logs consistent with Logs. However, custom adjustments made in Associated Logs are not saved after exiting the page.
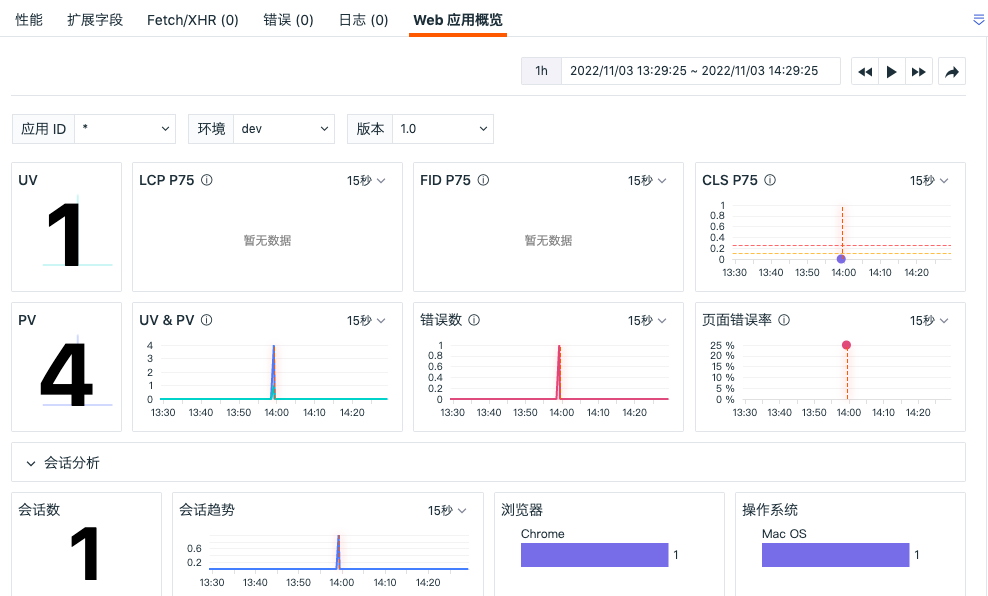
Bind View
Guance supports setting up binding or deleting built-in views (user views) to the details page. Click "Bind Built-in View" to add a new view to the current details page.
For more details, refer to the documentation Bind Built-in View.