Log Intelligent Detection
Based on intelligent detection algorithms, it monitors log data generated by collectors within the workspace. It intelligently identifies anomalies such as sudden increases or decreases in log volume and spikes in error logs, promptly detecting abnormal states that do not meet expectations.
Use Cases
Mostly applicable to IT monitoring scenarios such as code exceptions or task scheduling detection. For example, monitoring sudden spikes in error logs.
Configuration
-
Define the monitor name.
-
Select the detection dimension: Supports detection By Source or By Service, automatically matching the user-selected detection dimension.
-
Select the detection scope: Filters the data of the detection indicators based on the tags of the indicators, limiting the scope of the detected data. Supports adding one or more tag filters. If no filter is added, all log data will be detected.
Viewing Events
The monitor retrieves the detection log indicators from the last 10 minutes. When it identifies sudden increases or decreases in log volume or spikes in error logs, it generates corresponding events. These abnormal events can be viewed in the Incident > Intelligent Inspection list.
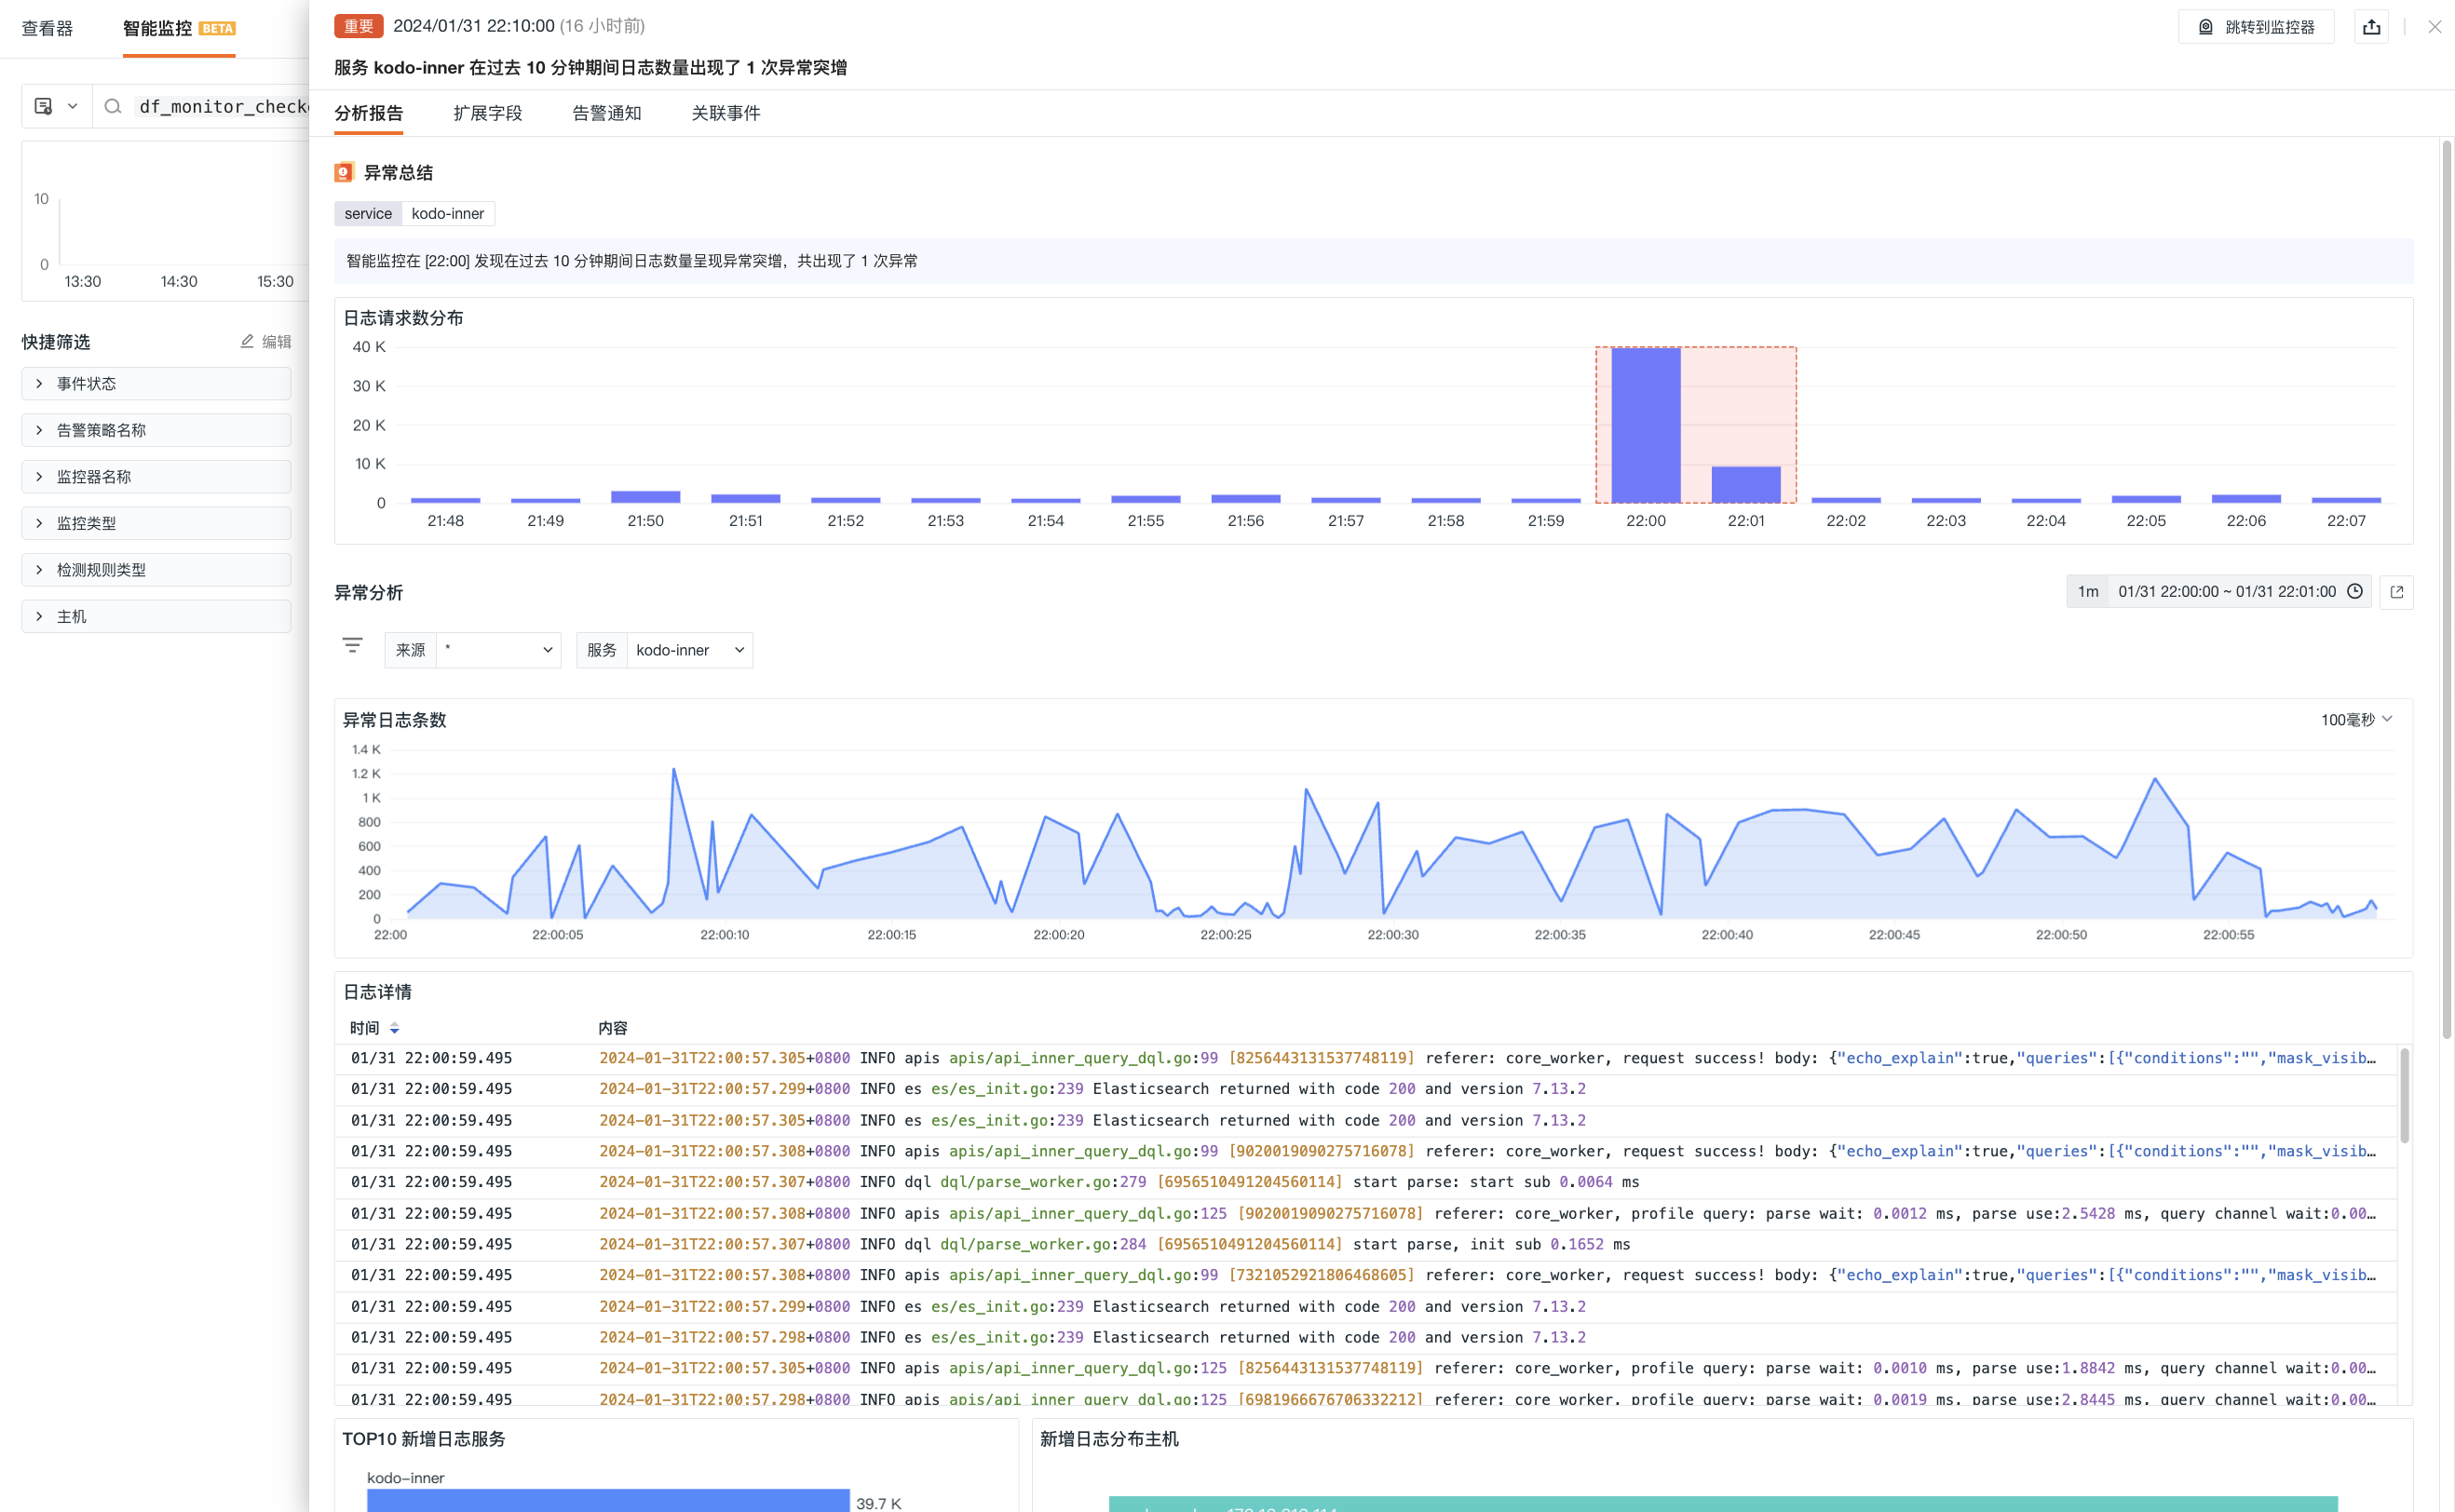
Event Details Page
Click Incident to view the details page of an intelligent inspection event, including the event status, anomaly occurrence time, anomaly name, analysis report, alert notifications, history records, and related events.
-
Click Jump to Monitor in the upper right corner to view and adjust the Intelligent Monitor Configuration.
-
Click the Export button in the upper right corner to choose between Export JSON File and Export PDF File, allowing you to obtain all key data related to the current event.
Analysis Report
-
Anomaly Summary: View the current abnormal log tags, detailed anomaly analysis report, and distribution of error request counts.
-
Error Analysis: View clustering information of error logs.
Note
When multiple interval anomalies exist, the Anomaly Summary > Anomaly Value Distribution Chart and the Anomaly Analysis dashboard will, by default, display the analysis of the first abnormal interval. You can click the "Anomaly Value Distribution Chart" to switch, and the anomaly analysis dashboard will update accordingly.