Error Tracking
The Error Tracking Explorer focuses on analyzing error data from Application Performance Monitoring (APM). Through it, you can:
-
View historical error trends: Observe the frequency changes over time for specific error types or sources using charts such as leaderboards and time series graphs;
-
Analyze error distribution: Quickly locate high-frequency error sources, such as service error rates and resource endpoint error rates;
-
Aggregate similar errors: Automatically categorize error requests with the same exception stack or similar error characteristics to avoid redundant single-link reviews;
- ......
Data Display
The Error Tracking Explorer provides various professional analysis views in the form of lists and charts.
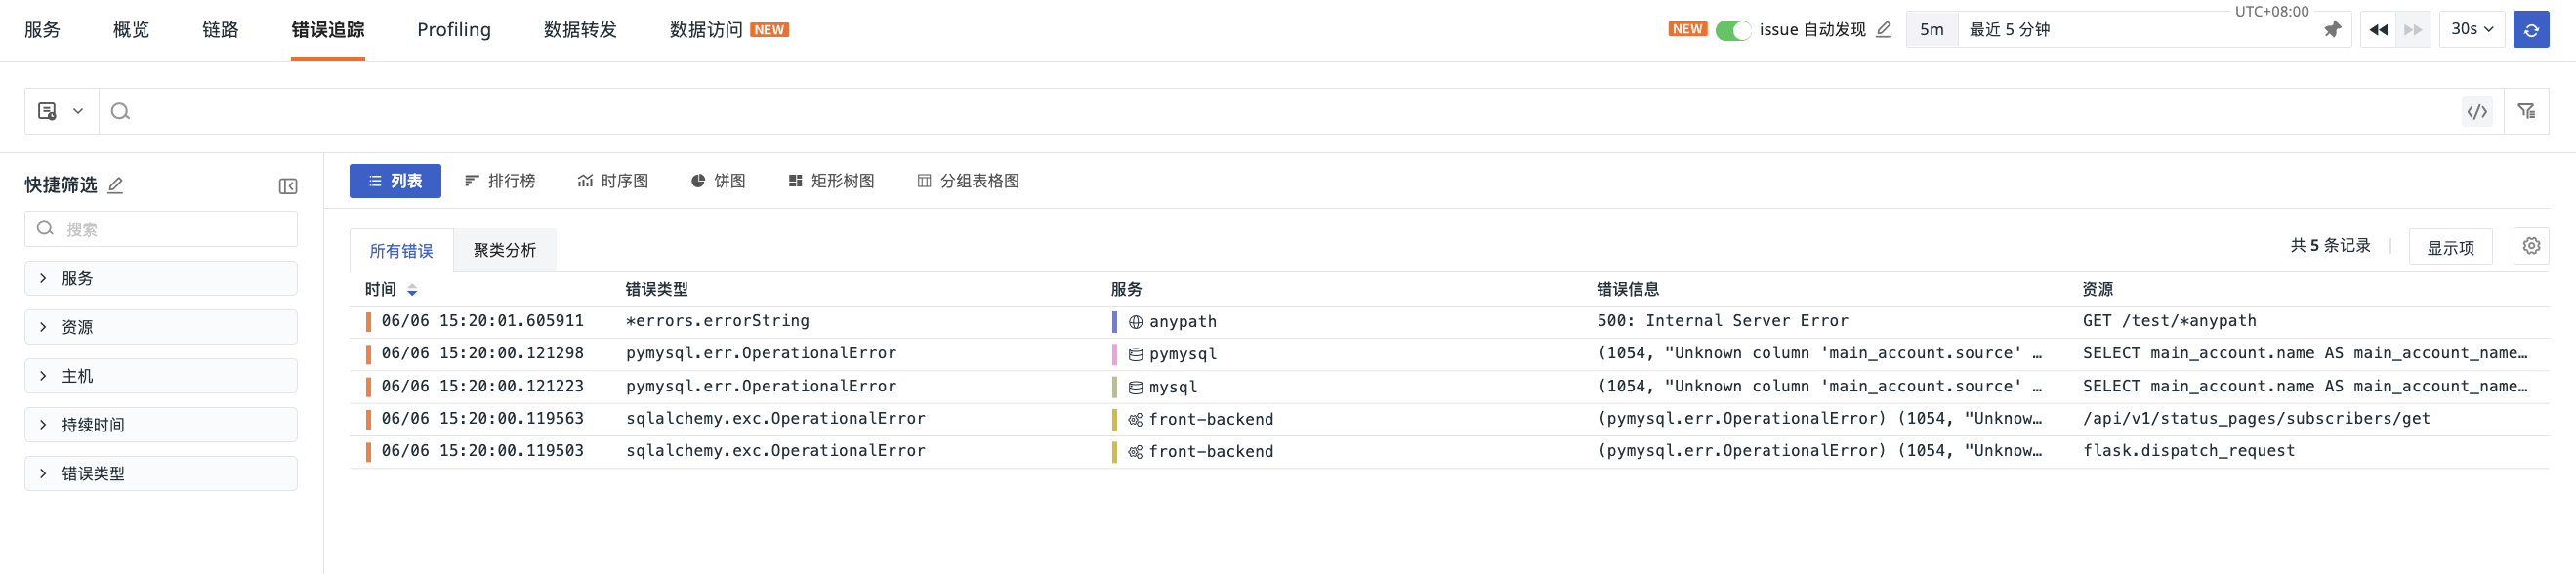
List
Displays detailed records and aggregated results of APM errors within the current workspace, including occurrence time, error type, error message, associated services, and resources.
In list mode, two analysis modes are provided:
All Errors
Records all Spans marked as errors (status=error) and containing an error type (error_type), ultimately viewing all error records that meet the conditions.
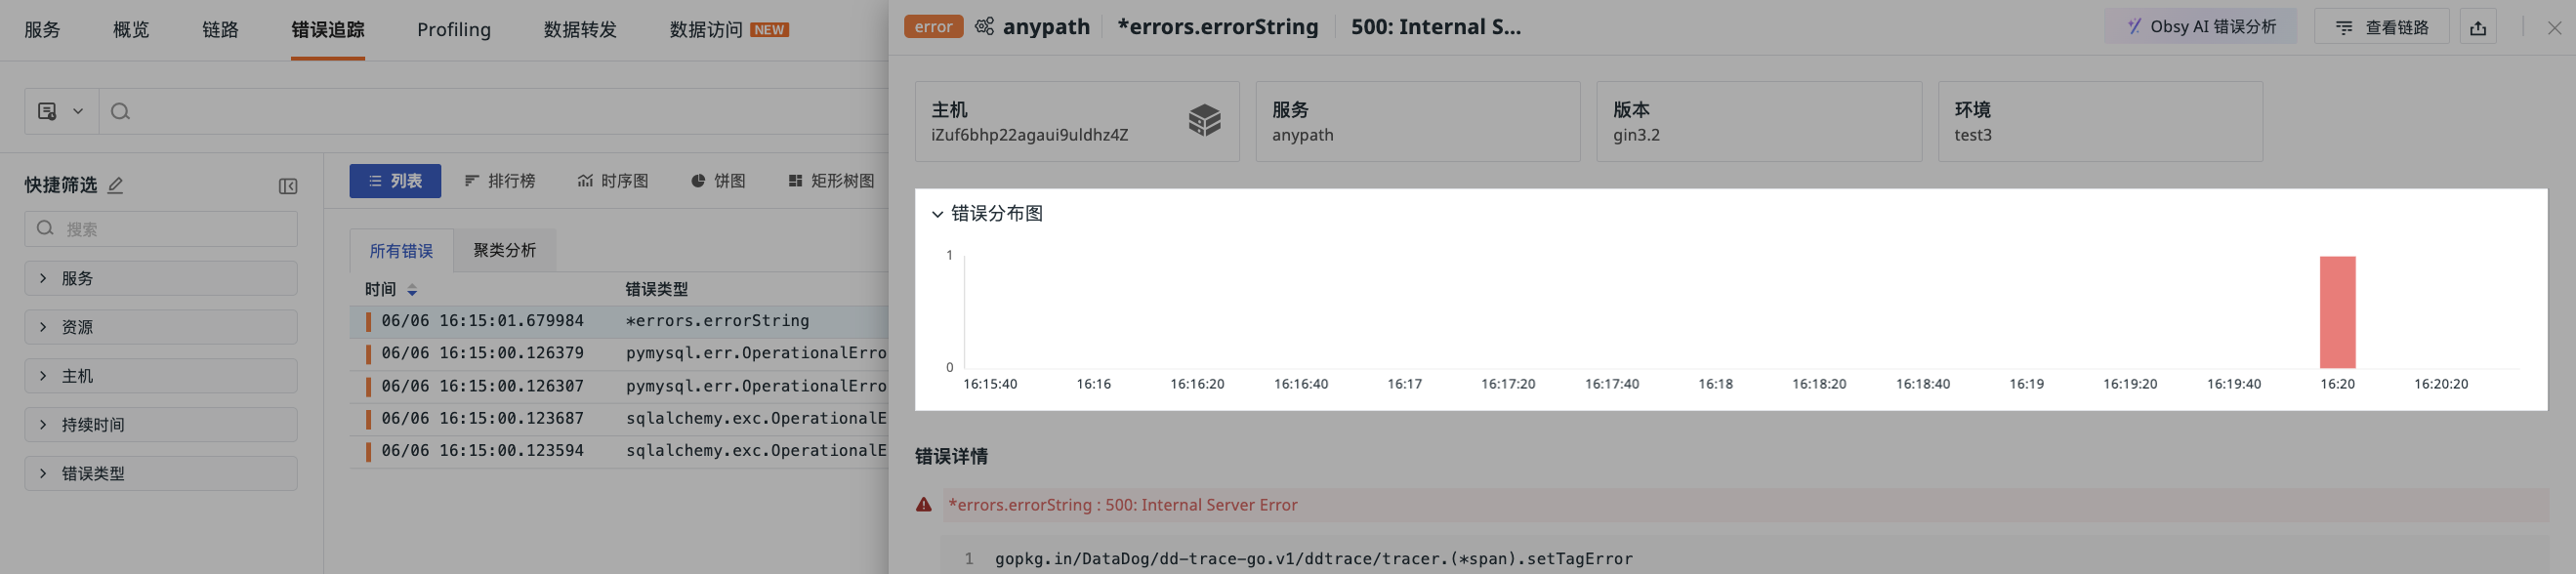
Data Details
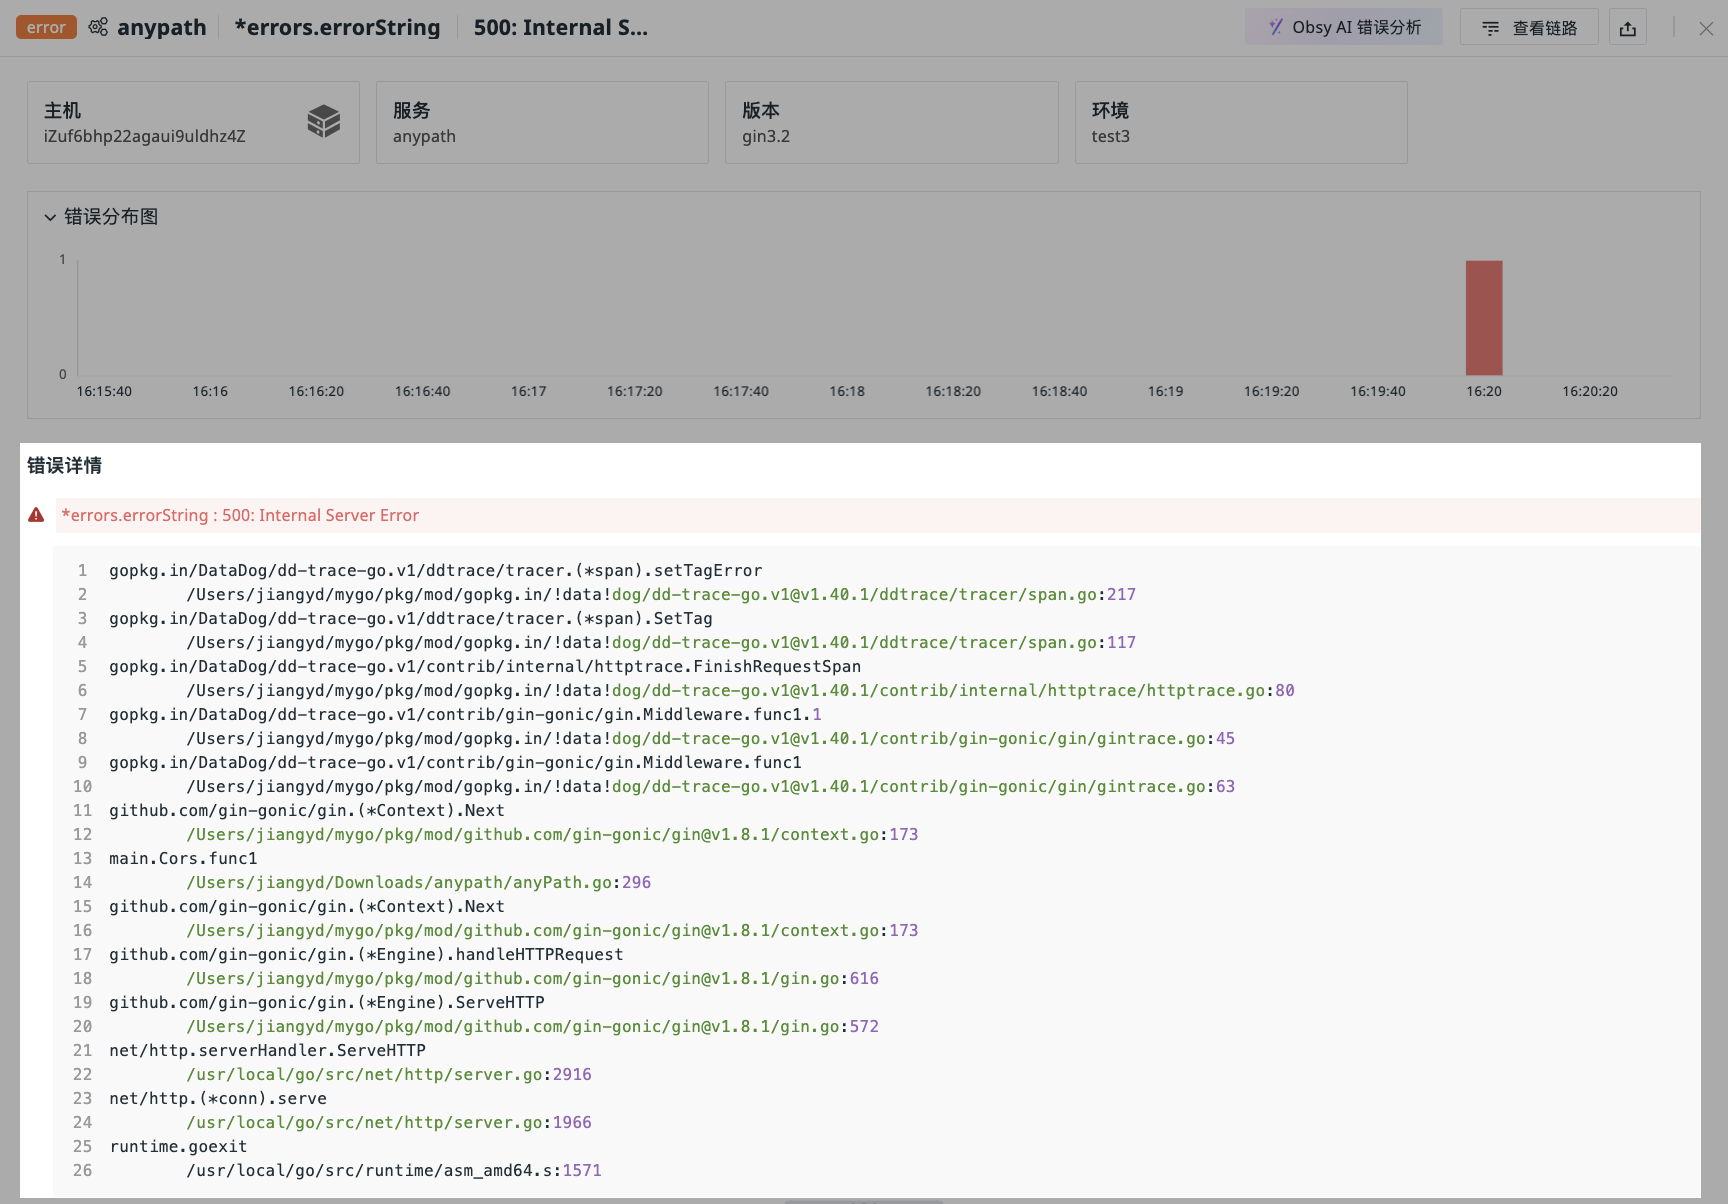
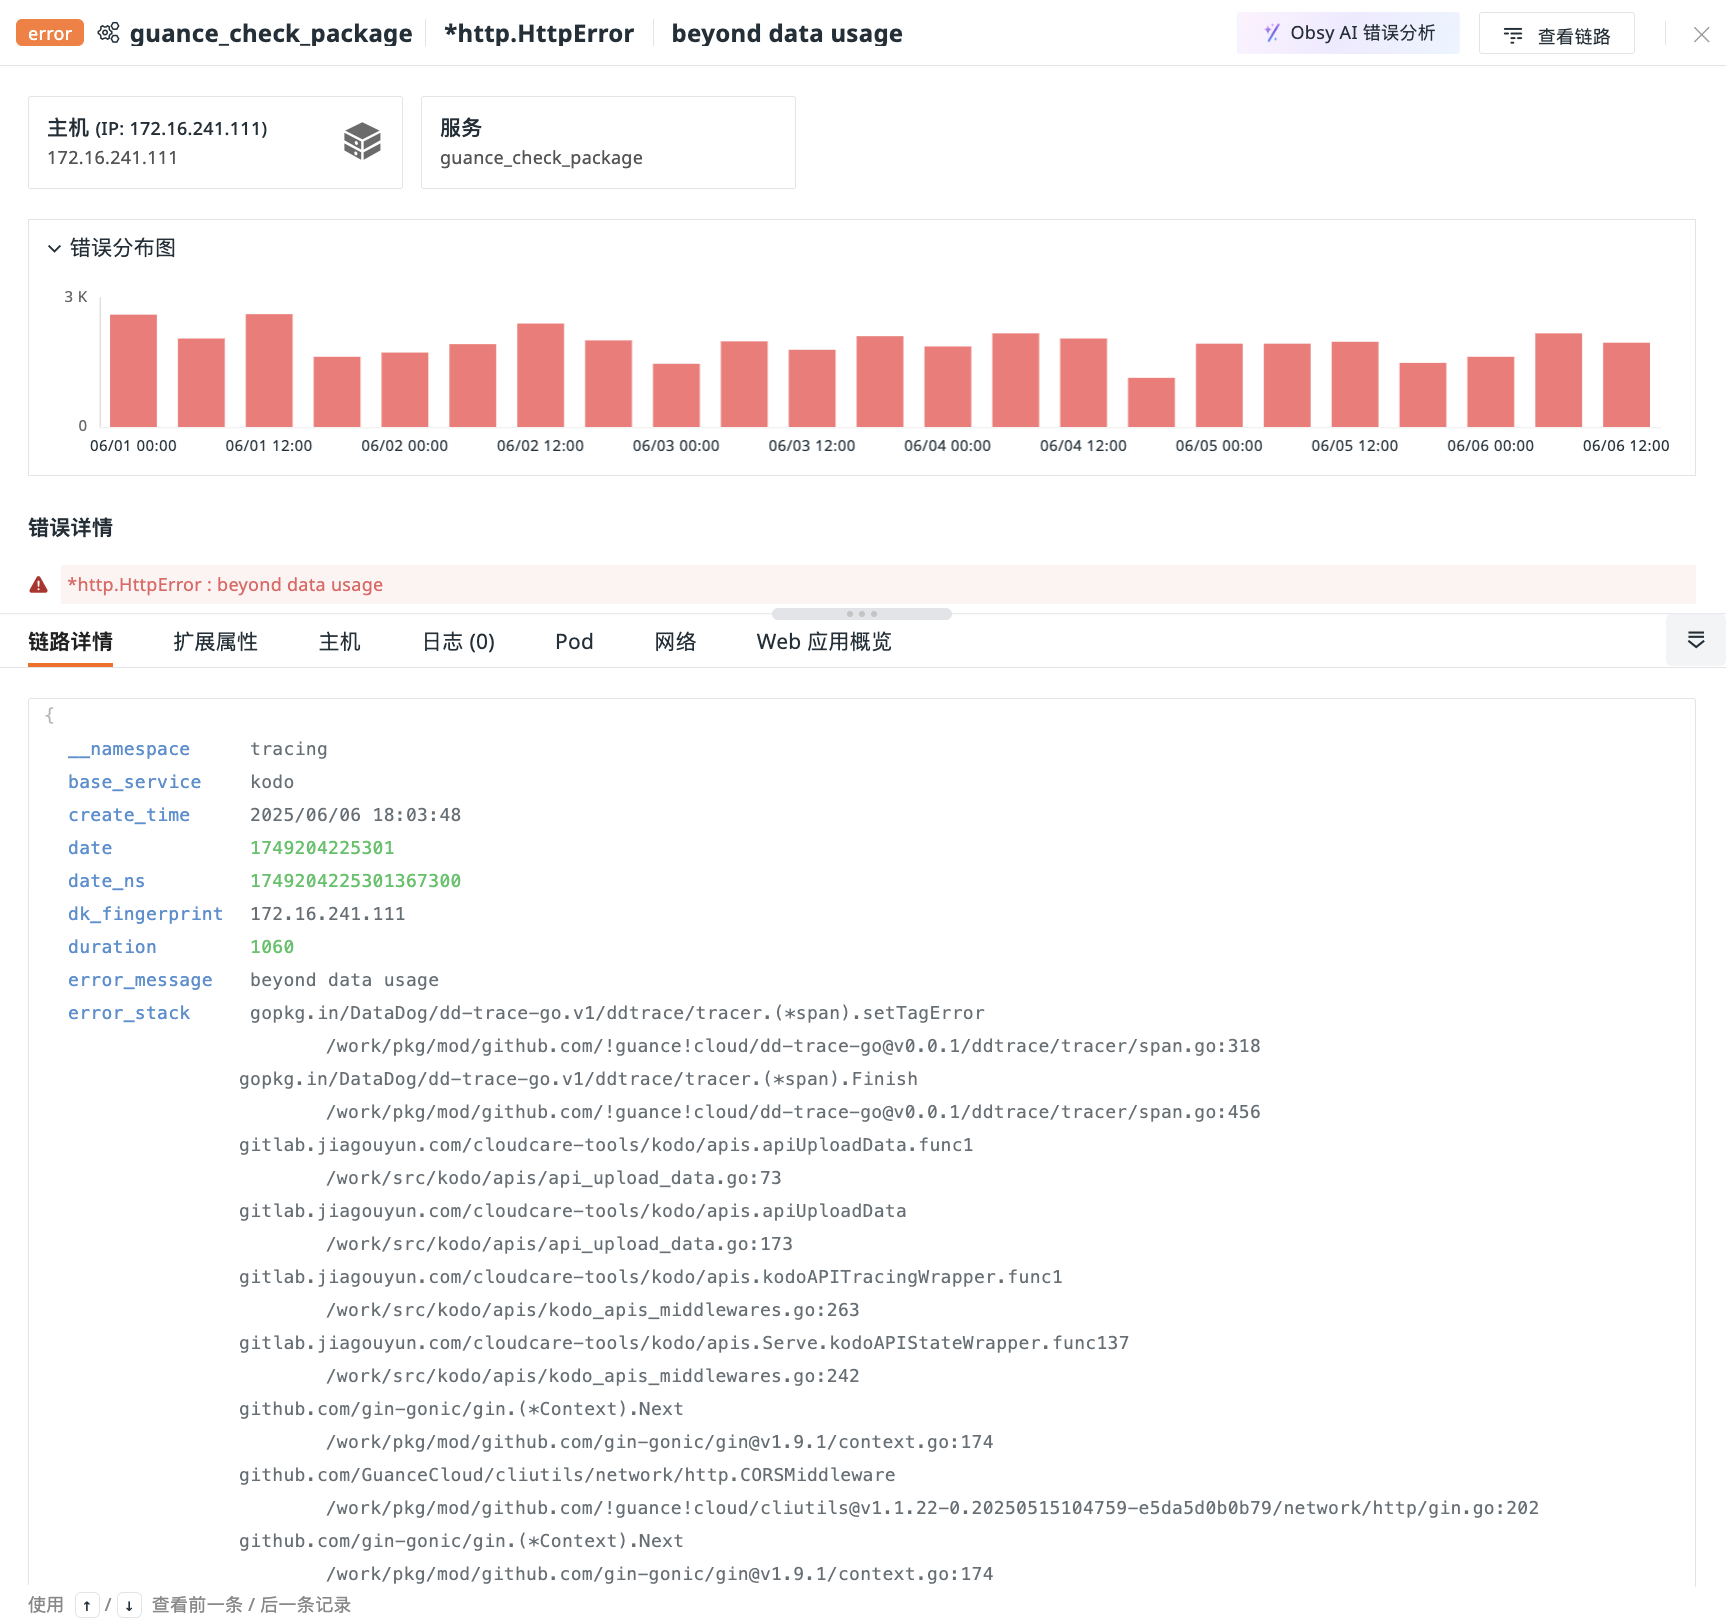
In the Error Tracking Explorer, clicking any error allows you to view its trace details, including service, error type, content, distribution chart, details, trace details, extended attributes, and associated logs, hosts, networks, etc.
In the error distribution chart on the error details page, based on the error_message and error_type fields, similar error traces are aggregated and automatically time intervals are selected according to the time range, presenting error distribution trends.
Displays error detail information.
Displays field information under the current error trace service.
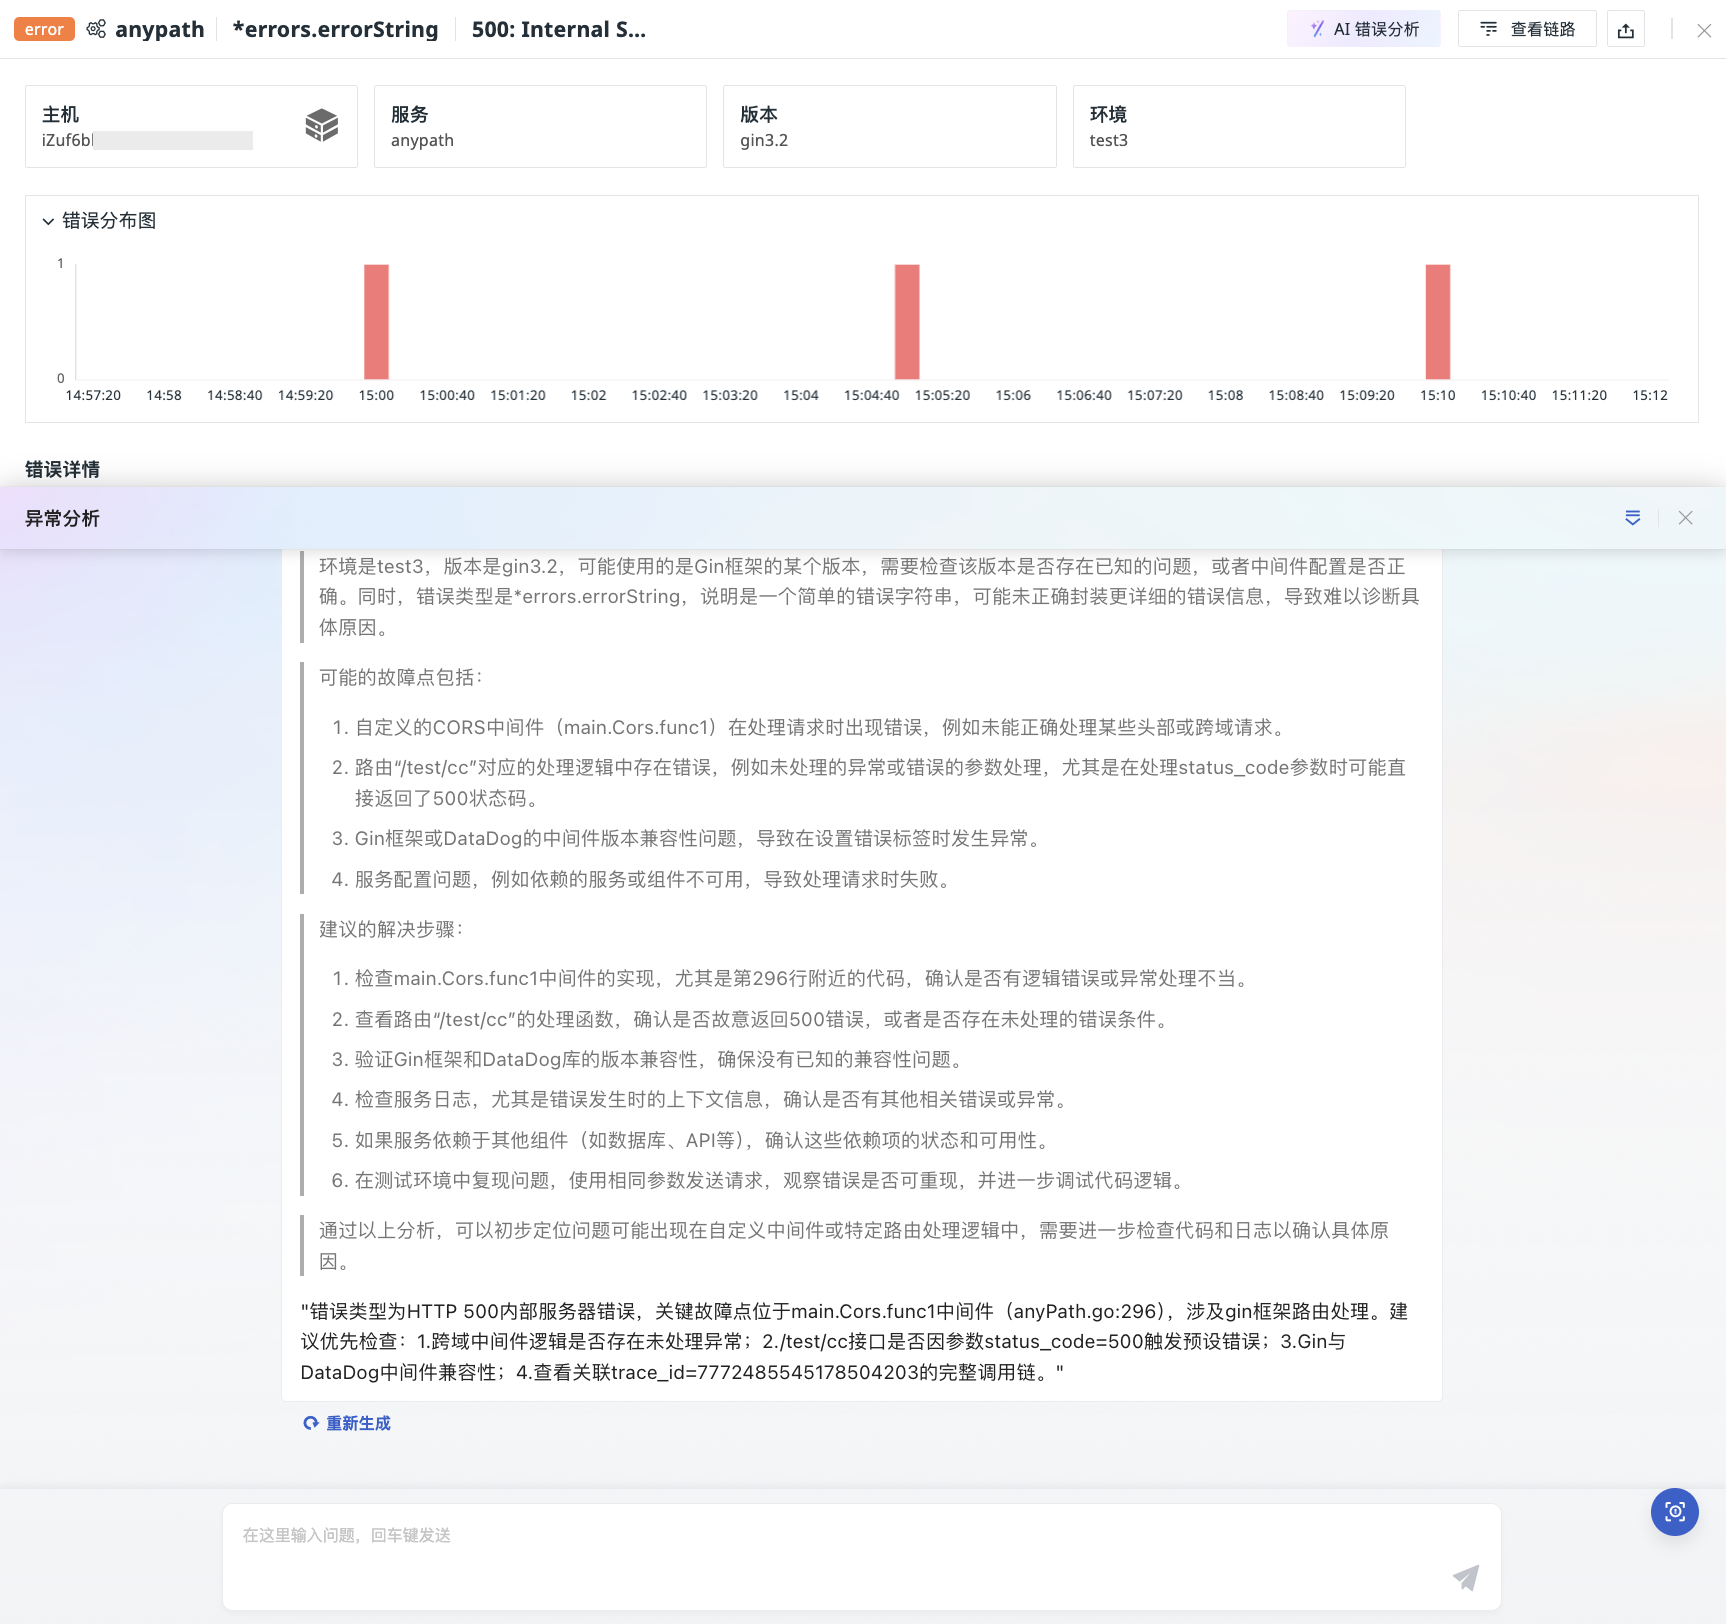
Obsy AI Error Analysis
Guance provides the ability to parse error data with one click. It uses large models to automatically extract key information from the data and combines online search engines and operations knowledge bases to quickly analyze possible causes of failures and provide preliminary solutions.
- Click on a single data point to expand the details page;
- Click on "Obsy AI Error Analysis" in the upper right corner;
- Automatically start anomaly analysis.
Cluster Analysis
Automatically groups similar errors and identifies high-frequency patterns, displaying the first 10,000 error Span information within the selected time range. Based on clustering fields, similarity calculations are performed on error trace data, extracting common patterns to help quickly discover abnormal traces and locate issues.
By default, aggregation is performed based on the error_message field, but up to 3 custom clustering fields can be entered.

Cluster Analysis Details
In the cluster analysis list, clicking any error allows you to view all related traces.
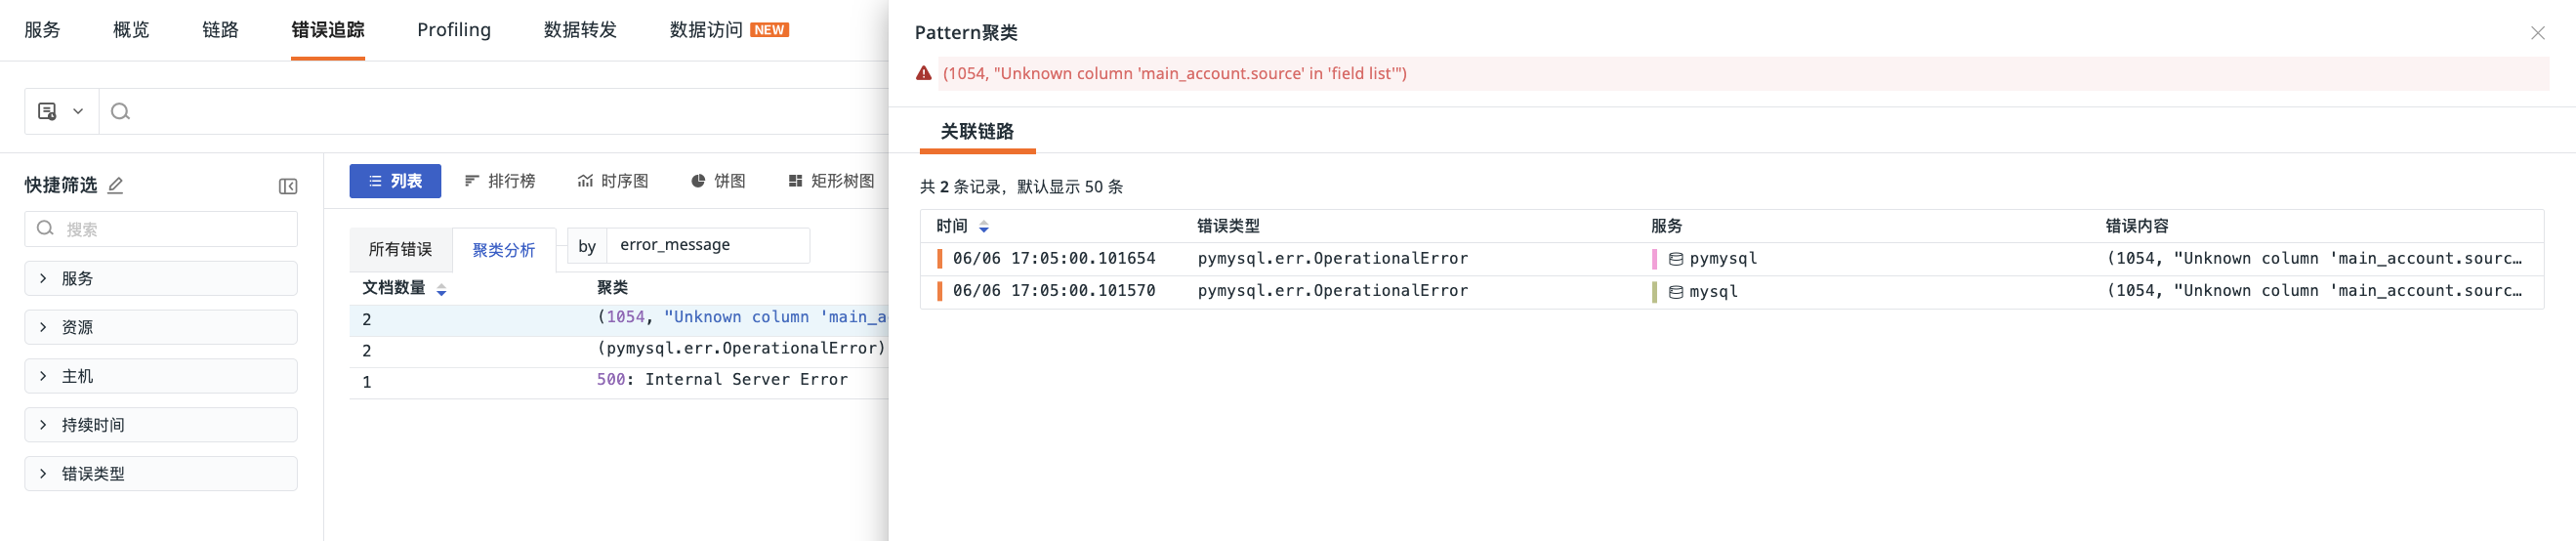
On the related trace page, you can sort the number of documents in ascending/descending order (default descending).
Clicking on a single data point in the related trace allows you to enter the details page. You can perform the following actions:
- View host and service information where the error occurred, error distribution, etc.;
- Click the icon in the upper right corner of the details page to export the current data;
- Perform AI Intelligent Analysis on the current error details;
- Click to jump to the related trace of the current error details.
Charts
Based on count, last, first, count_distinct calculation modes, data is filtered in chart form under by conditions. Includes the following charts, which can be selected as needed:
- Leaderboard
- Time Series Graph
- Pie Chart
- Rectangular Tree Map
- Grouped Table Chart
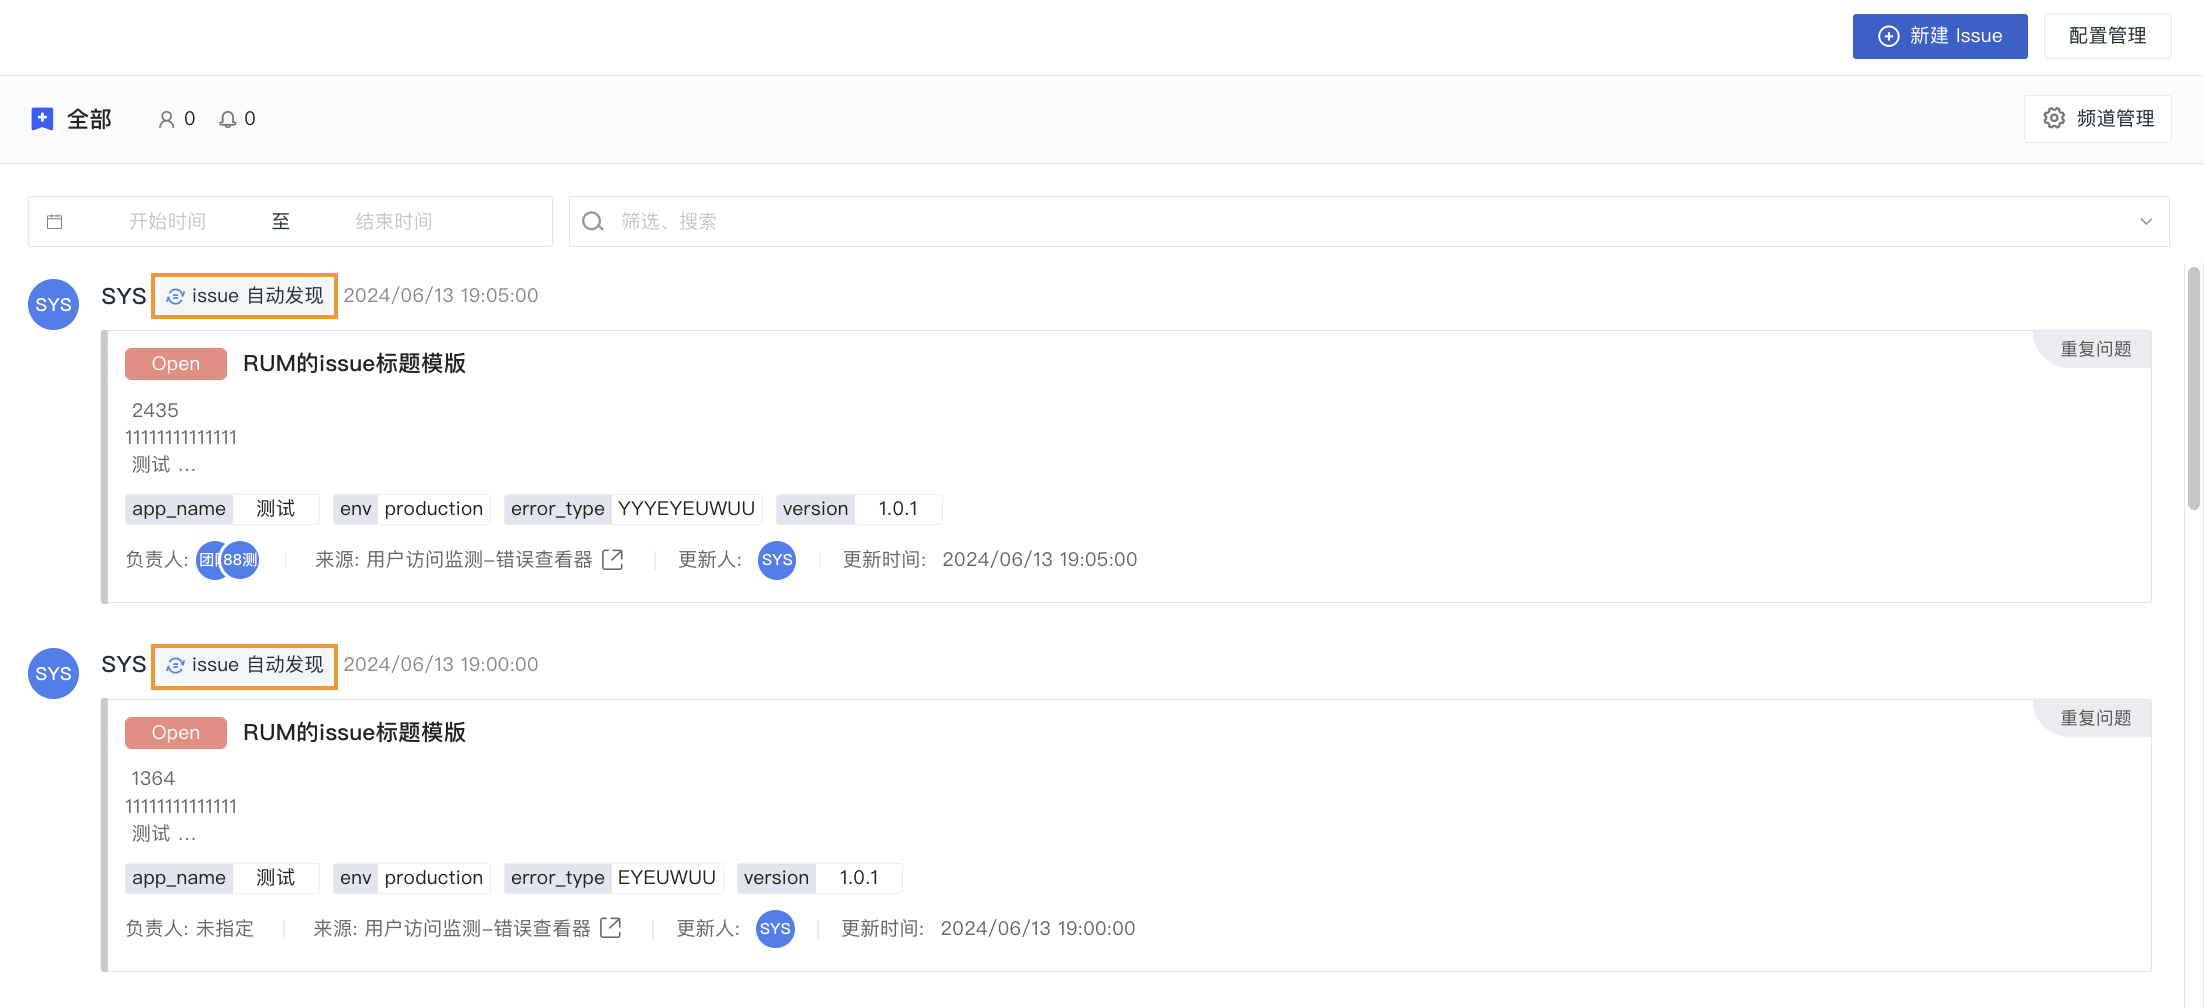
Automatic Issue Discovery
After enabling the "Automatic Issue Discovery" configuration, the system statistically analyzes abnormal data based on different grouping dimensions and performs stack trace tracking and automatic condensation for subsequent similar problems, ultimately generating Issues. Issues generated through this entry will help you quickly obtain the context and root cause of the problem, effectively reducing problem resolution time.
Start Configuration
Note
Before enabling this configuration, you must configure rules first. Otherwise, it cannot be enabled.
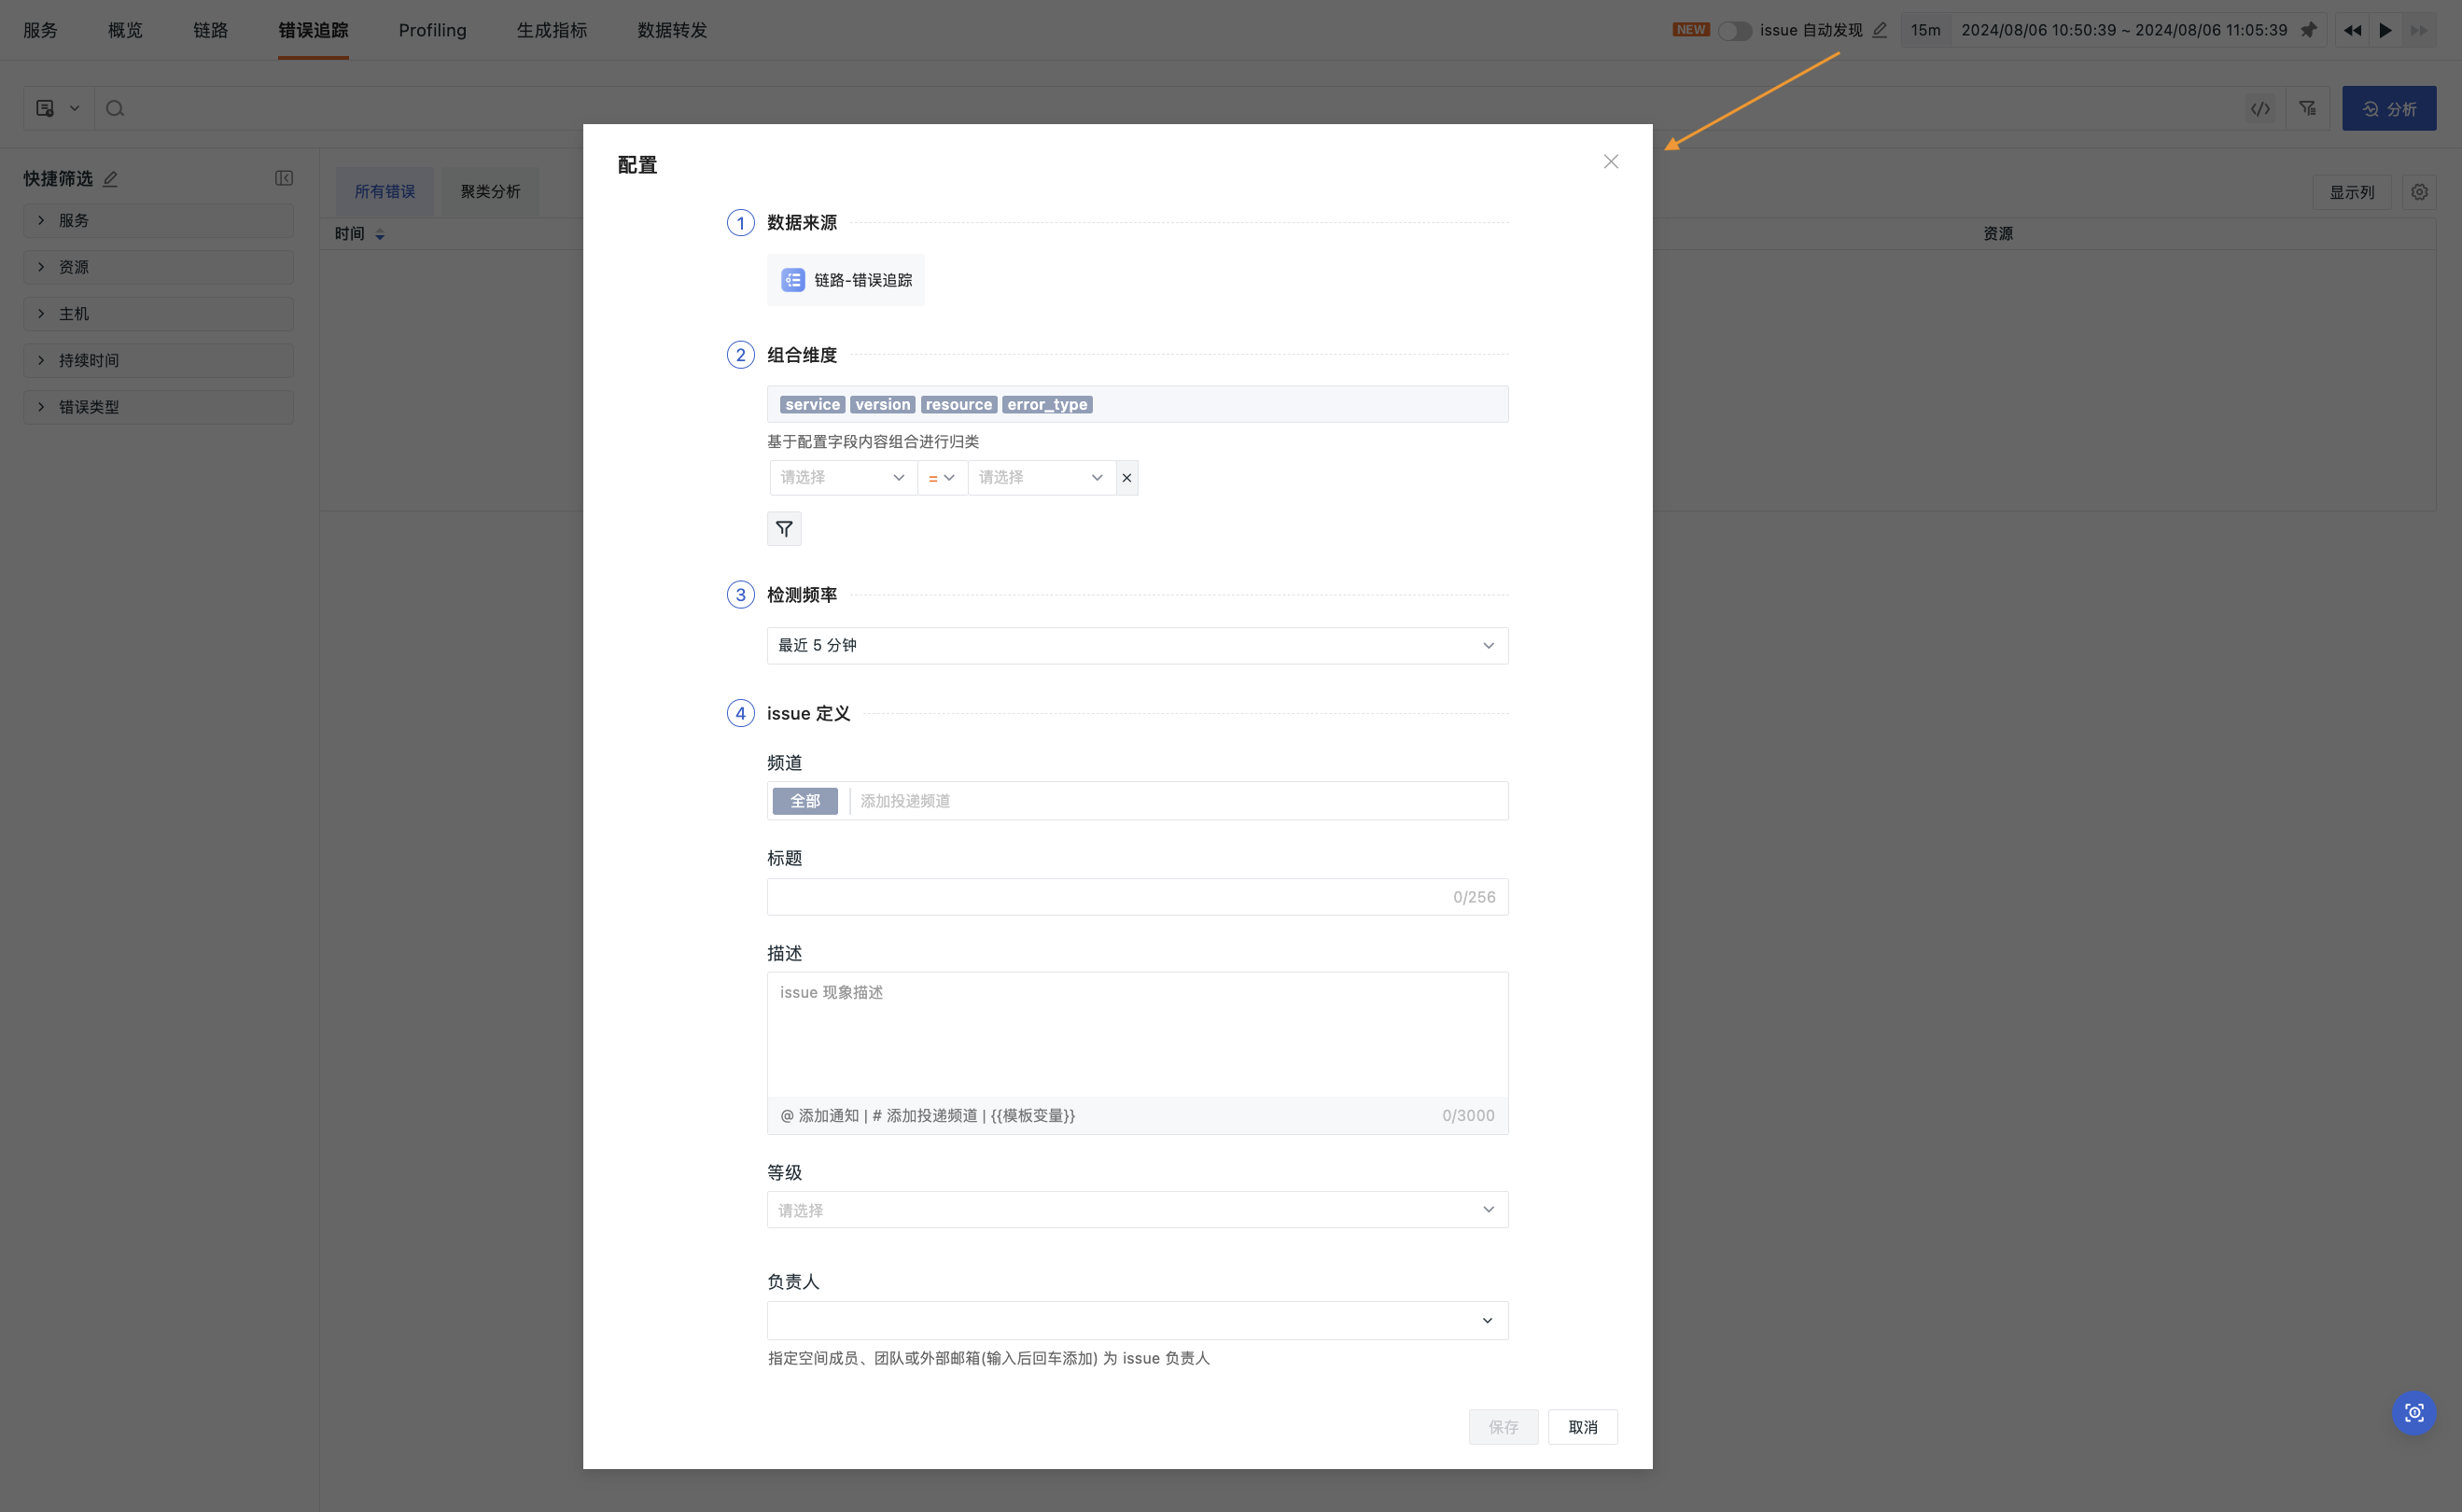
-
Data Source: The activation entry for the current configuration page;
-
Combination Dimensions: Statistical grouping based on configured field contents, including
service,version,resource,error_type;- For data sources, filtering conditions can be added to further query data that meets the criteria, narrowing down the data scope.
-
Detection Frequency: The system determines the time range for querying data based on the selected frequency, options include 5 minutes, 10 minutes, 15 minutes, 30 minutes, and 1 hour;
-
Issue Definition: After enabling this configuration, Issues will be presented according to the definitions here. To prevent missing information, fill in sequentially.
- In both the title and description of the Issue, the following template variables are supported:
Variable Meaning countStatistics count serviceService name versionVersion resourceResource name error_typeError type error_messageError content error_stackError stack
After saving the configuration and enabling it, the Issues automatically discovered and generated by the system will be displayed in the Exception Tracking section.