CAT
Dianping-cat Cat is an open-source distributed real-time monitoring system mainly used to monitor the performance, capacity, and business indicators of the system. It is a monitoring system developed by Meituan Dianping Company and is currently open source and widely used.
Cat collects various indicator data of the system, such as CPU, memory, network, disk, etc., for real-time monitoring and analysis, helping developers quickly locate and solve system problems. At the same time, it also provides some commonly used monitoring functions, such as alarms, statistics, log analysis, etc., to facilitate system monitoring and analysis by developers.
Data Type
Data transmission protocol:
-
Plaintext: Plain text mode, currently not supported by Datakit.
-
Native: Text form separated by specific symbols, currently supported by Datakit.
Data Classification:
| type | long type | doc | Datakit support | Corresponding data type |
|---|---|---|---|---|
| t | transaction start | transaction start | true | trace |
| T | transaction end | transaction end | true | trace |
| E | event | event | false | - |
| M | metric | metric | false | - |
| L | trace | trace | false | - |
| H | heartbeat | heartbeat | true | metric |
CAT start mode
The data is all in the Datakit, and the web page of cat no longer has data, so the significance of starting is not significant.
Moreover, the cat server will also send transaction data to the dk, causing a large amount of garbage data on the observation cloud page. It is not recommended to start a cat_ Home (cat server) service.
The corresponding configuration can be configured in client.xml, please refer to the following text.
Configuration
client config:
<?xml version="1.0" encoding="utf-8"?>
<config mode="client">
    <servers>
        <!-- datakit ip, cat port , http port -->
        <server ip="10.200.6.16" port="2280" http-port="9529"/>
    </servers>
</config>
Note: The 9529 port in the configuration is the HTTP port of the Datakit. 2280 is the 2280 port opened by the cat input.
Datakit config:
Go to the `conf.d/cat` directory under the DataKit installation directory, copy `cat.conf.sample` and name it `cat.conf`. Examples are as follows:

```toml

[[inputs.cat]]
  ## tcp port
  tcp_port = "2280"

  ##native or plaintext, datakit only support native(NT1) !!!
  decode = "native"

  ## This is default cat-client Kvs configs.
  startTransactionTypes = "Cache.;Squirrel."
  MatchTransactionTypes = "SQL"
  block = "false"
  routers = "127.0.0.1:2280;"
  sample = "1.0"

  ## global tags.
  # [inputs.cat.tags]
    # key1 = "value1"
    # key2 = "value2"
    # ...


```
The collector can now be turned on by ConfigMap Injection Collector Configuration.
Notes on configuration files:
startTransactionTypesMatchTransactionTypesblockrouterssampleis the data returned to the client end.routersis Datakit IP or Domain.tcp_portclient configservers ipaddress
Guance Trace and Metric
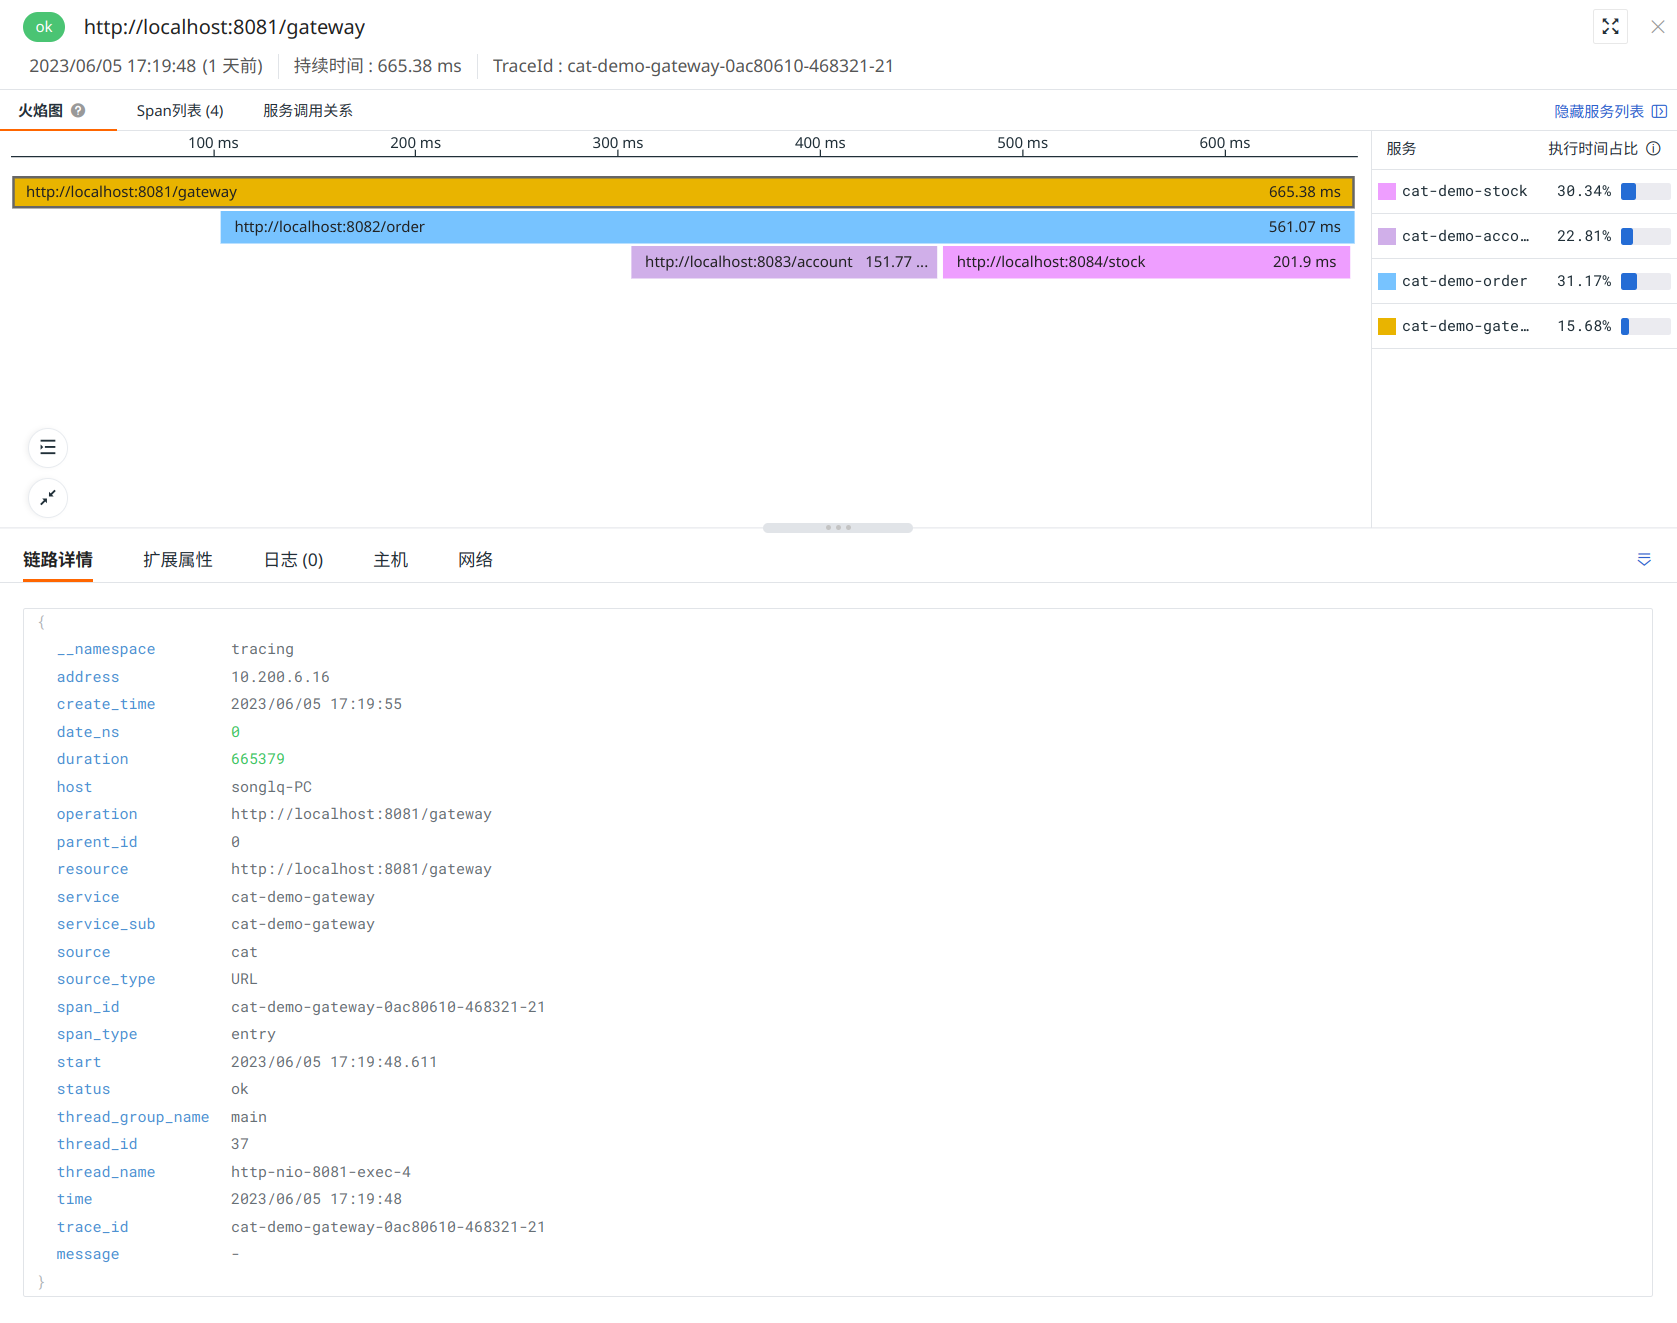
Guance trace
login guance.com, and click on Application Performance.

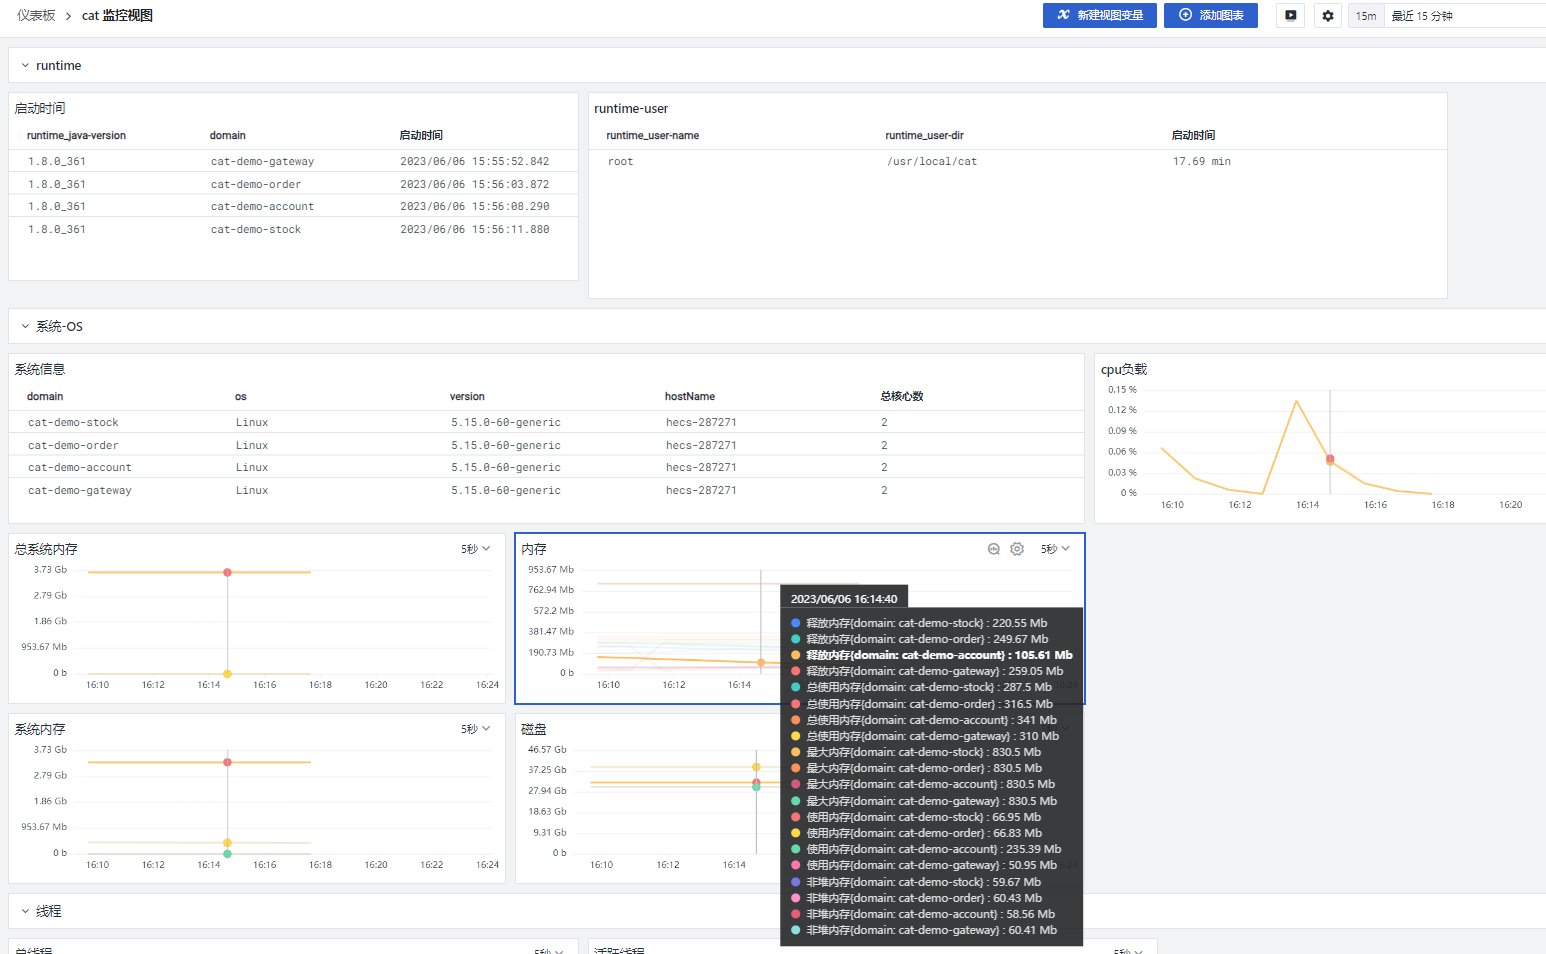
Guance metric
At guance Scenes -> dashboard to Create Dashboard.
Effect display:

Metric
cat
- tag
| Tag | Description |
|---|---|
domain |
IP address. |
hostName |
Host name. |
os_arch |
CPU architecture:AMD/ARM. |
os_name |
OS name:'Windows/Linux/Mac',etc. |
os_version |
The kernel version of the OS. |
runtime_java-version |
Java version. |
runtime_user-dir |
The path of jar. |
runtime_user-name |
User name. |
- fields
| Metric | Description | Type | Unit |
|---|---|---|---|
disk_free |
Free disk size. | float | B |
disk_total |
Total disk size of data nodes. | float | B |
disk_usable |
Used disk size. | float | B |
memory_free |
Free memory size. | float | count |
memory_heap-usage |
The usage of heap memory. | float | count |
memory_max |
Max memory usage. | float | count |
memory_non-heap-usage |
The usage of non heap memory. | float | count |
memory_total |
Total memory size. | float | count |
os_available-processors |
The number of available processors in the host. | float | count |
os_committed-virtual-memory |
Committed virtual memory size. | float | B |
os_free-physical-memory |
Free physical memory size. | float | B |
os_free-swap-space |
Free swap space size | float | B |
os_system-load-average |
Average system load. | float | percent |
os_total-physical-memory |
Total physical memory size. | float | B |
os_total-swap-space |
Total swap space size. | float | B |
runtime_start-time |
Start time. | int | s |
runtime_up-time |
Runtime. | int | ms |
thread_cat_thread_count |
The number of threads used by cat. | float | count |
thread_count |
Total number of threads. | float | count |
thread_daemon_count |
The number of daemon threads. | float | count |
thread_http_thread_count |
The number of http threads. | float | count |
thread_peek_count |
Thread peek. | float | count |
thread_pigeon_thread_count |
The number of pigeon threads. | float | count |
thread_total_started_count |
Total number of started threads. | float | count |
``
- tag
| Tag | Description |
|---|---|
container_host |
Container hostname. Available in OpenTelemetry. Optional. |
endpoint |
Endpoint info. Available in SkyWalking, Zipkin. Optional. |
env |
Application environment info. Available in Jaeger. Optional. |
host |
Hostname. |
http_method |
HTTP request method name. Available in DDTrace, OpenTelemetry. Optional. |
http_route |
HTTP route. Optional. |
http_status_code |
HTTP response code. Available in DDTrace, OpenTelemetry. Optional. |
http_url |
HTTP URL. Optional. |
operation |
Span name |
project |
Project name. Available in Jaeger. Optional. |
service |
Service name. Optional. |
source_type |
Tracing source type |
span_type |
Span type |
status |
Span status |
version |
Application version info. Available in Jaeger. Optional. |
- fields
| Metric | Description | Type | Unit |
|---|---|---|---|
duration |
Duration of span | int | μs |
message |
Origin content of span | string | - |
parent_id |
Parent span ID of current span | string | - |
resource |
Resource name produce current span | string | - |
span_id |
Span id | string | - |
start |
start time of span. | int | usec |
trace_id |
Trace id | string | - |