Profiling
Profiling continuously samples and collects data on the runtime status of applications in areas such as CPU, memory, and I/O, automatically obtaining performance profiling data. The collected data is visualized in real-time through flame graphs, clearly displaying the call stack relationships and resource consumption ratios between each method, class, and thread. This helps developers identify hotspot functions and efficiency bottlenecks, providing data support for code-level performance optimization.
In the Profiling explorer, you can:
-
Analyze runtime dynamic performance data of applications in different languages such as Java, Python, Go, C/C++ based on flame graphs, intuitively locating performance issues caused by inefficient algorithms, memory leaks, or improper I/O operations.
-
By associating with traces, obtain the code execution segments corresponding to specific business requests (Spans), achieving end-to-end performance tracking from business interfaces to specific methods, and precisely identifying optimization directions.
Prerequisites
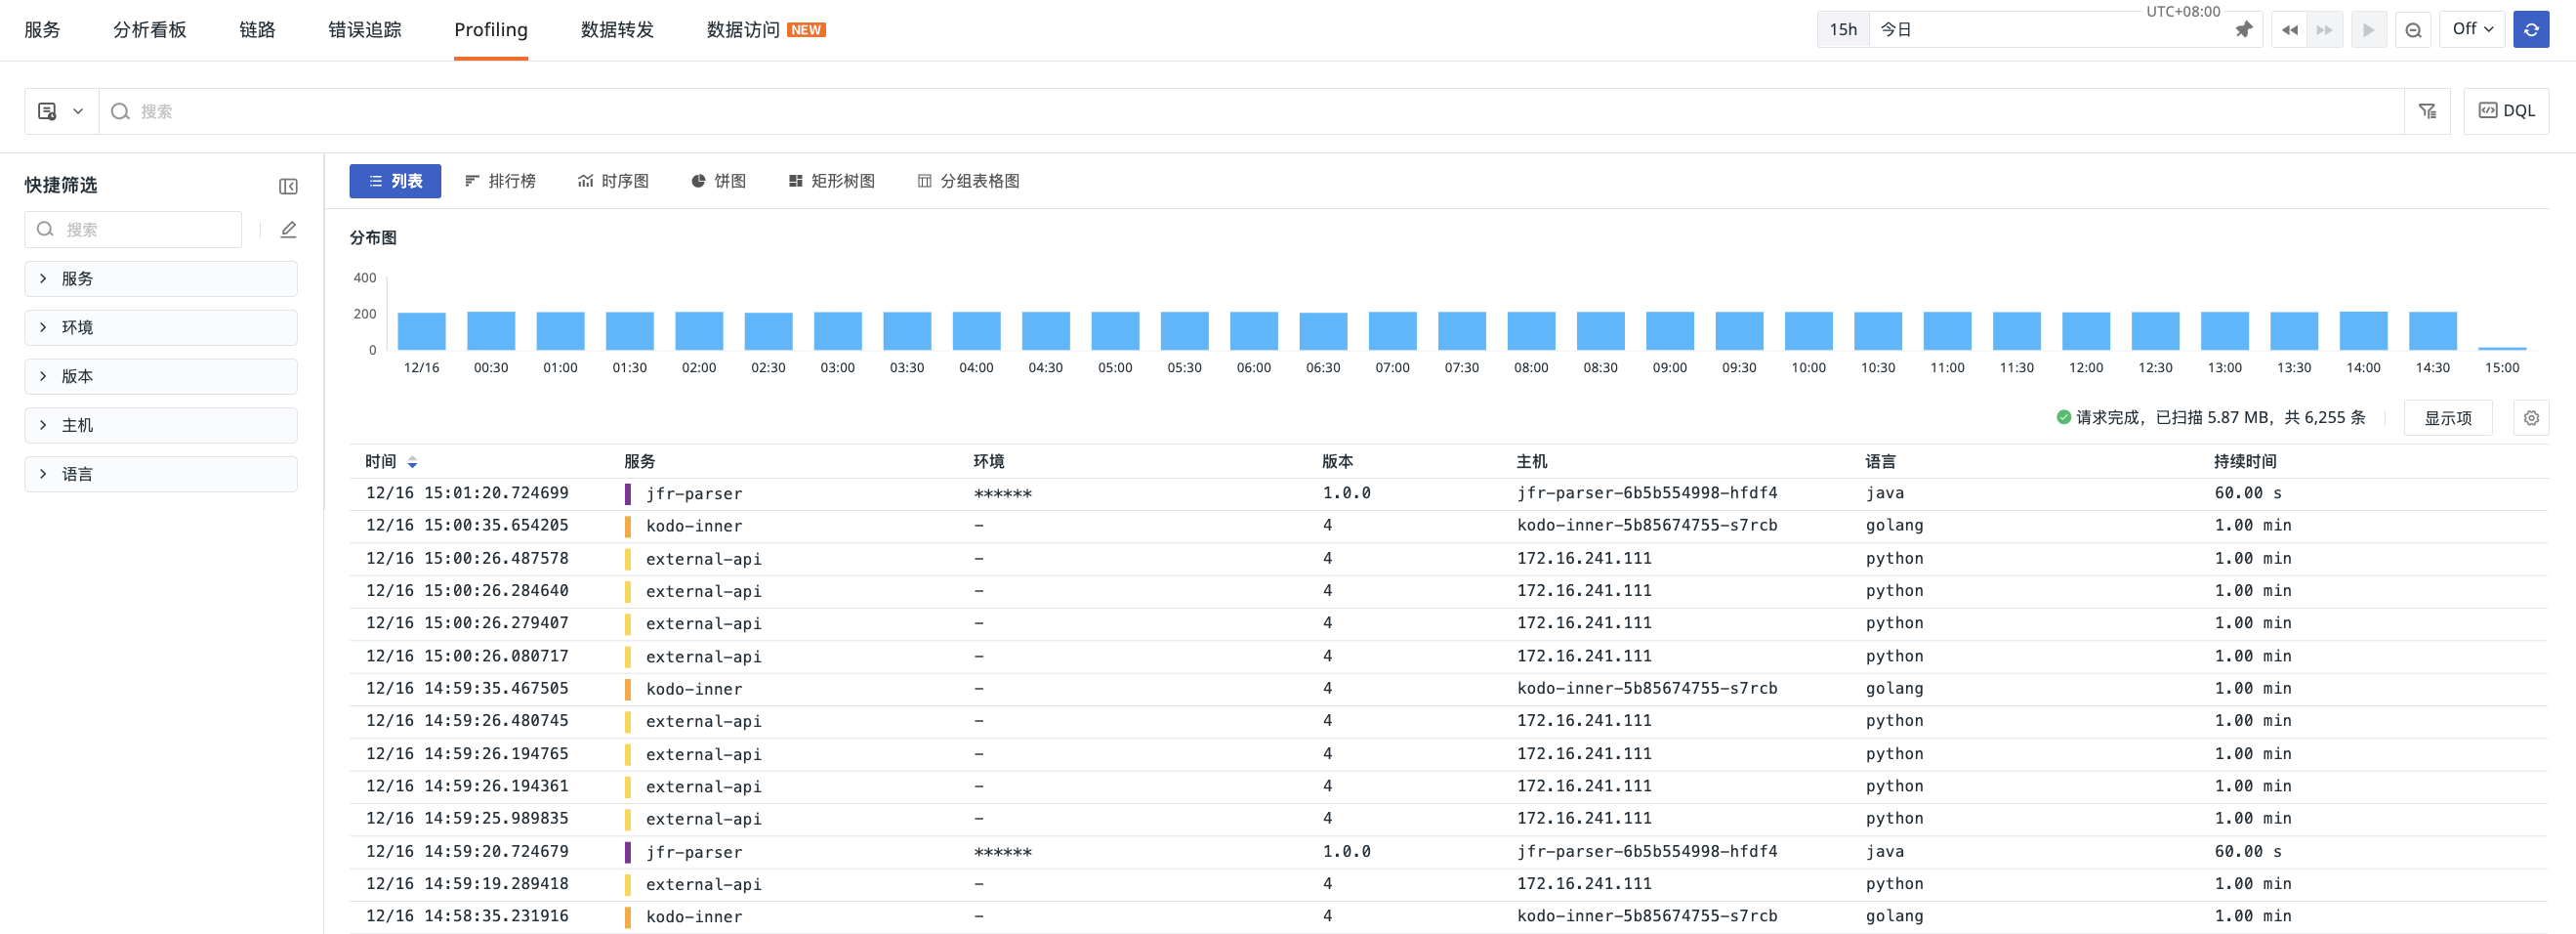
After Profiling data is reported, you can query and analyze it through the explorer, supporting operations such as search filtering, quick filtering, column customization, and data export.
Note
Profiling data is retained for 7 days by default.
Profiling Details Page
Performance
On the details page, you automatically enter the "Performance" tab, which includes attribute tags, performance flame graphs, and runtime information.
If the current Profile file size exceeds 20MB, the system does not support online parsing. You can download the file locally and use professional analysis tools to view it. For example:
Flame Graph
The core of Profiling is using flame graphs for code-level performance profiling. Flame graphs visually display the execution time or resource consumption distribution of methods within the call stack. The system also provides aggregated data analysis views based on multiple dimensions such as methods, libraries, and threads, directly listing the hotspot methods with the highest execution proportion, helping to quickly focus on core performance issues.
The analysis capability supports multiple programming languages. The observable metric dimensions vary for different languages. For example:
| Category | Description |
|---|---|
| CPU Time | The runtime of each method on the CPU |
| Wall Time | The elapsed time of each method, including time running on the CPU, time waiting for I/O, and time spent on anything else that happens during the function's runtime |
| Heap Live Size | The amount of heap memory still in use |
| Allocated Memory | The amount of heap memory allocated by each method, including allocations that were later freed |
| Allocations | The number of heap allocations performed by each method, including allocations that were later freed |
| Thrown Exceptions | The number of exceptions thrown by each method |
| Lock Wait Time | The time each function spends waiting for a lock |
| Locked Time | The time each function holds a lock |
| Lock Acquires | The number of times each method acquires a lock |
| Lock Releases | The number of times each method releases a lock |
| Category | Description |
|---|---|
| CPU Time | The runtime of each method on the CPU, including time spent on Java bytecode and runtime operations of the service, excluding time spent on native code called through the JVM |
| Wall Time in Native Code | The number of samples in native code. Sampling may occur when code is running on the CPU, waiting for I/O, and any other situations that happen during method runtime. This excludes Java bytecode calls involved when running application code |
| Allocations | The number of heap allocations performed by each method, including allocations that were later freed |
| Allocated Memory | The amount of heap memory allocated by each method, including allocations that were later freed |
| Heap Live Objects | The number of live objects allocated to each method |
| Thrown Exceptions | The number of exceptions thrown by each method |
| Lock Wait Time | The time each method spends waiting for a lock |
| Lock Acquires | The number of times each method acquires a lock |
| File I/O Time | The time each method spends on file reading and writing |
| File I/O Written | Statistics on the amount of data written to files by each method |
| File I/O Read | Statistics on the amount of data read from files by each method |
| Socket I/O Read Time | The time each method spends reading from sockets |
| Socket I/O Write Time | The time each method spends writing to sockets |
| Socket I/O Read | Statistics on the amount of data read from sockets by each method |
| Socket I/O Written | Statistics on the amount of data written to sockets by each method |
| Synchronization | The time each method spends on synchronization |
Quick Operations
- Search: In the Type selection box, enter method name keywords for fuzzy search. Directly select from the matching results to quickly locate and focus on viewing specific methods.
- Copy: Under Dimension, hover to copy and view method details.
- Click to select: The Dimension list displays all methods by default. Click on any method, and the flame graph will focus on displaying the call path of that method. Multiple selections are supported to compare the execution of multiple methods. Click the selected method again to deselect it and restore the panoramic view.
Runtime Information
On the Runtime Information tab, you can view the associated fields and tag attributes of the corresponding programming language runtime, including process parameters, environment variables, and system tags. You can add any tag as a filter condition to the explorer list panel to quickly filter related data. You can also directly copy the tag content for use in associated queries in logs or traces.
Trace Association Profiling
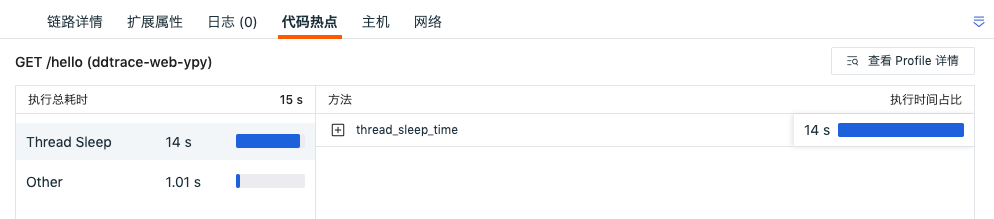
When APM tracing and Profiling collection are both enabled for an application, the system supports associating performance profiling data at the trace level. In the Trace Details Page of APM, select any Span on the flame graph to view the list of associated code method calls and their Wall Time consumption proportion during the execution period of that business request.
This enables penetration analysis from a slow business request directly to specific time-consuming methods. It also supports one-click navigation to the complete Profiling details page to view more comprehensive performance profiling data (such as CPU, memory dimensions) during that time period for in-depth root cause investigation.
Click View Profiling Details to jump to the corresponding Profiling details page to view specific performance data.