Unresolved Events
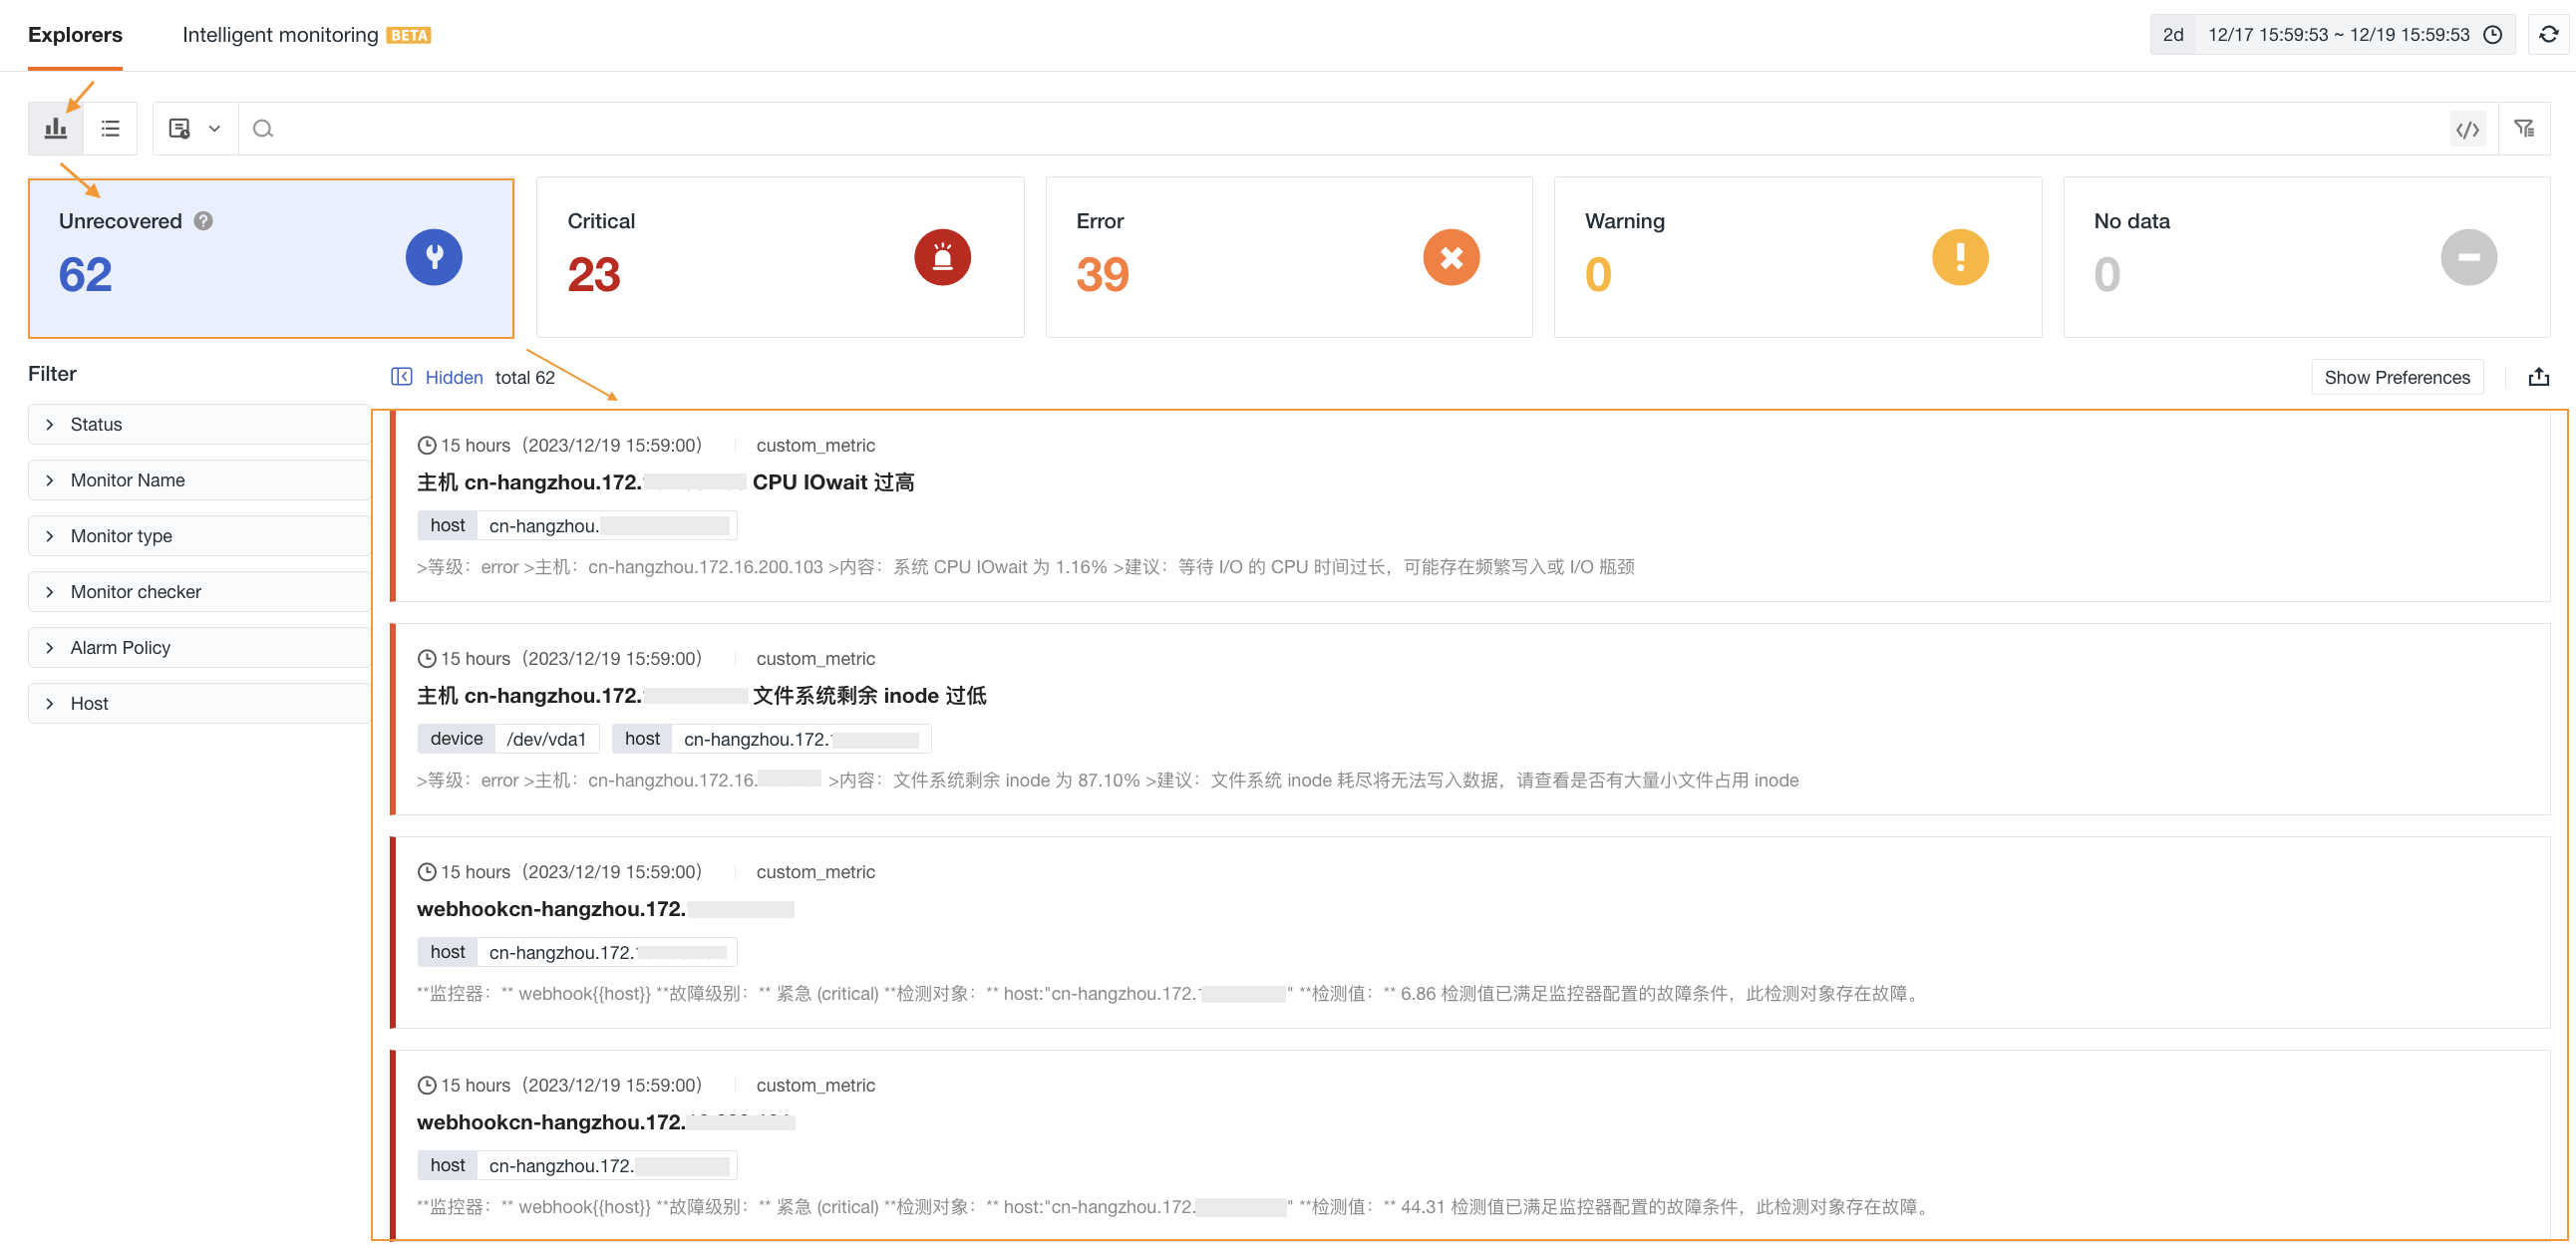
The Explorer aggregates all event records at the alert level within the current workspace, helping users fully understand the context of alert events, accelerating their understanding and awareness of events. It also effectively reduces alert fatigue through associations with monitors and alert strategies.
The data source for unresolved events aggregates event data using df_fault_id as a unique identifier and displays the most recent results. You can use this visualization tool to intuitively understand a series of key data points from event levels to trigger threshold baselines, including event levels, duration, alert notifications, monitors, event content, and historical trigger trend charts. Together, these pieces of information form a comprehensive view that helps you analyze and understand events from different angles, enabling you to make more informed response decisions.
Event Cards
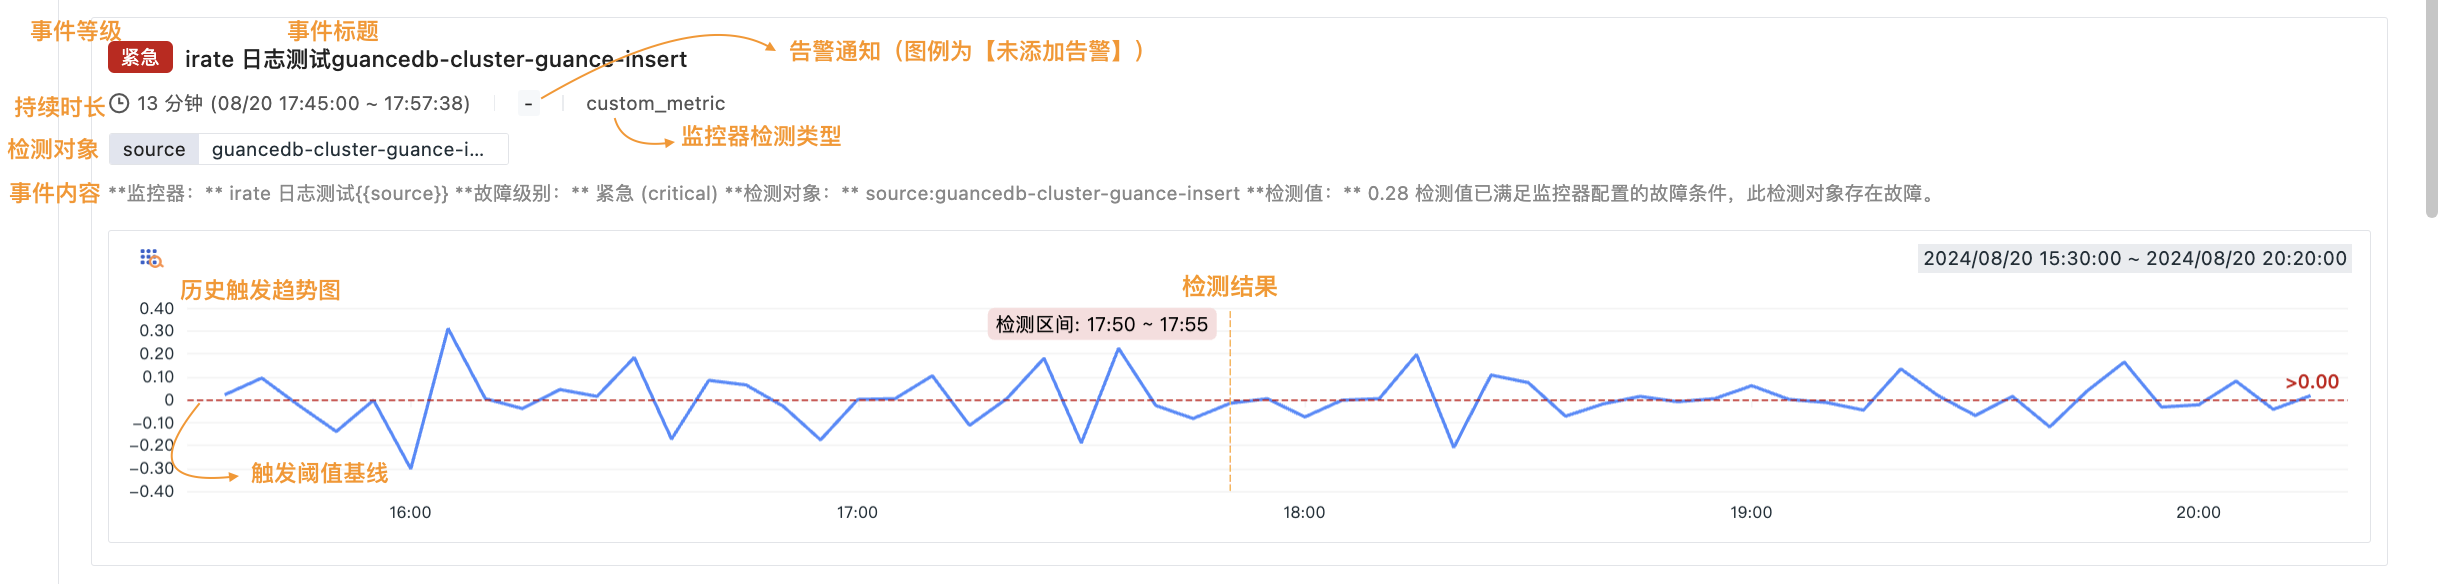
Event Level
Based on the configuration of trigger conditions in monitors, status statistics are generated for Unresolved (df_status != ok), Critical, Major, Warning, and Data Gap states.
In the unresolved event Explorer, the level of each event is defined as the level of the last triggered event for that detection object.
For more details, refer to Event Level Description.
Event Title
The event title displayed in the unresolved event Explorer directly comes from the title set when configuring monitor rules. It represents the title used for the last triggered event for that detection object.
Duration
This indicates the time from the first trigger of an anomaly event for the current detection object until the end time of the current Time Widget, such as 5 minutes (08/20 17:53:00 ~ 17:57:38).
Alert Notifications
This shows the notification status of the last triggered event for the current detection object. It mainly includes the following three states:
- Mute: Indicates that the current event is affected by mute rules but no external alert notifications were sent;
- Identifiers for Notification Targets: Including DingTalk bots, WeCom bots, Lark bots, etc.;
-: No external alert notifications were triggered.
Monitor Detection Type
This refers to the type of monitor.
Detection Object
If by group queries are used in the detection metrics when configuring monitor rules, the event card will display filter conditions, such as source:kodo-servicemap.
Event Content
This shows the content of the last triggered event for the current detection object, sourced from the preset content when configuring monitor rules. It represents the content of the last triggered event for that detection object.
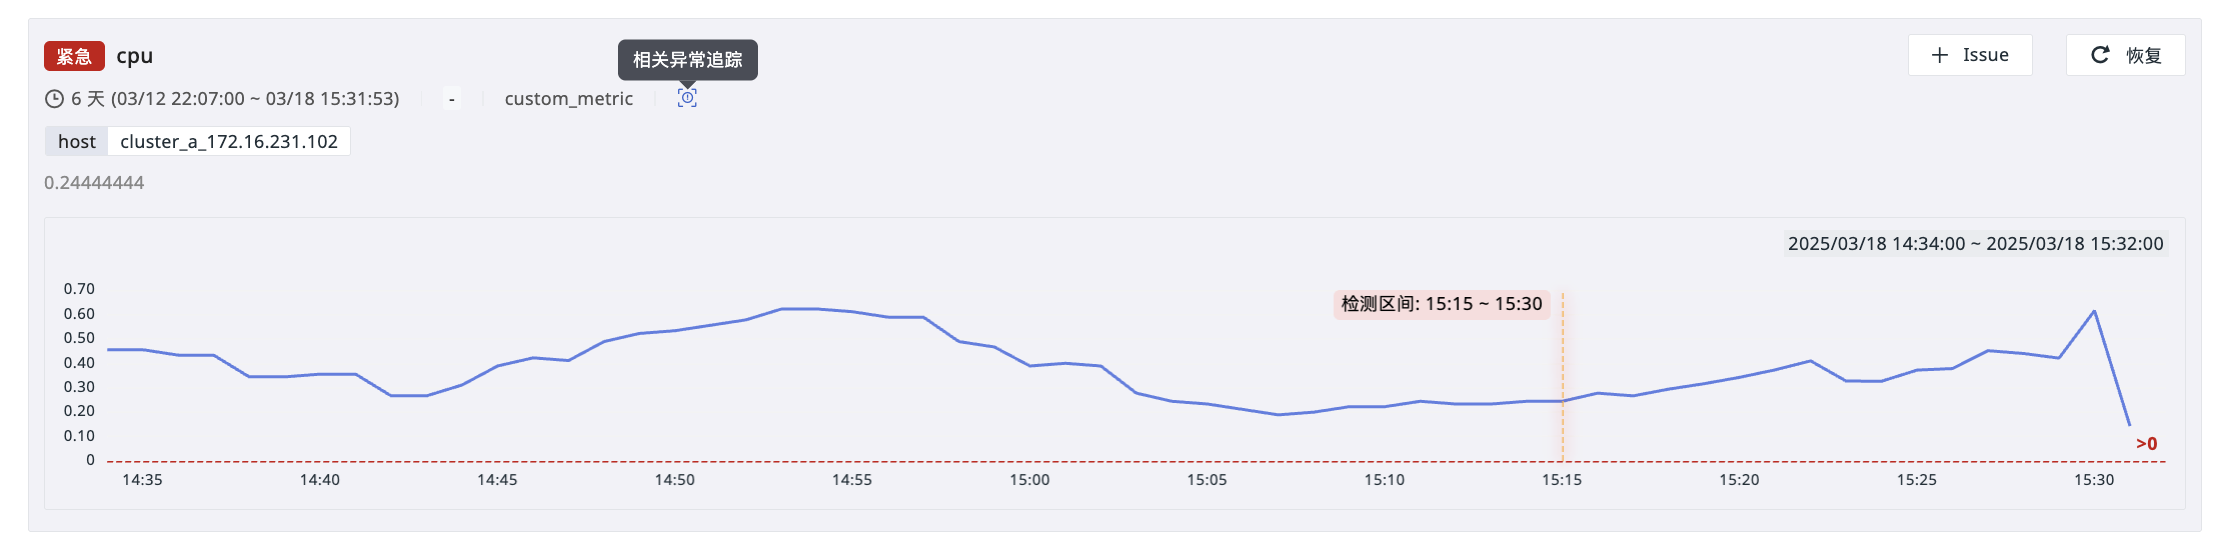
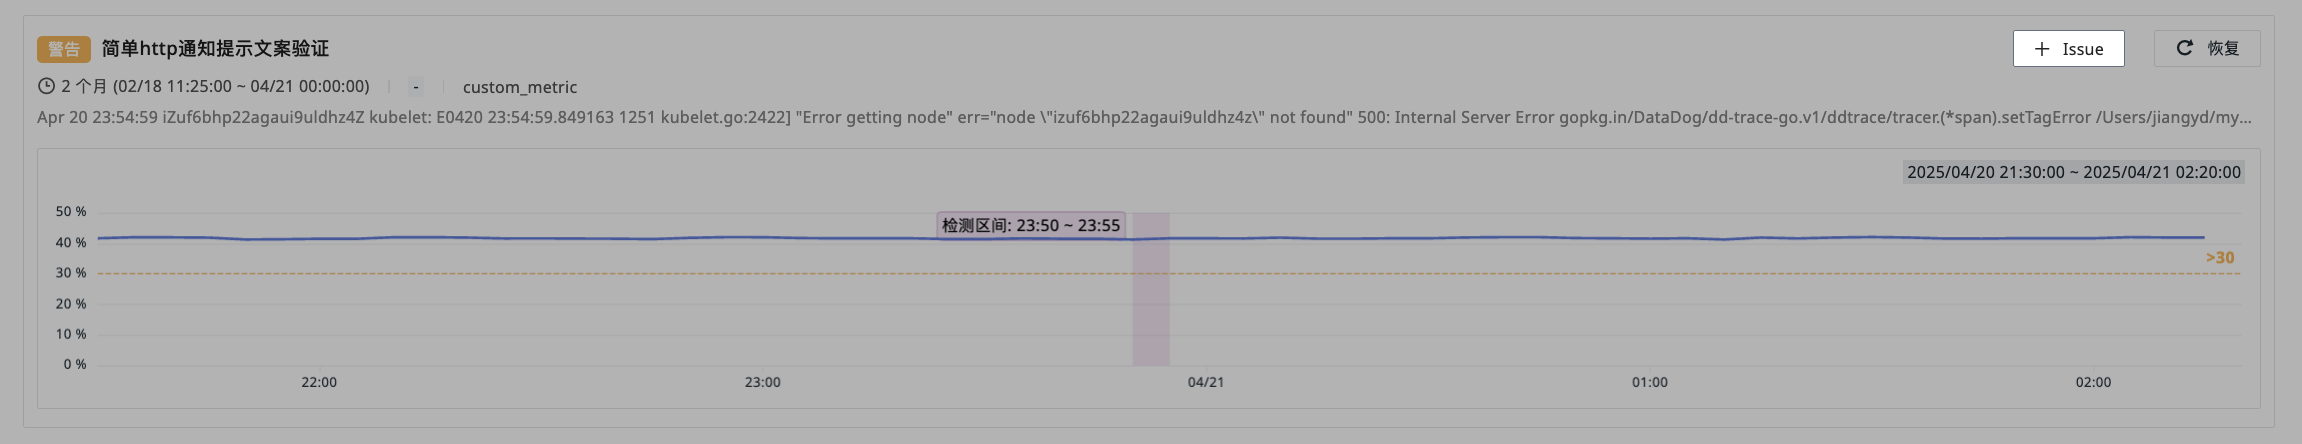
Historical Trigger Trend Chart
This trend is displayed using Window functions, showing the historical trend of 60 actual detections based on the detection results.
The historical anomaly trend of the current unresolved event is displayed based on the detection results, with the trigger threshold value configured in the monitor detection rule set as a clear reference line. The system specially marks the detection result of the last triggered event for the current detection object, and through the vertical line in the trend chart, you can quickly locate the exact time point when the event was triggered. Additionally, the corresponding detection interval for this detection result is also displayed, providing you with an intuitive analysis tool to evaluate the development process and impact of the event.
Management Cards
Display Items
The unresolved events list supports the following display styles:
- Standard: Displays event titles, detection dimensions, and event content.
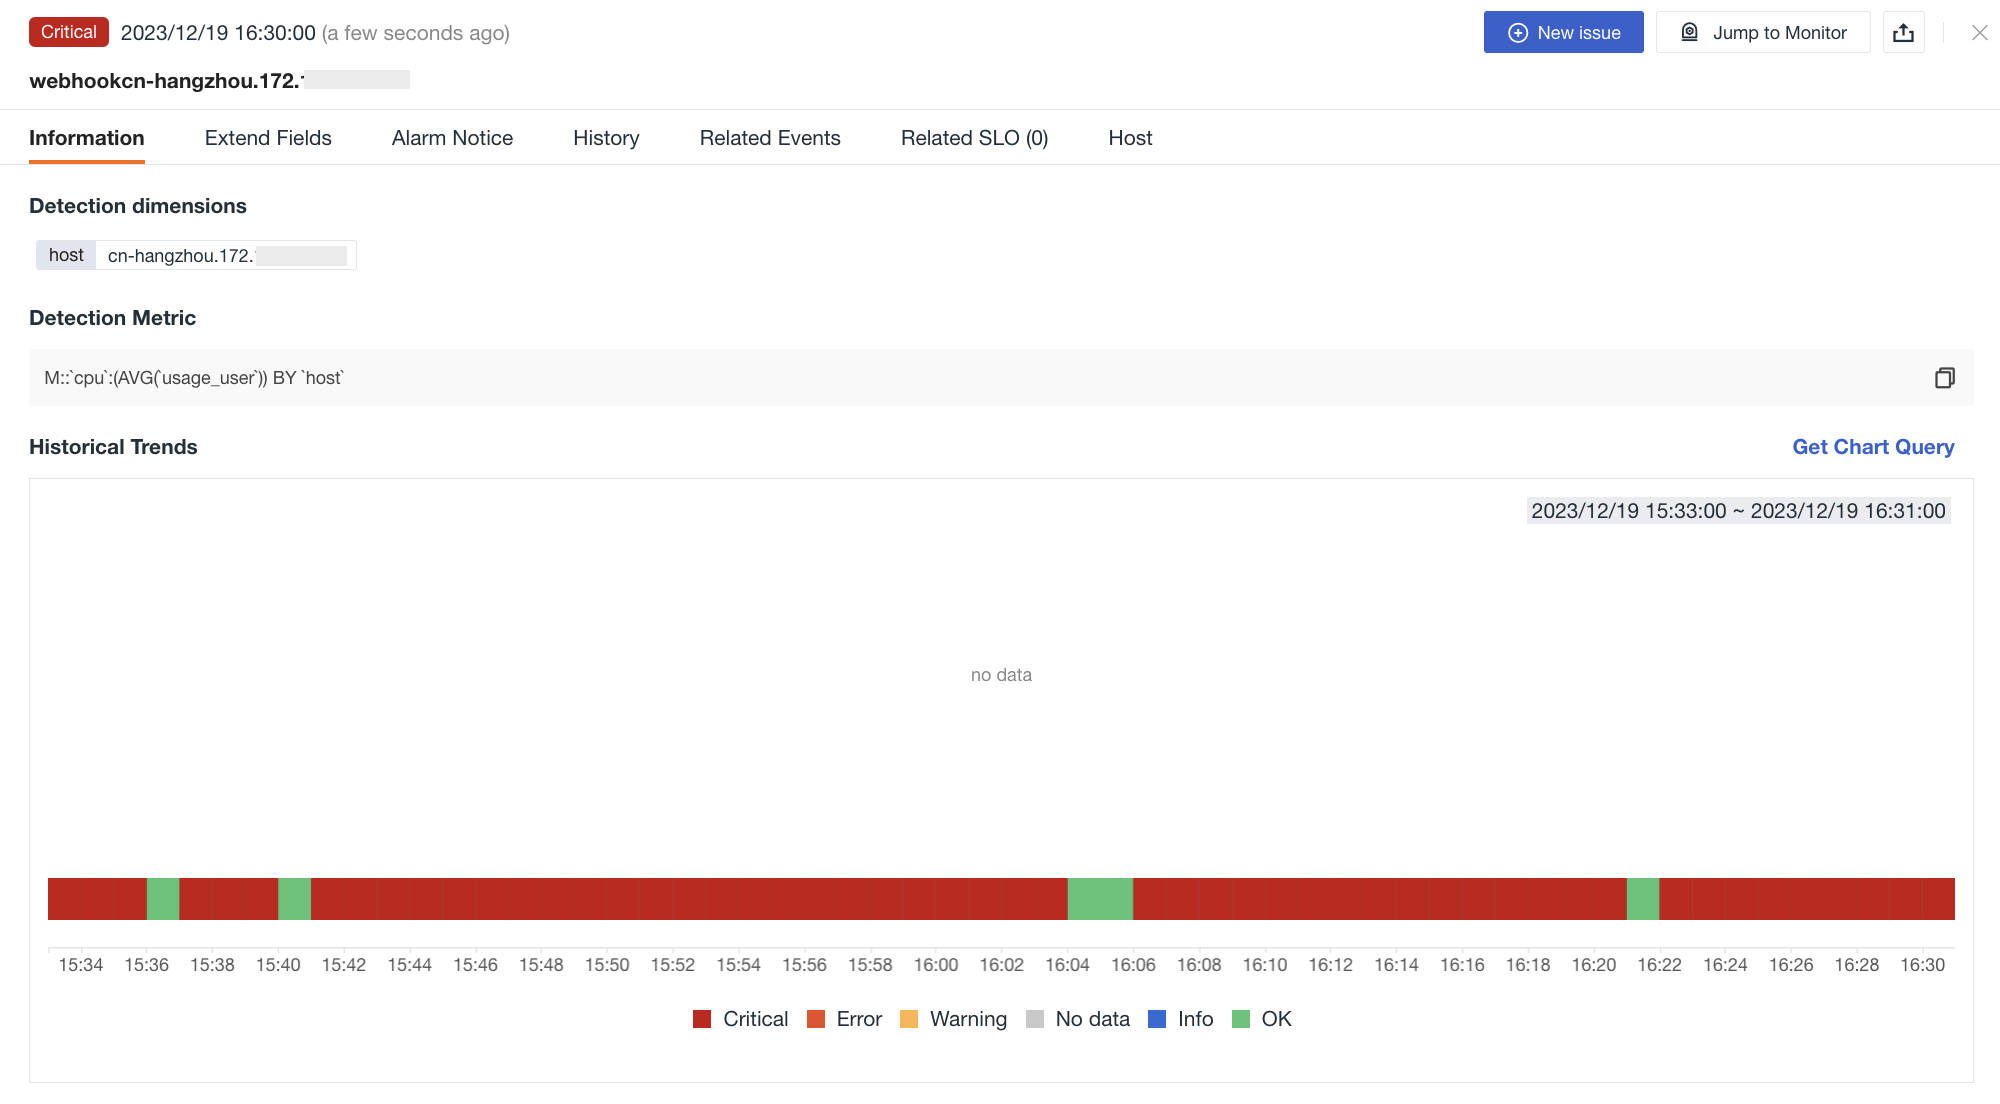
- Extended: In addition to standard information, it also displays the historical trend of detection results for unresolved events history trend.
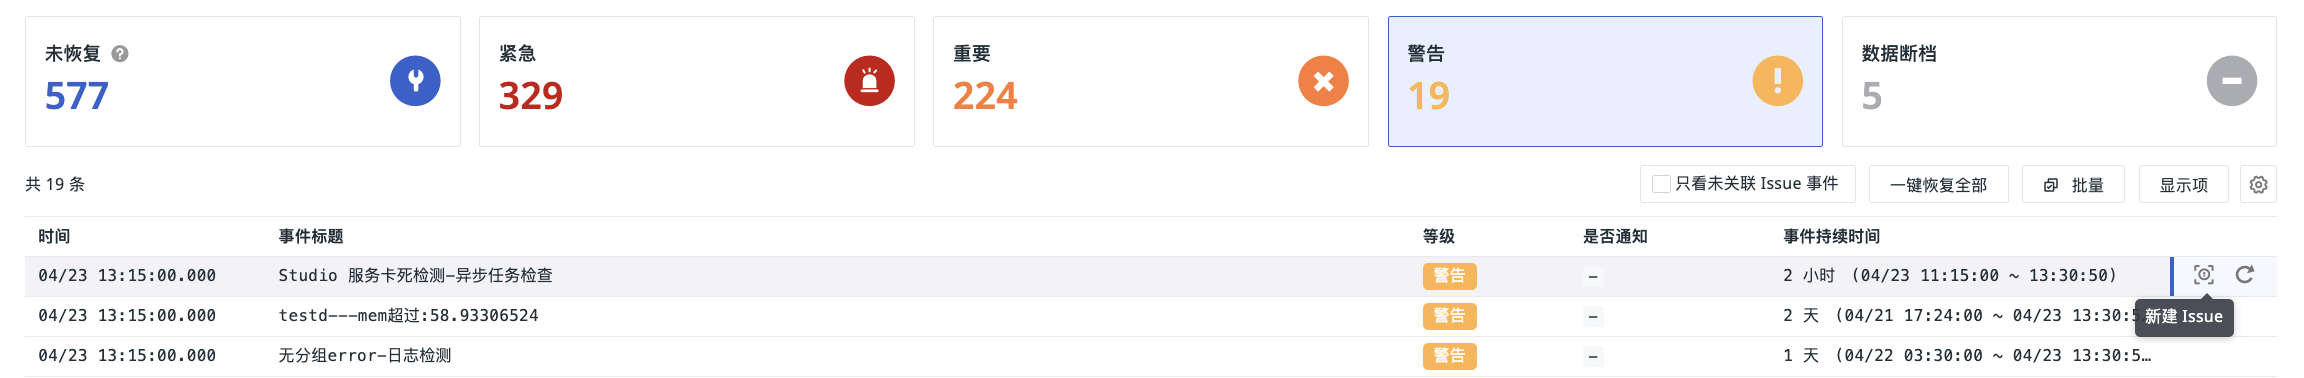
- List: Displays event data in list format.
Show Only Issue-Linked Events
By checking this option, you can quickly filter out all events linked to Issues in the current event list.
For events with existing associations, clicking the icon on the right side of the event data allows you to directly jump to view:
Issue & Create Issue
Create an Issue for unresolved events to notify relevant members to handle it promptly.
- List mode:
- Standard/Extended mode:
- Event Details:
Resolve Event
An event with a status of normal (df_sub_status = ok) is considered a resolved event. Recovery rules can be set in Monitors, or events can be manually resolved.
Resolved events fall into four types:
Name |
df_status |
Description |
|---|---|---|
| Resolved | ok | Previously detected "Critical", "Major", "Warning" anomalies that did not re-trigger within N checks are considered resolved. |
| Data Gap Recovery | ok | After data reporting stops and resumes, it is judged as resolved. |
| Data Gap Considered Resolved | ok | A data gap in the detection data is considered a normal state. |
| Manual Resolution | ok | Users manually click to resolve, supporting single/batch resolution. |