Custom Tracing
Introduction
Guance allows you to create tracing tasks through Real User Monitoring (RUM) to monitor custom trace trajectories in real time. By predefining trace trajectories, you can centrally filter trace data, precisely query user experience, and promptly detect vulnerabilities, anomalies, and risks.
Application Support
The tracing feature currently supports Web, Android, and iOS applications.
Creating a Trace
In the Real User Monitoring (RUM) module of the Guance workspace, click the Application Name to enter the target application, then use Trace to create a new trace trajectory.
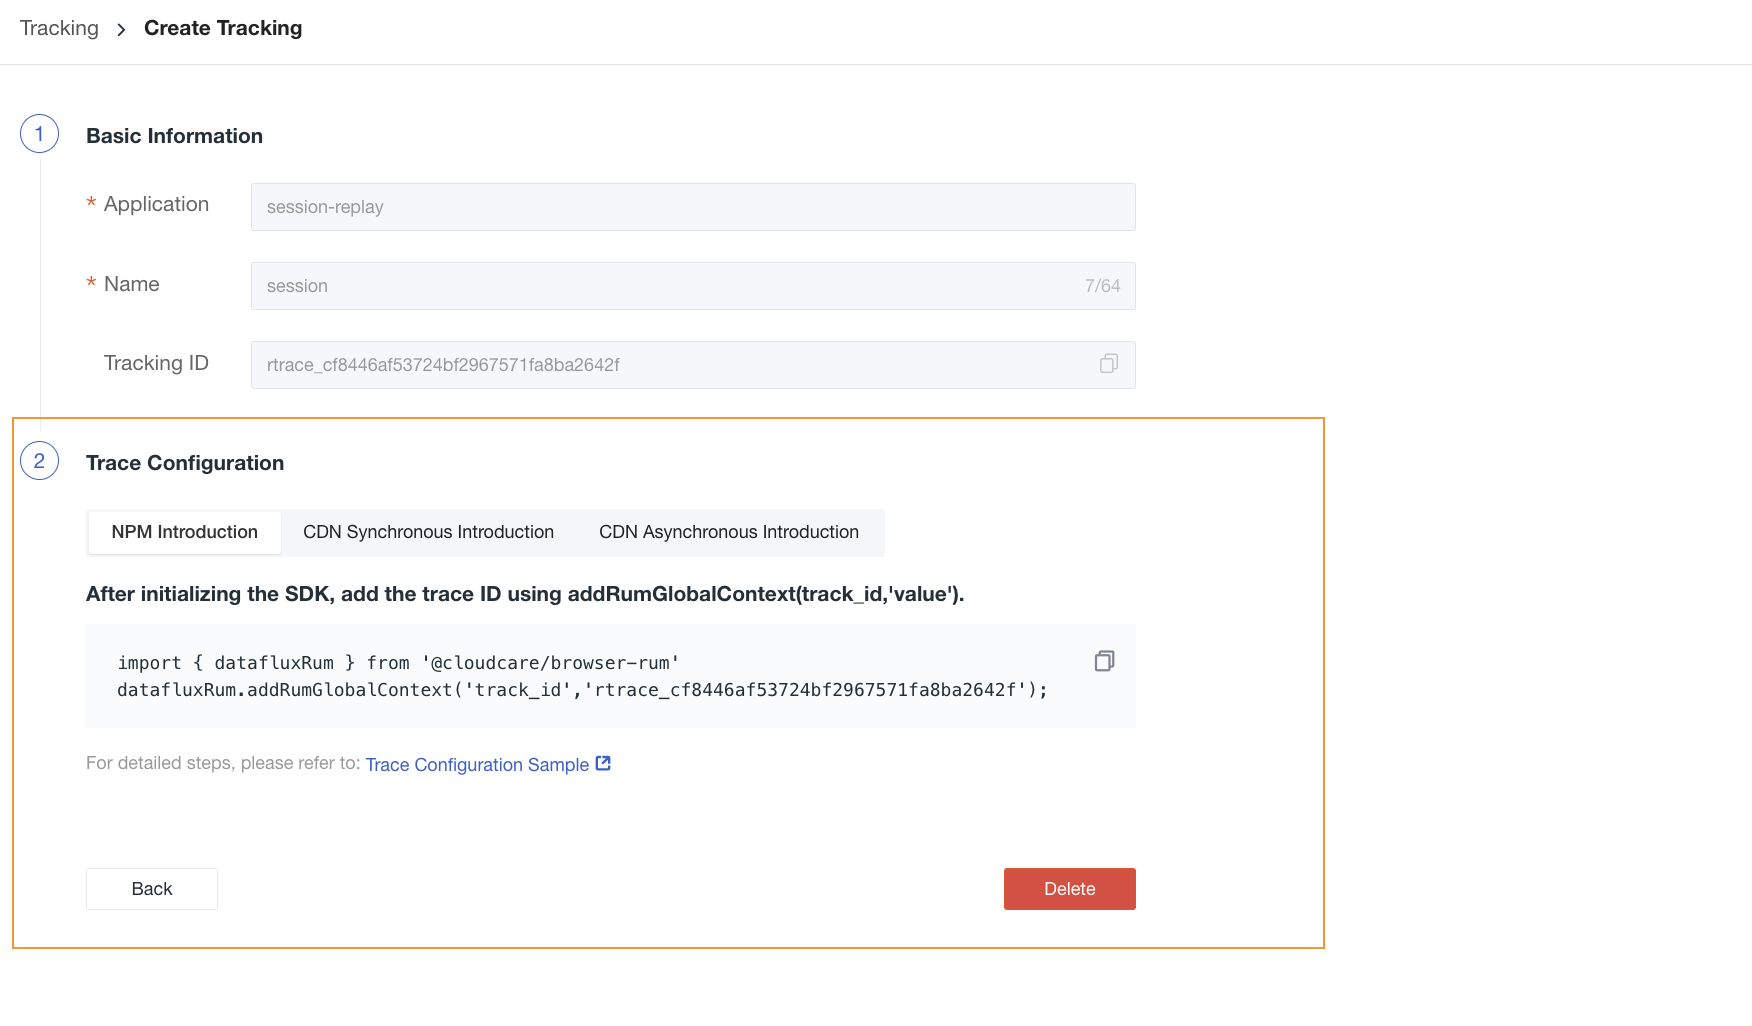
When creating a trace, you need to specify a name and tags. After the trace ID is generated, complete the integration configuration.
| Field | Description |
|---|---|
| Trace Name | The name of the current tracing task. Supports mixed Chinese and English characters, underscores as separators, but no other special characters. Maximum length: 64 characters. |
| Tags | Define the trace fields. You can select tags (key:value) under the current application (app_id) from the dropdown list. Multiple selections are allowed. |
| Trace ID | A unique trace ID generated by the system. You can copy it with one click. |
| Integration | After the trace ID is generated, you need to introduce code into the application based on the trace ID information. |
Managing Tracing Tasks
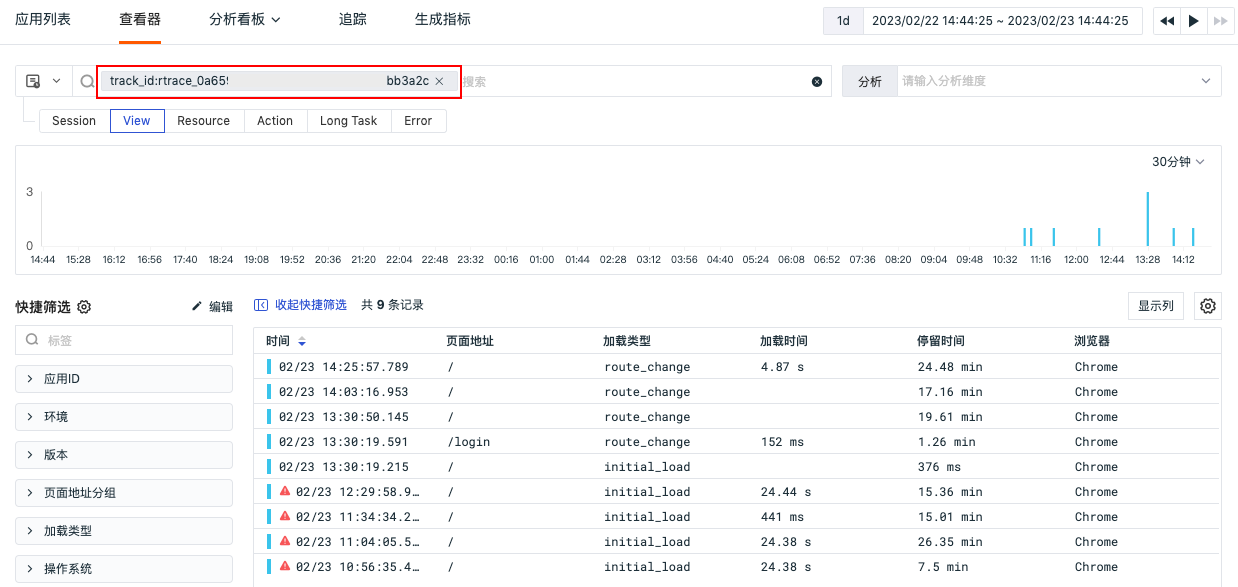
After creating a tracing task, it is started by default. You can view performance data under the specified trace ID in the current application's Session Explorer. You can also click the trace name to view the data generated by that trace. Additionally, you can view or delete tracing tasks.
Automated Tracing
Guance supports automated tracing via a browser extension, allowing you to record user browsing behavior and create no-code end-to-end tests.
Step-by-Step Instructions
Step 1: Download the Browser Extension
-
If you have already integrated a Web application, you can directly install the extension by downloading the browser extension.
-
If you have not started using Guance yet, complete the following steps first:
- Install DataKit;
- Enable the RUM collector;
- Integrate a Web application.
Step 2: Install the Extension
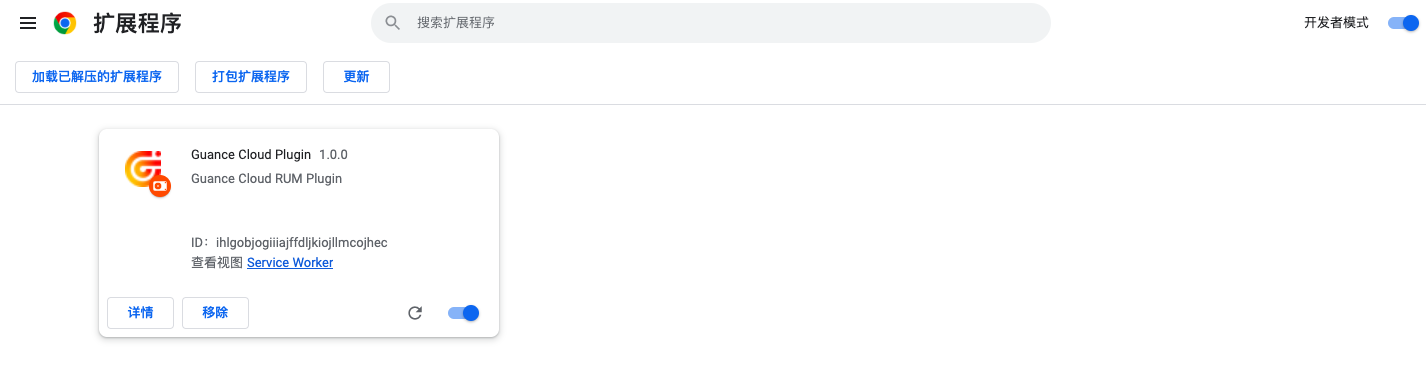
- After downloading the extension, navigate to
chrome://extensions/in your browser.
Note: Automated tracing currently supports Chrome and Edge browsers.
-
Enable Developer mode.
-
Unzip the downloaded browser extension rum-plugin.zip.
-
Click Load unpacked.
-
Select the unzipped folder.
Step 3: Use the Extension
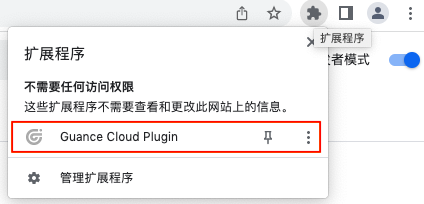
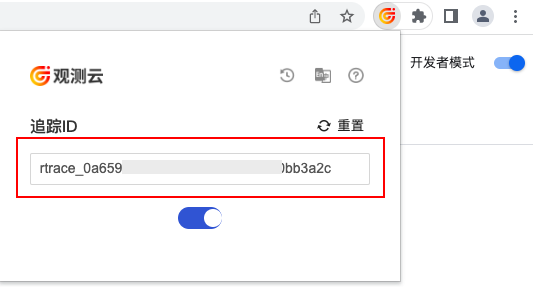
- Click the Extensions icon in the top-right corner of the browser, find Guance Plugin, and open the extension.
-
Enable it to generate a trace ID.
-
Click Enable to start using the current trace ID.
- Click to generate a new trace ID.
- Click to view historically generated trace IDs.
- Click the Language icon to view or switch the current language.
- Click to view the help documentation.
Step 4: Filter and View Data in Guance
In the RUM application list, select the integrated Web application, then filter using the trace ID (track_id) generated by the extension to view user access data.