Timeline Billing Item
Release Note
Guance completed the upgrade and launch of the GuanceDB - Self-Developed Timeseries Database on April 23, 2023. The new GuanceDB is different from the old time-series engine in that it is a single-metric time-series engine, although it still has the concept of a measurement, each metric will have an independent timeline.
As a result, the statistical logic of Guance for timelines has also changed:
Under the new logic:
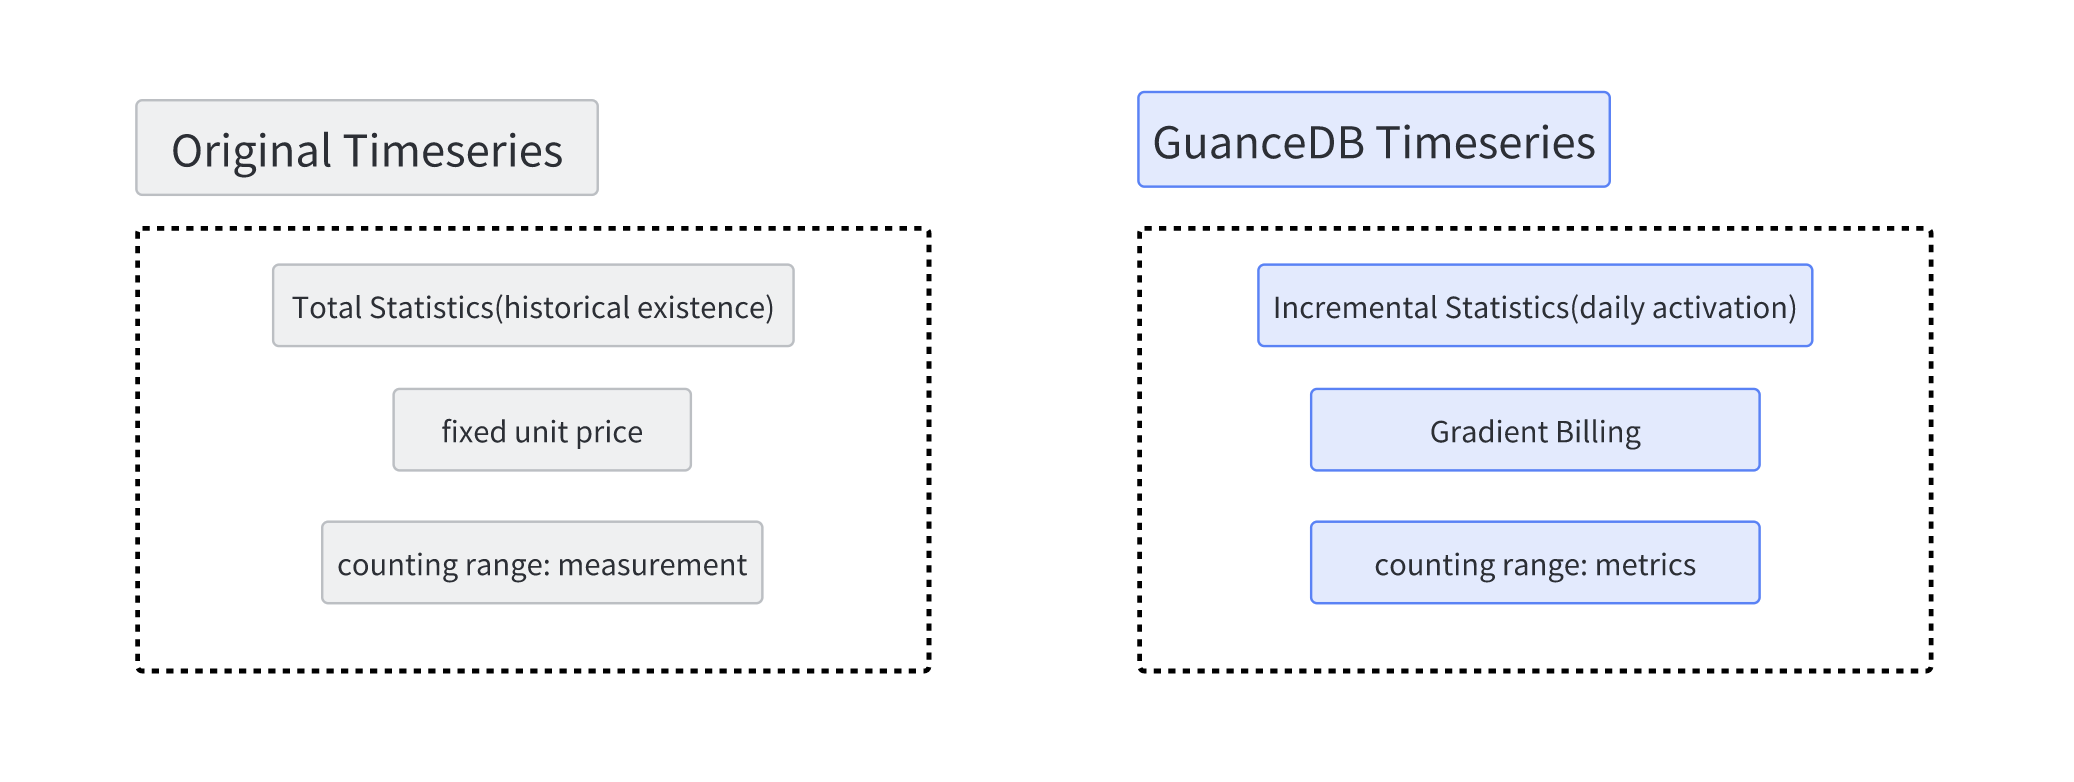
- Full statistics changed to incremental statistics: that is, instead of counting all the timelines of user historical storage data, the new logic counts the number of active timelines that may occur every day.
- Fixed unit price changed to tiered pricing: that is, tiered pricing corresponds to different prices based on the selected data storage strategy.
- The statistical dimension changed from measurement to metric: that is, the previous statistical dimension was based on the measurement dimension to count the tag combinations under the measurement. In the new GuanceDB timeline, Guance counts all tag combinations generated by the data reported on the day based on the metric dimension.
It is no longer the previous statistical quantity of the number of timelines corresponding to the user's storage in the time-series database, and its unit price is relatively fixed; at the same time, it counts all tag combinations under the measurement based on the measurement dimension.
First you should know
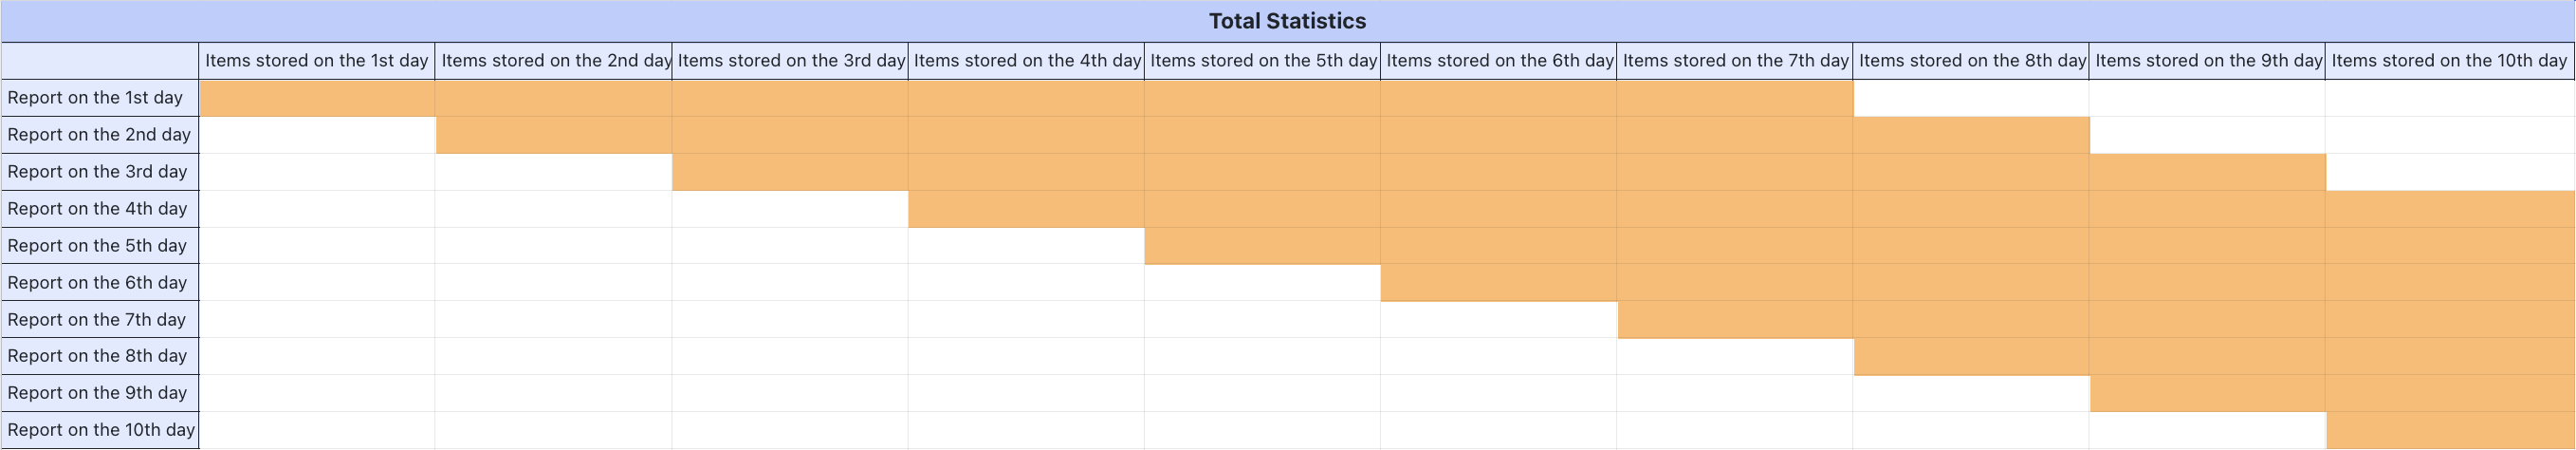
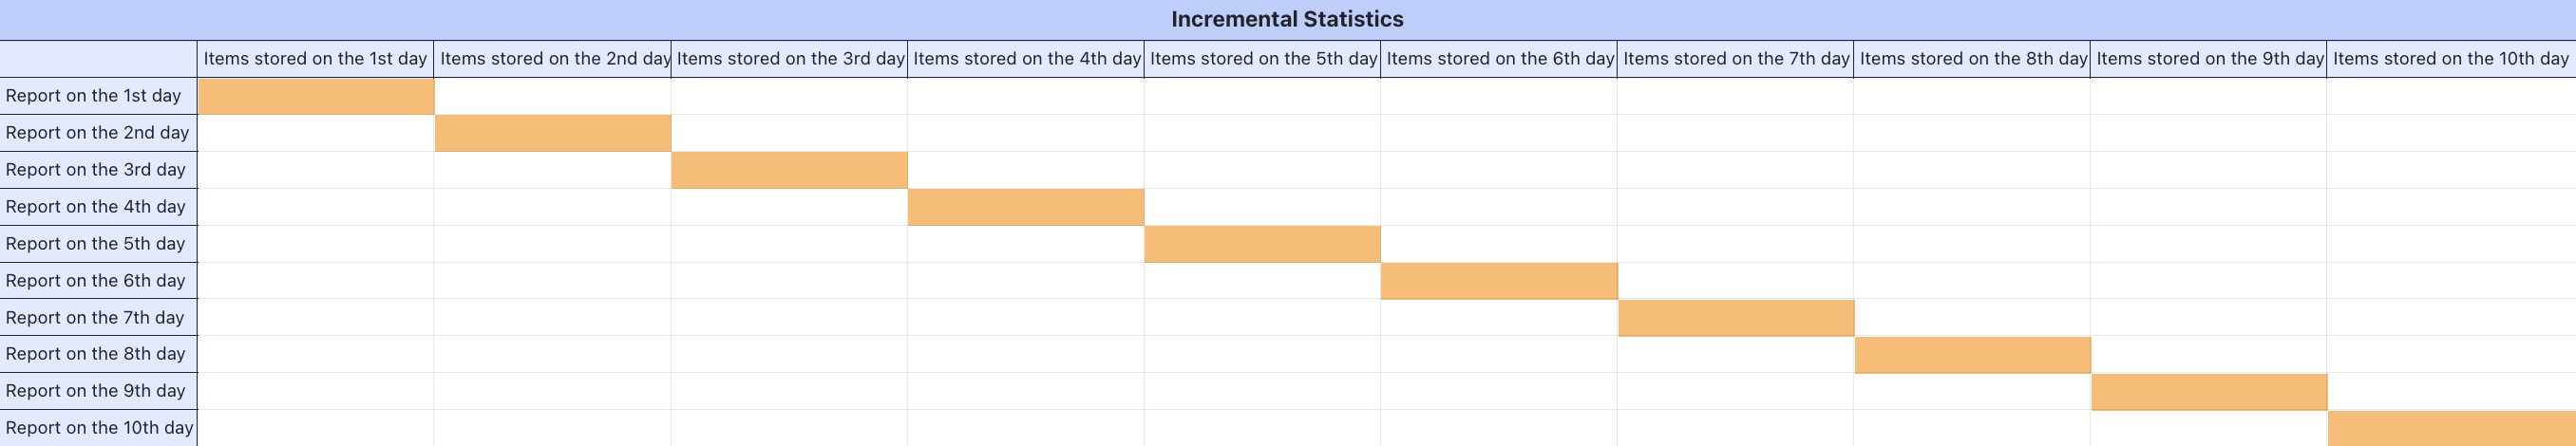
Two pictures tell you how to understand total statistics and incremental statistics:
The time series database of Guance mainly involves the following basic concepts:
| Glossary | Description |
|---|---|
| Data Storage Strategy | Guance supports users to customize the saving time for different data types. The corresponding storage time option configuration can refer to Data Storage Strategy. |
| Total Statistics | Count the number of corresponding data in the current data storage strategy period of a billing item. |
| Incremental Statistics | Count the increase of data corresponding to a billing item on the same day. For specific valuation methods, please refer to the following Log Price Example. |
| Basic Billing | The unit price of a billing item is a fixed value. |
| Gradient Billing | The unit price of a billing item is a dynamic value, which will have different single value according to the data storage strategy selected by the current data type. |
Generate Bills
Metric data is collected through DataKit and reported to a workspace. This specifically refers to the data obtained by querying the NameSpace in DQL that starts with M.
Data Storage Strategy
| Incremental Statistics | |||||||
|---|---|---|---|---|---|---|---|
| Data Storage Strategy | 3 days | 7 days | 14 days | 30 days | 180 days | 360 days | |
| Unit Price (per thousand) | CN | ¥ 0.6 | ¥ 0.7 | ¥ 0.8 | ¥ 1 | ¥ 4 | ¥ 7 |
| CN (Overseas) | ¥ 1.6 | ¥ 1.8 | ¥ 2.2 | ¥ 2.4 | ¥ 8 | ¥ 14 | |
| US | $ 0.23 | $ 0.26 | $ 0.32 | $ 0.35 | $ 1.2 | $ 2 |
Billing Statistics
The number of newly added timelines within each hour of a day is calculated, and the maximum value of the 24 data points is taken as the actual billing quantity.
Exapmle
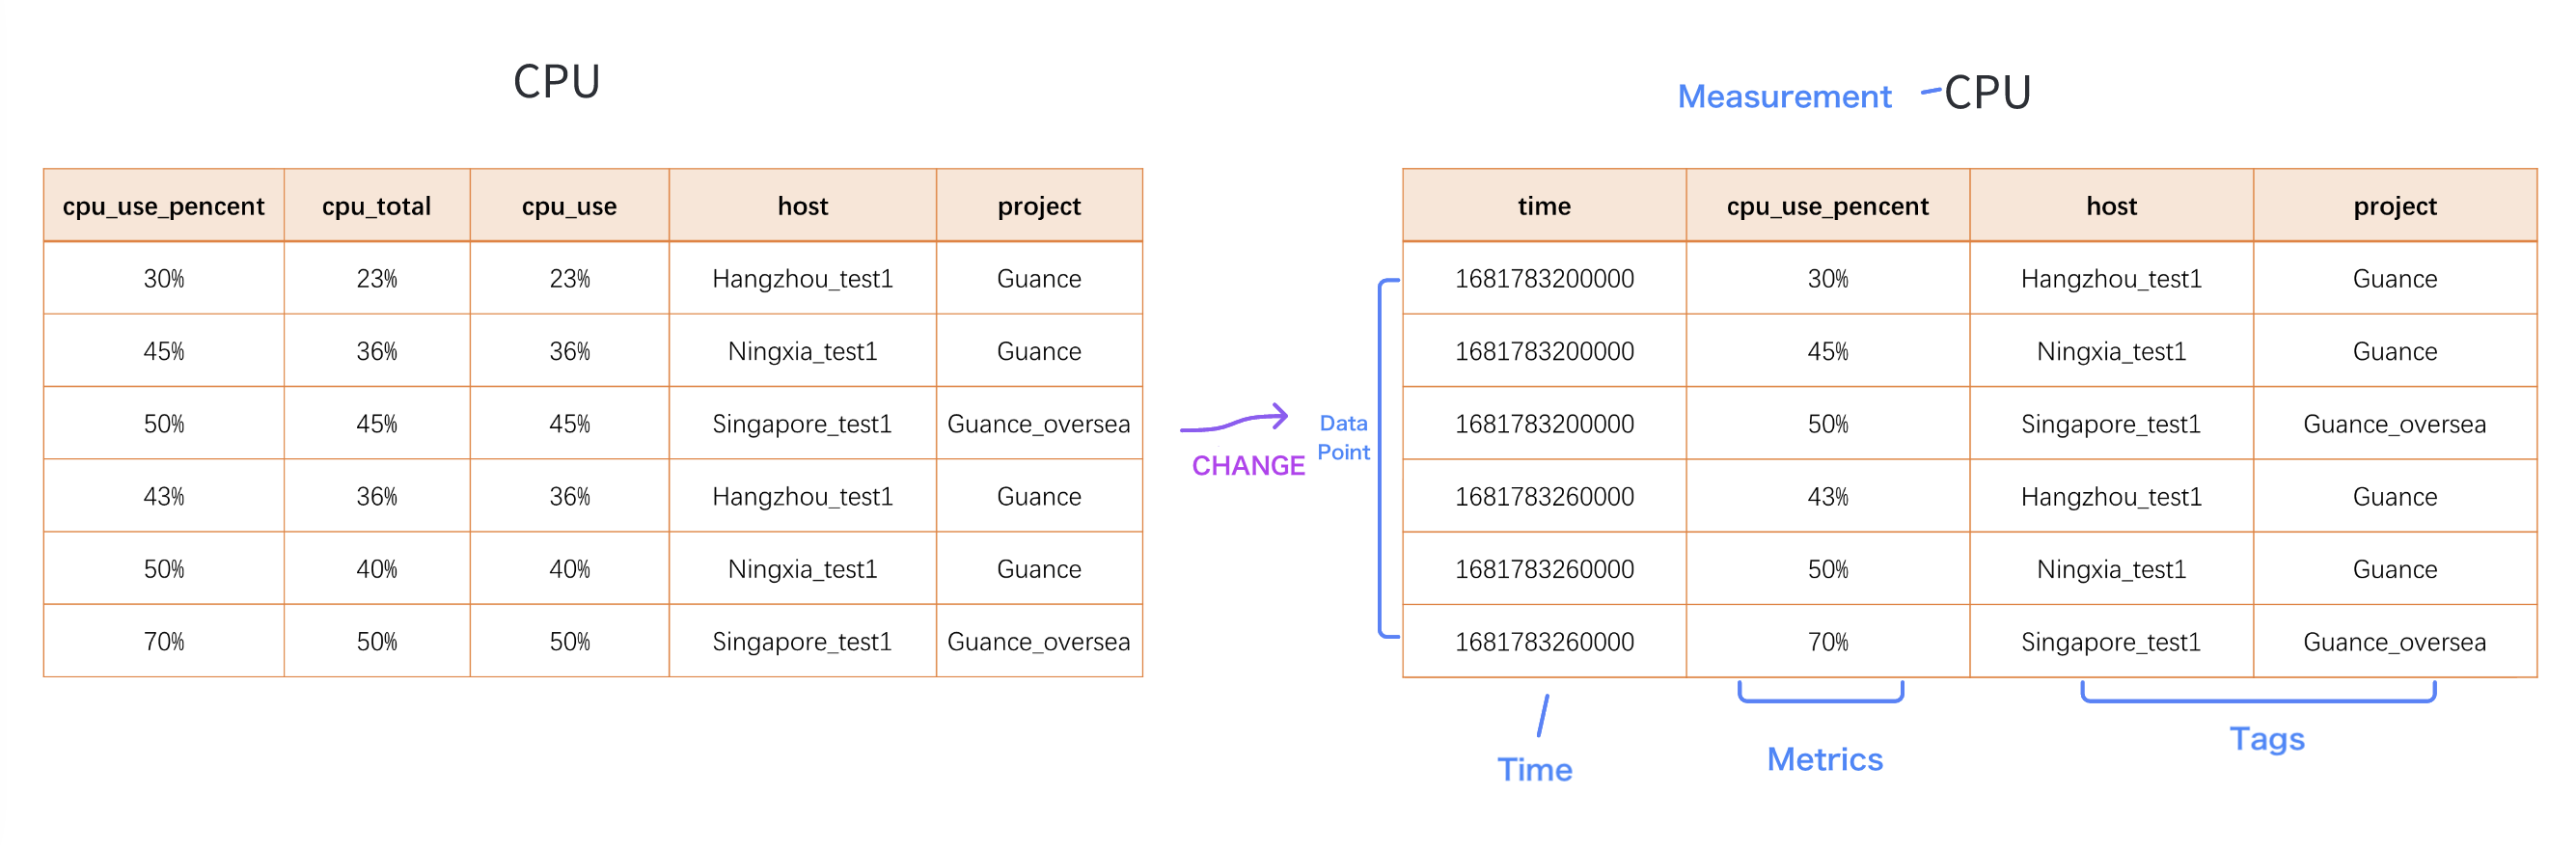
Using the above image as an example:
In the previous version of the timeline statistics logic, there was no concept of metrics or data points. Only the quantity statistics were made for the tag combination of the current measurement. Therefore, it was difficult for us to help users quantify the specific timeline quantities before.
After the change, GuanceDB's timeline logic is based on the tag combination corresponding to each metric. Therefore, according to the latest logic, we can conclude that there are 6 data points based on a single metric in the measurement "CPU", each data point has a time field: time, a metric: cpu_use_pencent, and two tags: host、 project. The first and fourth rows of data are the CPU usage rate (cpu_use_pencent) of "Guance" whose "host" name is Hangzhou_test1 and whose "project" belongs to Guance. Similarly, the second and fifth rows represent the CPU usage rate of "Guance" whose "host" name is Ningxia_test1 and whose "project" belongs to Guance. The third and sixth rows represent the CPU usage rate of "Guance_oversea" whose "host" name is Singapore_test1 and whose "project" belongs to Guance_oversea.
Based on the statistical data of the timeline above, there are a total of 3 combinations for the timeline combination based on the metric cpu_use_pencent, which are:
"host":"Hangzhou_test1","project":"Guance"
"host":"Ningxia_test1","project":"Guance"
"host":"Singapore_test1","project":"Guance_oversea"
Similarly, if you need to calculate the timeline for all metrics in the current workspace, you only need to add up the actual timeline quantities that have been statistically analyzed.
Therefore, in terms of the quantity of timelines, it is important to note:
after the change in the timeline logic, the number of timeline combinations generated per day will increase. However, in actual data performance, the number of timelines that will be charged per day will decrease. This is because when the scope of timeline statistics is full statistics, assuming that the data retention time is 7 days, by the seventh, eighth, ninth, and tenth days, the data has reached a relatively stable state. In other words, if you want to evaluate the quantity of timelines in the future, you will always use the quantity of timelines within this fixed interval to calculate the charging logic.
However, after the change to incremental statistics, Guance Cloud will calculate the number of daily active timelines based on the metric data for that day. Therefore, from the overall perspective, the number of timeline combinations based on a single metric will increase, but the number of timelines that need to be charged will decrease relatively. Considering the increase in quantity, the pricing of GuanceDB's timelines has changed from basic pricing to gradient pricing, from the original 3 yuan / per thousand to 0.6 yuan / per thousand. Therefore, overall, the cost of timelines has decreased compared to before.
Cost Calculation Formula
Daily cost = actual billed quantity / 1000 * unit price (corresponding unit price according to data storage strategy)
Suppose a user has installed a host DataKit with default metric data collection. This host can generate 600 daily active timelines. The calculation can be performed as follows:
- How many hosts with DK installed are there?
- Number * 600 = Daily active timeline quantity
- Corresponding unit price of data storage strategy * Daily active timeline quantity / 1000 = Daily estimated cost