DataKit Performance Explanation
This document primarily showcases DataKit's performance in a real production environment. You can use the data presented here as a reference to benchmark your own environment.
Basic Environment Information
- Operating Environment: Kubernetes
- DataKit Version: 1.28.1
- Resource Limitations: 2C4G (2 CPU cores and 4GB of RAM)
- Runtime: 1.73 days
- Data Sources: There are numerous applications running in the cluster, and DataKit actively collects various metrics, logs, and Tracing data from these applications.
The following lists the load conditions of DataKit under high, medium, and low scenarios 1.
Under high load conditions, the amount of data collected by DataKit and the complexity of the data itself are relatively high, which consumes more computing resources.
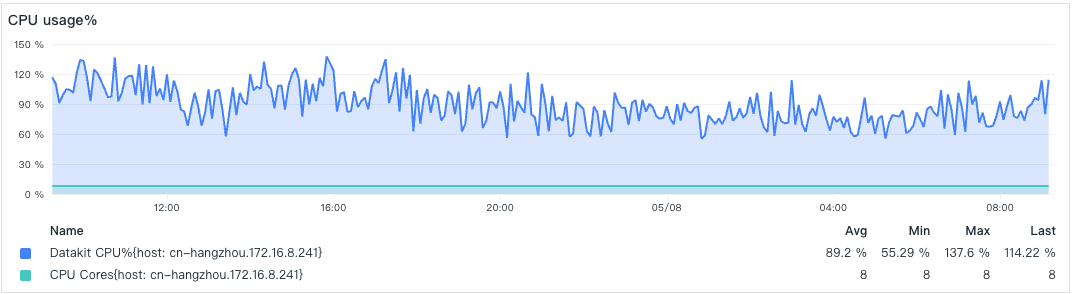
- CPU Utilization
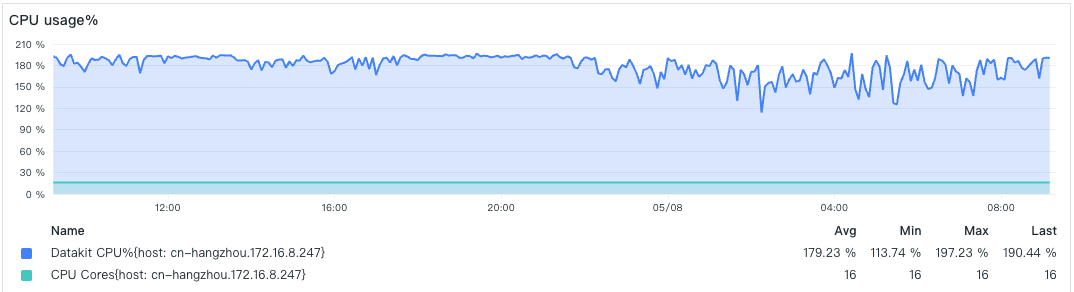
Due to the limitation on the number of CPU cores used, the CPU usage here stabilizes around 200%.
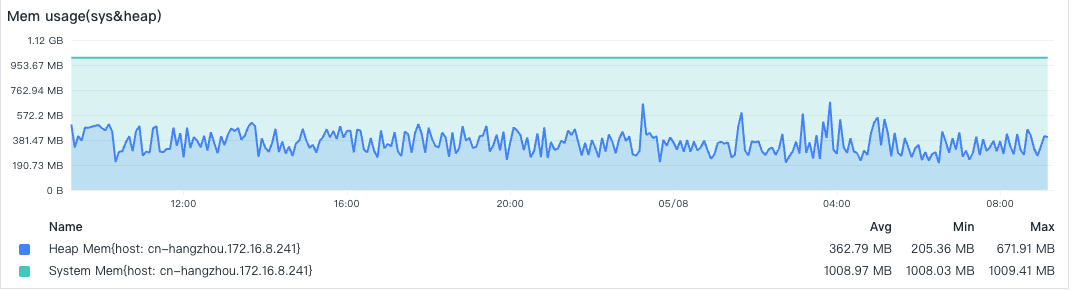
- Memory Consumption
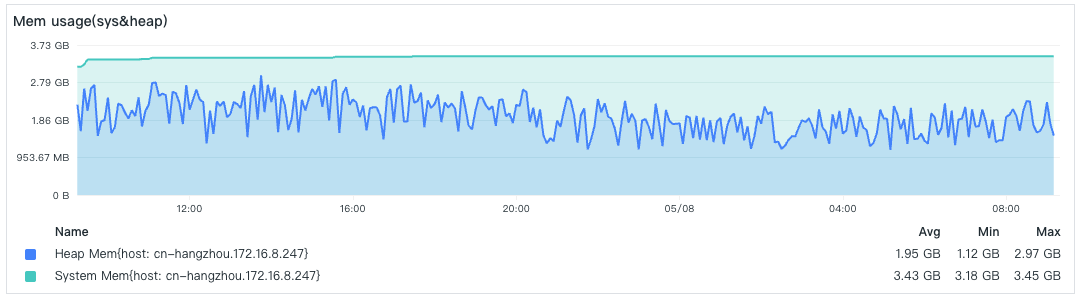
The memory is limited to 4GB, which is quite close to the limit. If the memory limit is exceeded, the DataKit Pod will be restarted due to Out Of Memory (OOM).
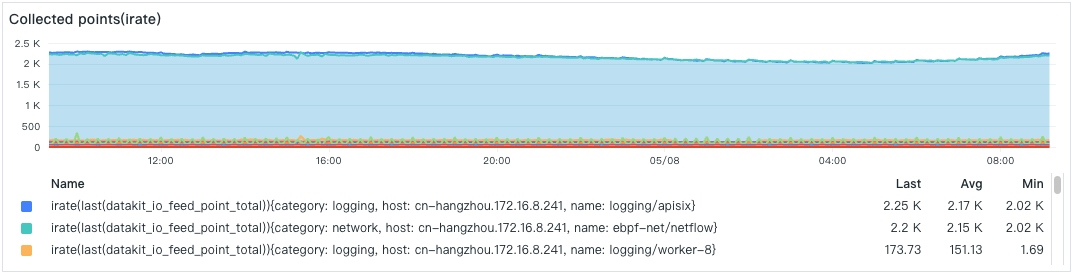
- Data Collection Points
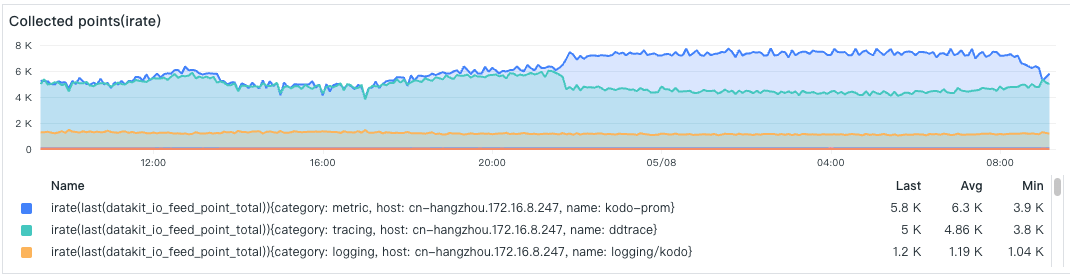
The number of data points collected by each collector, with the top one being a Prometheus metric collection that collects a relatively large number of data points each time, followed by the Tracing collector.
- Pipeline Processing Points
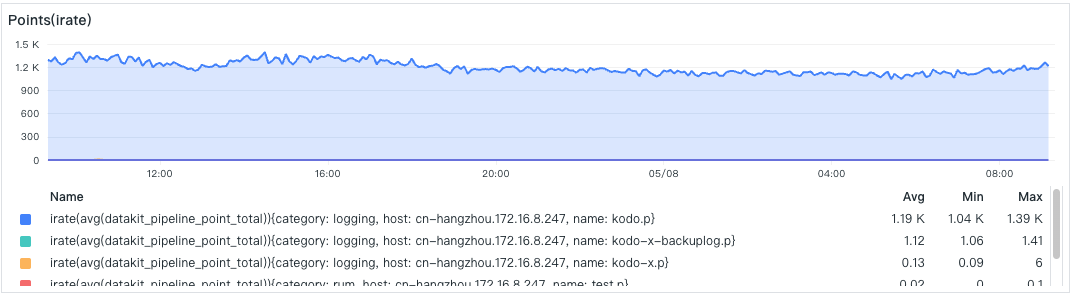
This shows the situation of a specific Pipeline processing data points, with one Pipeline script (kodo.p) being particularly busy.
- Network Upload

The collected data points ultimately need to be sent to the center via the network. What is shown here is the upload of the GZip-compressed data point payload (HTTP Body) 2. Tracing has a particularly large payload because it contains a large amount of text information.
Under medium load conditions, DataKit's resource consumption is significantly reduced.
- CPU Utilization
- Memory Consumption
- Data Collection Points
- Pipeline Processing Points

- Network Upload

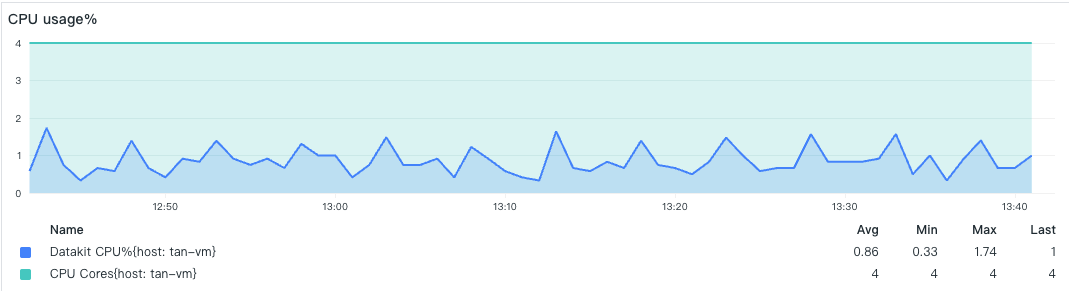
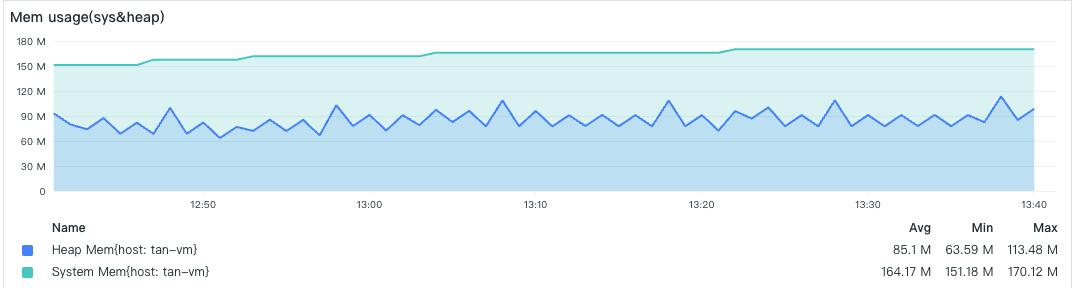
Under low load conditions, DataKit only activates the basic default collectors, with a relatively small amount of data, thus occupying less memory 3.
- CPU Utilization
- Memory Consumption
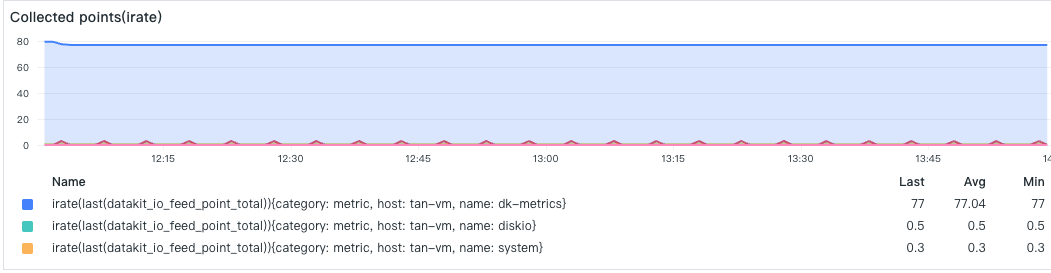
- Data Collection Points
- Network Upload

-
DataKit has enabled Point Pool and is using V2 encoding for uploads. ↩
-
This value may differ slightly from the Pod traffic, as the Pod statistics represent the network traffic information at the Kubernetes level, which will be larger than the traffic shown here. ↩
-
The low-load DataKit was tested on an additional Linux server, which only enabled basic collectors. Since there was no Pipeline involved, there is no corresponding data. ↩