Service
The Service serves as a centralized management entry point, aggregating and correlating performance Metrics, call topologies, service lists, and full observability data (including traces, logs, infrastructure, etc.) from a global perspective. This provides integrated analysis capabilities from an overview of the global state to in-depth diagnostics of individual services.
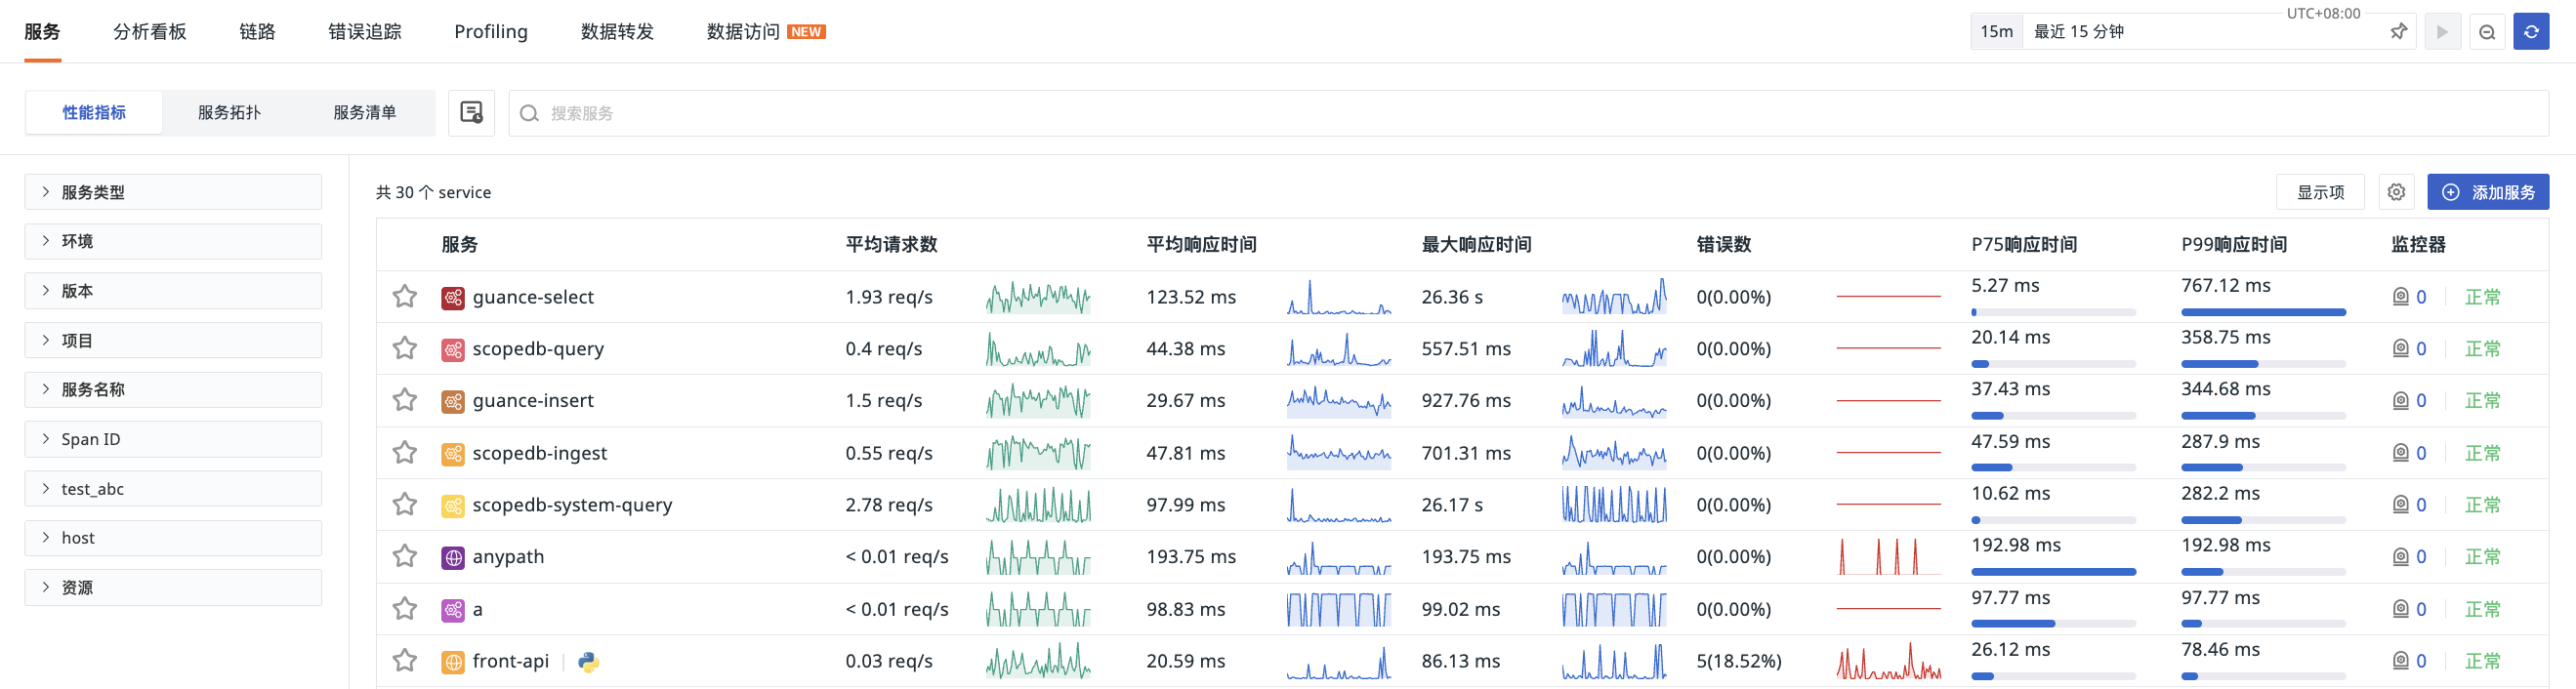
Performance Metrics
The Performance Metrics list provides the core dataset for measuring service health. It centrally displays the performance data of all services within the current workspace in a list format, including key Metrics such as request count, error rate, and response time.
This allows you to quickly assess the operational status of each service from a global level and rapidly locate target services exhibiting anomalies (e.g., sudden spikes in error rates, prolonged response times) using components like filters, search, and the Time Widget, providing a clear starting point for subsequent analysis.
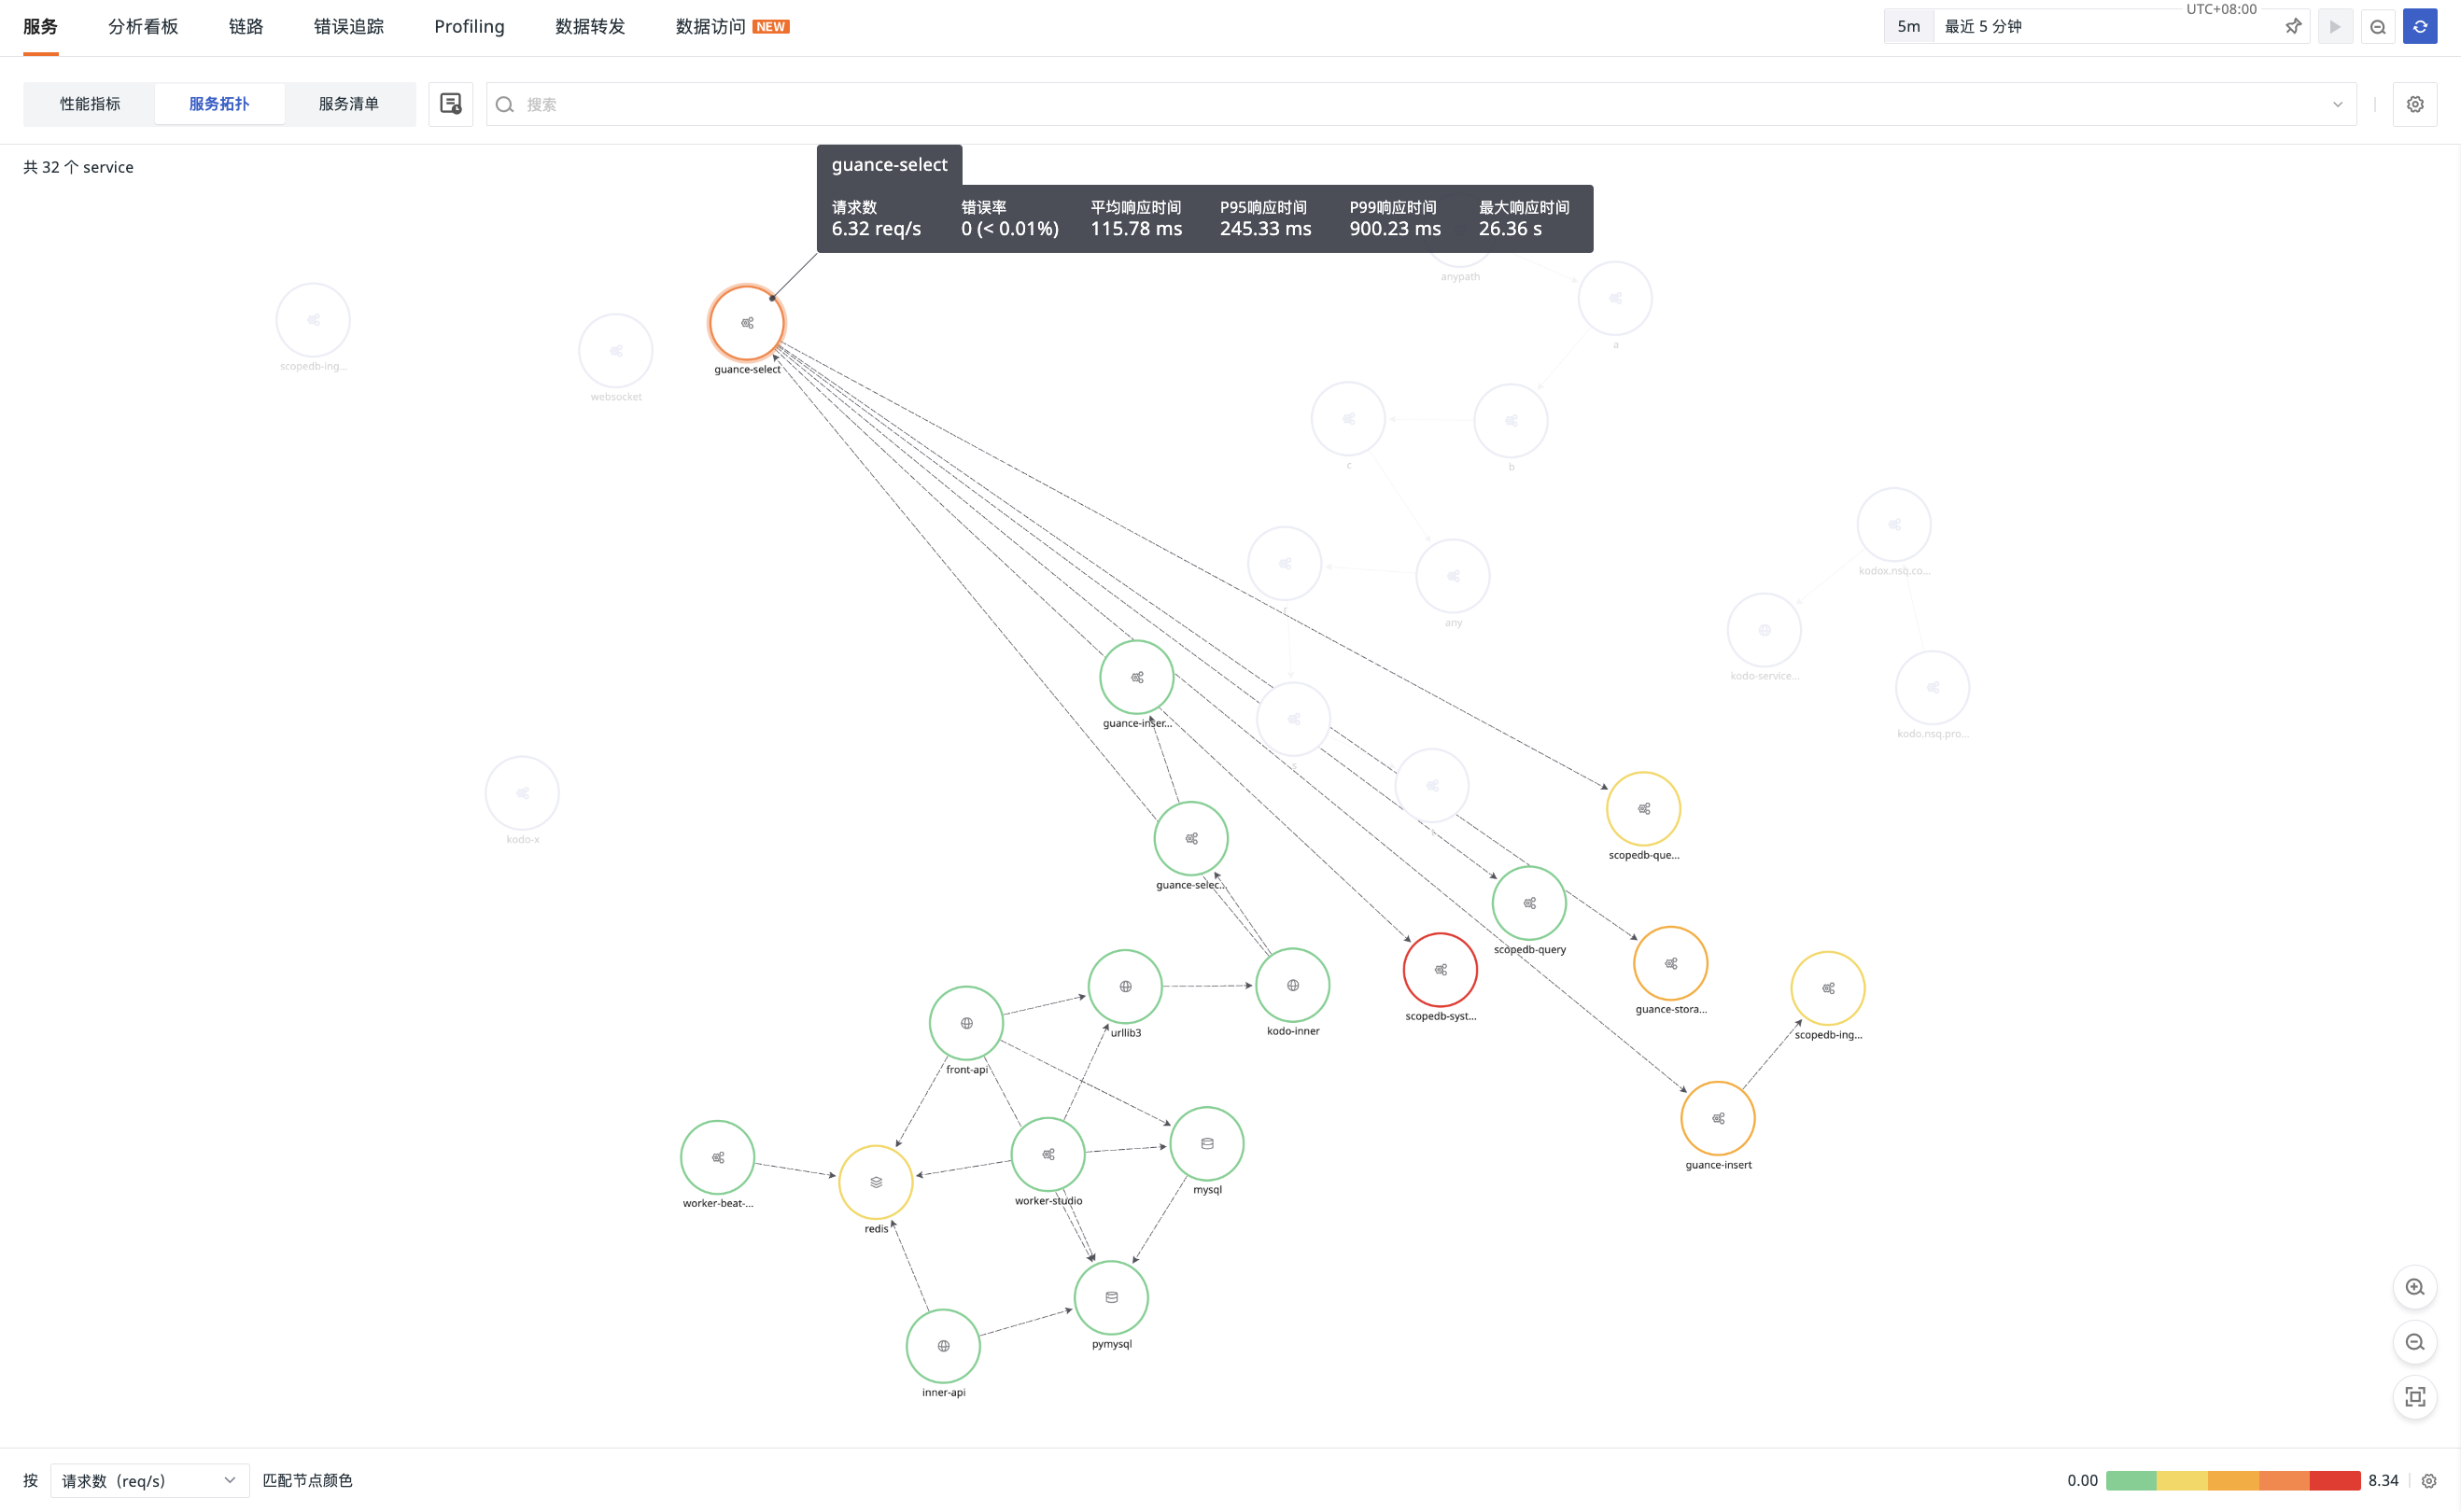
Service Map
The Service Map visually presents the calling relationships and overall dependency structure between services in a topological graph. It aggregates originally scattered trace information into an understandable "map," allowing you to intuitively see which upstream services a service depends on and which downstream services call it.
This global dependency view is crucial for understanding the system architecture, assessing the impact scope of changes, and quickly locating the propagation chain of issues during failures.
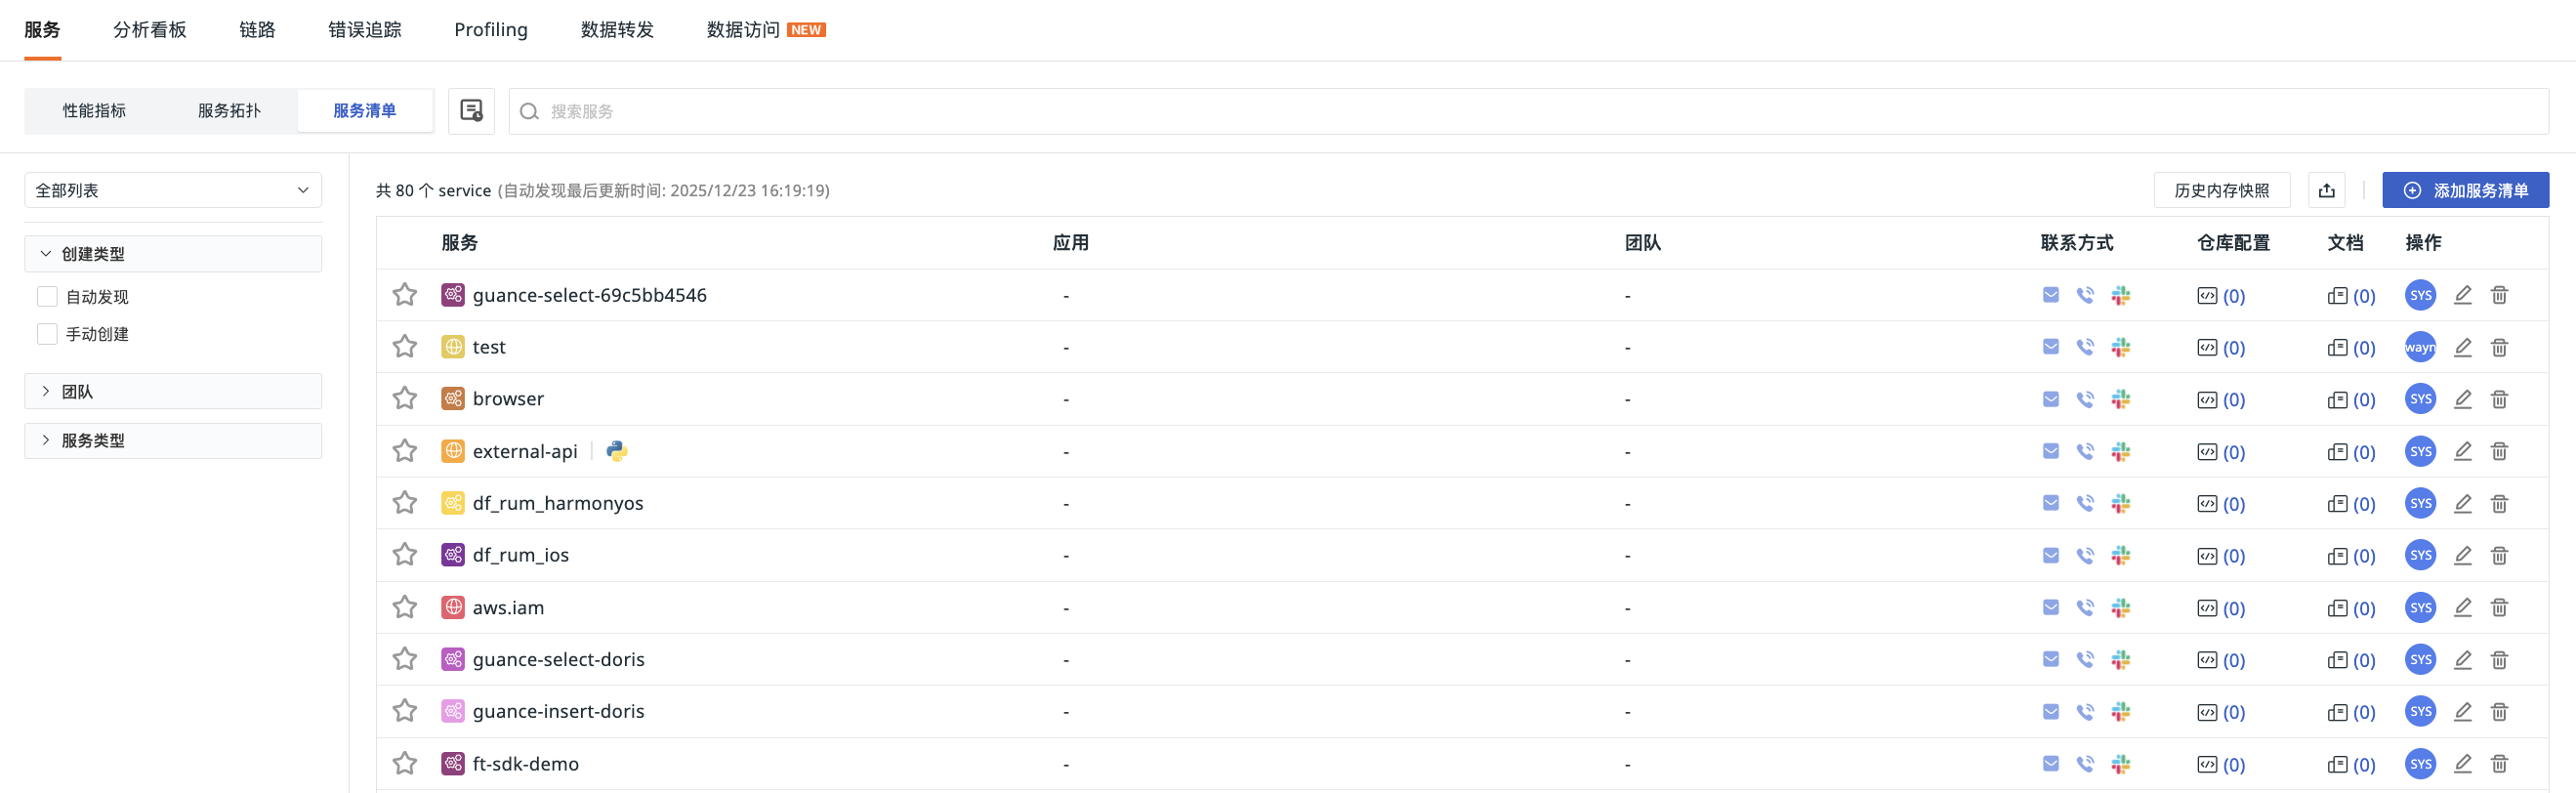
Service List
The Service List is the configuration and attribute management center for all managed services. Here, you can manually add and edit services, and associate business attributes such as corresponding code repositories and technical documentation for each service.
This step deeply binds technical entities (services) with the daily work context of development and operations (code, documentation), enabling direct association to specific code locations and existing solutions when service issues arise.
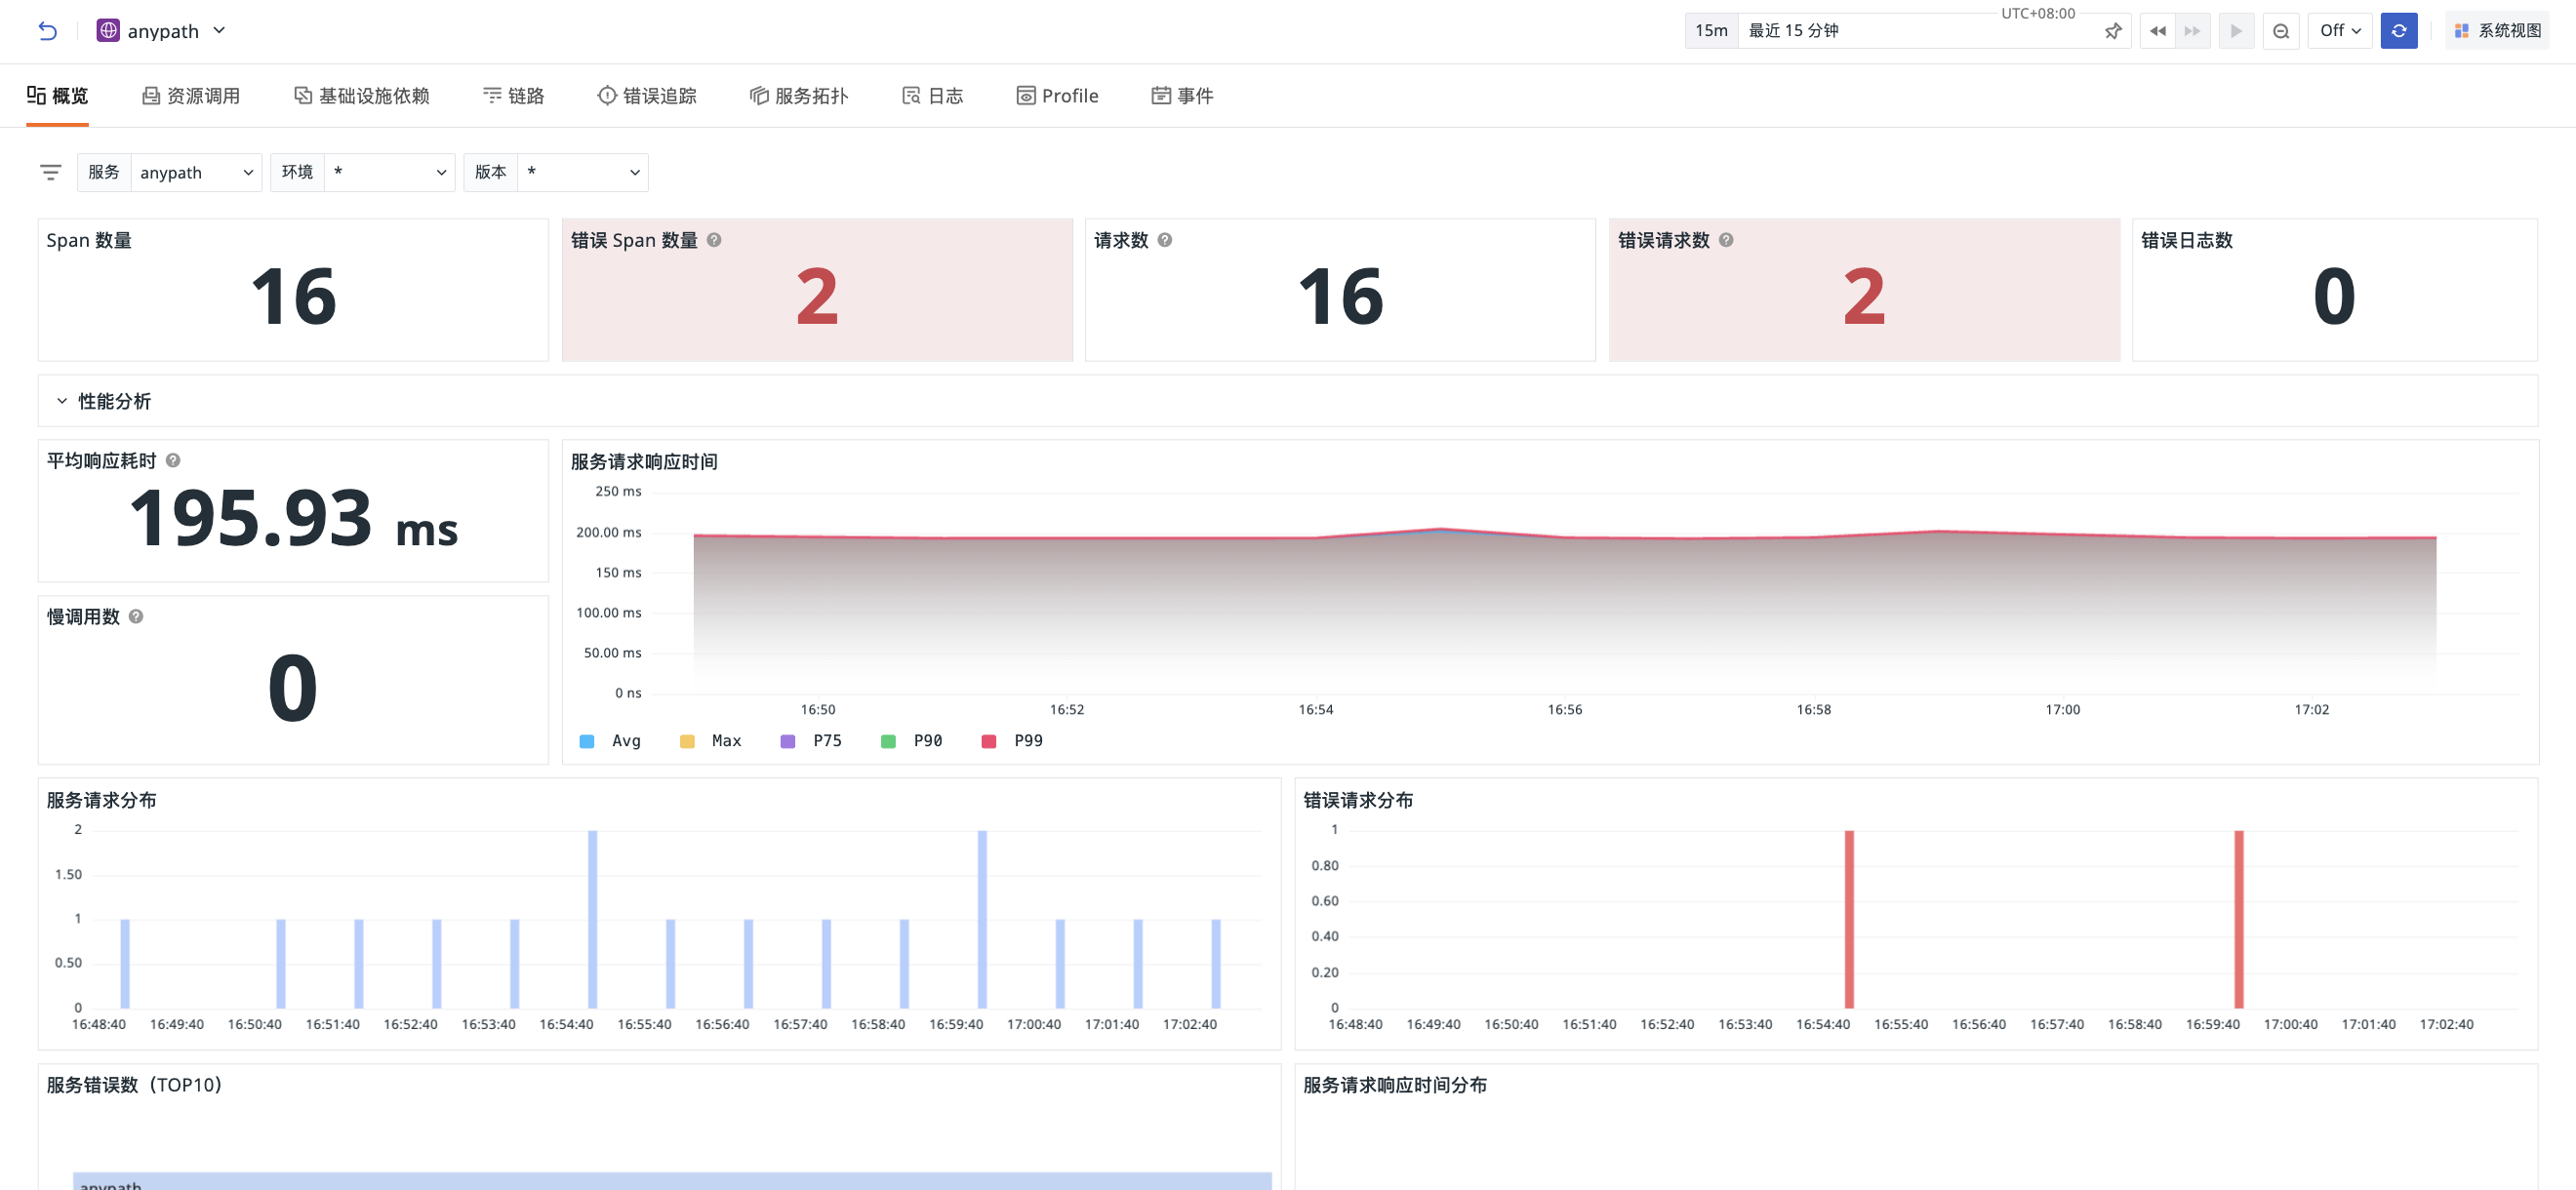
Service Details
Clicking on any service takes you to its Service Details page, which presents a comprehensive analysis interface aggregating all observable data for that service. Through tabs at the top, the page seamlessly integrates different observational perspectives such as analysis dashboards, resource calls, infrastructure dependencies, traces, and logs.
Thus, in-depth analysis focused on a single service can be completed within the same interface without switching between different functional modules. For example, you can start from macro performance charts (analysis dashboard), then examine the most time-consuming API endpoints (resource calls), trace their complete call chain (traces), and finally check the status of the host or container resources supporting the service operation (infrastructure dependencies).