Changelog (2025)
December 24, 2025
Feature Updates
Role Permissions
-
Dashboard permissions refined: A new independent "Create Dashboard" permission has been added. The original "Manage Dashboard" permission still includes all operations. Assigning the "Create" permission will automatically enable basic view permissions for dashboards and views.
-
The navigation bar dynamically displays based on user permissions. If a role has no permissions in a specific module, that module will not be shown in the left navigation bar. This rule applies to the following modules: Cloud Billing, Plans & Billing, Scenarios, Event Center, Infrastructure, Logs, Metrics, APM, RUM, LLM Monitoring, Synthetic Monitoring, Monitoring, Incident, and Security Monitoring.
Monitoring
-
Alert Policy:
- Supports both search and filter to filter alert policies; new support for precise filtering by monitor name (
checker_title) and member (member); - Repeat alerts: Added support for setting different repeat alert mute intervals by alert severity (e.g., critical, high, warning);
- Added notification aggregation rule: "Custom". Supports freely specifying field combinations for alert aggregation based on business needs. Enter field names (multiple fields separated by commas), and the system will strictly aggregate by this combination: aggregation alerts are triggered only when the event data contains all specified fields and all values are valid.
- Supports both search and filter to filter alert policies; new support for precise filtering by monitor name (
-
Arbiter built-in DQL functions support querying data from a specified workspace by passing a workspace parameter. Applicable to Programmable Monitors and SIEM detection rule creation and modification scenarios.
APM
-
- Added Apdex statistics to quantify user satisfaction with application performance;
- Time-series visualization of statistical metrics: Upgraded core statistical metrics in the service list (average request count, response time, error count) from numeric display to time-series charts for intuitive trend visualization.
-
- Supports displaying OpenTelemetry service language;
- Added tabs: Service Map, Profile, and Dashboards.
Scenarios
- New chart type: Change Comparison Chart: Quantitatively compares the specified metric in the current period against a historical period (e.g., same time yesterday, same day last week) or other metrics, displaying the magnitude of change intuitively for quick identification of abnormal fluctuations.
- When creating a new Pie Chart (Donut Chart), if the legend is not hidden, you can choose whether to display the Value and Value percentage.
- Chart Y-axis: Optimized display of raw values.
Snapshots
- Overall optimization of the snapshot list style;
- Save Snapshot: Added "Save as Static Time" setting.
Metrics
Metrics Analysis: Values in query results now support flexible display format settings, including decimal places and full precision display.
Management
- Cross-workspace authorization: When the data scope is set to "Metrics", you can fine-tune the metric authorization scope;
- Share Management: Added quick type filtering and a search box.
Pipelines
Each data type now supports setting up to two default Pipelines (including local and central Pipelines).
Open API
Dashboards support specifying the default selected workspace when querying across spaces.
Deployment Plan
-
Management Console:
- Workspace List > Tenant Configuration Management:
- Added "Max Slice Time" setting, which defines the maximum time search range for a single query. Once sufficient data is collected within this range, the search stops immediately;
- Extended "Sampling Threshold" configuration, allowing free definition.
- Supports batch import of members by uploading a member list file;
- Security Settings > Login Method Management: Supports modifying the default LDAP account name display to adapt to different internal system unified login scenarios.
- Workspace List > Tenant Configuration Management:
-
Added parameter (
max_delay) to support customizing the service topology calculation time.
New Integrations
- Added GCP Storage integration;
- Added GCP Cloud SQL (MySQL) integration;
- Added Alibaba Cloud VPC Peering integration;
- Added AWS Lambda Trace integration;
- Added Alibaba Cloud WAF integration;
- Supplemented Tencent Cloud CVM / KeeWiDB views;
- Fixed case sensitivity issues in the Ingress-nginx-prom integration documentation;
- Fixed integration documentation issues (including Chinese/English characters and formatting);
- Fixed TencentCloud public network CLB collector to support non-public IPs;
- Fixed linear bucket (
linearBuckets) metric bug in GCP Cloud Monitoring; - Added CSPM rule: S3 bucket policies should restrict access from other AWS accounts;
- Added cloud integration templates: Aliyun CPFS, Aliyun NLB, HuaweiCloud EVS, Aliyun CNAPIGateway, HuaweiCloud ROMA;
- Added cloud scripts: GCP APIs collector;
- Added cloud scripts: GCP RUN collector.
Bug Fixes
- Fixed the issue where alert events could not be recovered;
- Fixed the issue of excessive connections to external Kafka clusters;
- Fixed the issue where email addresses blacklisted could not receive emails properly;
- Fixed the issue where the total number of online hosts was not displayed on initial load of the host list, requiring lazy loading;
- Fixed the error returned when calling the log query task interface;
- Fixed the issue where clicking silence in the event details of the Hangzhou site did not take effect;
- Fixed the issue where the snapshot share button was sometimes unresponsive;
- Fixed the issue of poor sampling results for APM in overseas sites;
- Fixed the issue where alert events could not be associated with related content for viewing;
- Fixed the issue where searching for a log source triggered a large query, causing the platform query to return no results;
- Fixed the issue of not receiving high-consumption alert emails;
- Fixed the issue where monitor events did not recover as expected;
- Fixed the issue of abnormal data display in the RUM error analysis view;
- Fixed the error when querying trace data (7 days) and logs (7 days);
- Fixed the issue of abnormal Sourcemap upload for the same version;
- Fixed the issue where selecting all indexes as wildcards when generating metrics from logs caused generation failure;
- Fixed the issue where read-only users could not view public dashboards;
- Fixed the issue where the quick search function in dashboards could not be combined with the log stream chart, and multi-selection of view variables displayed abnormally in the log analysis function;
- Fixed the issue of encountering errors when getting samples during timeline governance using pipelines in overseas sites;
- Fixed the issue where the "Past 1 Month" query range in scheduled reports for overseas sites returned an incorrect time range (217 days);
- Fixed the issue where testing was blocked due to incorrect dashboard templates in overseas sites;
- Fixed the issue of abnormal expression calculation results in monitors;
- Fixed the issue where the page often went blank after clicking the "Go to Workspace" link, with no event details displayed;
- Fixed the issue of incorrect path in the guided installation of the data collector;
- Fixed the issue where RUM geographic location was displayed as "Unknown";
- Fixed the issue of abnormal CPU load value display for Windows hosts in Infrastructure;
- Fixed the issue of abnormal results when using DQL for trace queries;
- Fixed the issue where Session Replay data could not be displayed;
- Fixed the issue where APM data results were incorrect after adjusting the time window in overseas sites;
- Fixed the issue where Inner Mongolia was displayed as English and data was incorrect on the China map;
- Fixed the issue where log data query returned no results after binding to an external index;
- Fixed the issue where trace data details could not be opened;
- Fixed the issue where pipelines could not judge and filter text content that was empty during log processing;
- Fixed the issue of failed city resolution for IP addresses;
- Fixed the issue of Chinese characters appearing in pipeline script functions in overseas sites, and the user ID not displaying in the Resource Explorer, as well as dashboard errors in the resource analysis section of the RUM analysis dashboard;
- Fixed the occasional lag when selecting a wildcard variable.
December 10, 2025
Feature Updates
Plans & Billing
Based on the new notification target, a new billing item "Phone Call" has been added: counts the number of voice notifications sent per day (per call/day).
For China sites, the billing details are as follows:
| Billing Item | Settlement Currency | Price |
|---|---|---|
| Phone Call | CNY | ¥0.6 |
| USD | $0.09 |
Monitoring
- Added support for Voice Call as a notification target;
- Monitors support cross-workspace data detection.
Management
Data Forwarding: After executing the Delete Rule action, the system sets the rule status to "Deleting". The rule is automatically removed once processing is complete.
December 3, 2025
Feature Updates
APM
- Service Map:
- Clicking a node now slides out the corresponding service details on the right. In addition to basic information such as service name, team, and contact, new analysis charts for service request response time, error request distribution, and error log count have been added;
- Added action buttons: zoom out, zoom in, and display the full topology;
- Added topology configuration:
- Users can manually configure whether to calculate node size based on "Request Count";
- Users can choose the hover highlight scope.
- Performance Metrics:
- Added Custom Filter Fields. In addition to the default official filter fields, users can customize up to 5 fields as filter fields;
- Added support for exporting the current performance metrics list to a CSV file.
- Service Details > Resource Calls:
- Added sampling prompt: When the resource list and distribution chart queries trigger sampling, a "Sampling Rate icon" is displayed;
- Upstream/Downstream Topology: Added "View Upstream/Downstream Calls" button, supporting viewing the call relationship of the upper/lower layer based on the current topology, enabling full link path analysis starting from the current resource.
- Traces > Service Call Relationship:
- Interaction optimization: Only draws call paths between different services for clearer dependency relationships;
- Node information enhancement: Displays the full path service call relationship using a left-right structure, and directly shows execution time, average response time, call count, and error information on each service node; click to view the parent Span of the service for tracing upstream call sources; if the service has errors, error details are directly displayed.
RUM
- To support the HarmonyOS ecosystem, added support for the HarmonyOS application type. Users can select the HarmonyOS type when creating an application and obtain the corresponding SDK integration guide and configuration support for full observability of HarmonyOS applications.
- The View Explorer page supports Obsy AI error analysis.
Event Center
Added Event Level: Fatal (df_status:fatal), defined as the highest level.
DQL
- Added function
histogram_auto(): Automatic histogram range aggregation, no need to manually provide bucket boundaries; automatically selects appropriate bucket range to return data distribution statistics. evalexpression null value handling logic optimized: Added OR operator null value judgment rule: when the left query result is empty, automatically uses the right result for calculation, flexibly adapting to null value completion scenarios. Example analysis:- (a or 0) / b: When query result for a is empty, it is automatically treated as 0, resulting in 0 / b;
- (a or b) / b: When query result for a is empty, it automatically uses the query result for b, resulting in b / b.
MCP Server
Added support for querying metrics, traces, and RUM data in a standardized way.
Management
- Data Forwarding: Deleting a rule requires entering the rule name to confirm the operation;
- Member Management: Supports assigning roles to teams. Team roles are automatically applied as additional roles to team members. The final permissions of a member include both personal roles and team roles.
Scenarios
- Dashboards:
- Added a "Filter" button for quickly adding global filter conditions;
- Original features like "History Versions", "Full-Screen Mode", and "Report Records" have been moved to the "Settings" dropdown menu.
- Charts:
- Advanced Configuration: Added "Replicate Chart" option. When enabled, the system generates multiple charts with the same structure based on each value of the selected view variable;
- Clicking on a data point now supports Apply to Filter and Copy Group Label;
- Table Chart: Manual input limit for return count increased to 2000.
Monitoring
Alert Aggregation Notification Template Optimization: In rule aggregation and smart aggregation notifications, displays the number of different events triggered within the current aggregation period, helping users quickly identify the scale and impact of events associated with the alert.
New Integrations
- Openresty added OpenTelemetry trace access method;
- Added Zabbix integration based on api/stream;
- Added Alibaba Cloud Cloud-native API Gateway integration and Alibaba Cloud Function Compute integration;
- Added Huawei Cloud EVS (Elastic Volume Service) integration;
- Added Tencent Cloud WAF monitor;
- Optimized Alibaba Cloud NLB view & integration documentation;
- Optimized Alibaba Cloud SLB view;
- Fixed IIS integration view monitor;
- Optimized Huawei Cloud ECS, CSS, Functiongraph views and monitors;
- Optimized Tencent Cloud CLB monitor/view;
- Supplemented Huawei Cloud DC / Alibaba Cloud SLB monitors;
- Removed Huawei Cloud GaussDB related integrations (Huawei Cloud discontinued the related products);
- Fixed Huawei Cloud ROMA script;
- Added CSPM templates:
- S3 buckets should have "MFA Delete" enabled;
- S3 bucket ACLs should restrict public access;
- S3 bucket content access should be limited to authorized principals;
- IAM users should not have "AdministratorAccess" policy attached;
- IAM policies should be attached and managed at the group level.
- Added Resource Catalog templates:
- Huawei Cloud: dds, functiongraph, kafka, obs, rds(mysql), rds_mariadb, rds_sqlserver
- Volcengine: postgresql
- Alibaba Cloud: nat
- Tencent Cloud: tdsql_c_mysql, mongodb, eip, cos
- AWS: iam_user
- Cloud integration templates:
- Added Tencent Cloud ckafka, es, redis, waf, etc.;
- Optimized Huawei Cloud: rds, postgresql, apig;
- Optimized AWS: WAF.
Bug Fixes
- Fixed the issue where an already registered email could not log in to the corresponding workspace;
- Fixed the issue where log data could not be written to a newly created workspace;
- Fixed the issue where the unrecovered event list had no data after pagination;
- Fixed the issue where monitoring metrics showed that self-built dialing nodes sent data successfully, but there was no data in the Explorer;
- Fixed the issue where the file path in error details was not displayed correctly after successful SourceMap upload and parsing;
- Fixed the issue where global configuration saving in the Profiling Explorer was invalid;
- Fixed the abnormal auto-refresh function in view mode for a single dashboard in Scenarios;
- Fixed the issue where workspace admin accounts could not create new workspaces;
- Fixed the issue where the time interval for opening view details after clicking the view button in a dashboard did not match the dashboard configuration;
- Fixed the abnormal billing time series function;
- Fixed the occasional issue where filter conditions in the Log Explorer sidebar did not return correct results;
- Fixed the issue where scheduled reports could not be generated;
- Fixed the incorrect text in the synthetic testing workspace page;
- Fixed the "No permission to query metric data" issue in external API reports;
- Fixed the "Internal Server Error" issue when an account restricted by data access permissions tried to access the Log Explorer;
- Fixed the interface error when viewing the network topology in the Infrastructure network menu;
- Fixed the issue where iOS symbol table uploads failed to parse stack information;
- Fixed the frequent false alarms (false positive) in the Infrastructure Liveness Detection V2 version (corresponding machine online without issues);
- Fixed the issue where the Log Explorer in a workspace could not search for specific logs using Chinese characters;
- Fixed the intermittent missing or incomplete trace query results, requiring repeated page refreshes;
- Fixed the issue where the maximum value supported for the continuous trigger judgment condition in monitors was incorrect (should be 10);
- Fixed the issue where the amount of log data forwarded decreased abnormally by 90% from a specific date;
- Fixed the issue where the
error_stackfield could not be selected in the monitor grouping settings, although it could be used normally in DQL; - Fixed the issue where the data returned by the monitor's DQL query was incorrect, leading to false event alerts;
- Fixed the issue where accessing the Infrastructure function failed in the Ningxia site;
- Fixed the issue where all related charts showed "No Data" when drilling down into CPU metrics;
- Fixed the issue where logs could be displayed by
traceidin the workspace, but searching for keywords in the logs returned no results; - Fixed the issue where a log monitor could be saved without a data source configuration, but the monitor would fail;
- Fixed the error when opening a view in the Scenarios module within the mobile app;
- Fixed the abnormal increase in the "Cross-Region Private Network Traffic Fee" billing item on a specific date in the workspace;
- Fixed the issue where the high-consumption alert set in the Hangzhou site workspace did not send the alert email properly;
- Fixed the issue where AWS-related resource directories were displayed in Chinese;
- Fixed the abnormal auto-scaling function when setting the data unit for a dashboard;
- Fixed the error in displaying resource topology data and the inability to load the Profiling page in the Hangzhou site workspace;
- Fixed the abnormal log query issue in the Oregon site;
- Fixed the issue where some service nodes in the resource topology had no upstream/downstream connections, and metrics like request count and p99 were 0;
- Fixed the issue where scheduled dashboard reports did not display data correctly;
- Fixed the abnormal link click-through issue in the APM analysis dashboard;
- Fixed the issue of abnormally high error log count (nearly 10,000 per minute) in a specific service log in the Deployment Plan.
November 20, 2025
Feature Updates
Query Tool
PromQL > Range Query Mode supports setting the step (step).
Scenarios
- Text Chart supports importing view variables and time variables, automatically parsing manually entered view variables
#{fieldname}and time variables. - Funnel Chart: The number of nodes that can be added has been increased to 15.
- In dashboards, explorers, and query tools, when a chart enables sampling, a sampling rate icon will be displayed in the top-right corner.
- In the Query Tool, clicking this icon temporarily disables sampling.
Management
- In the blacklist configuration, "Filter" is now optional.
- SSO Management:
- Enable/disable operations can only be performed after clicking the "Edit" button;
- The "Edit Identity Provider > Role Authorization" page supports selecting custom roles.
November 12, 2025
Feature Updates
Plans & Billing
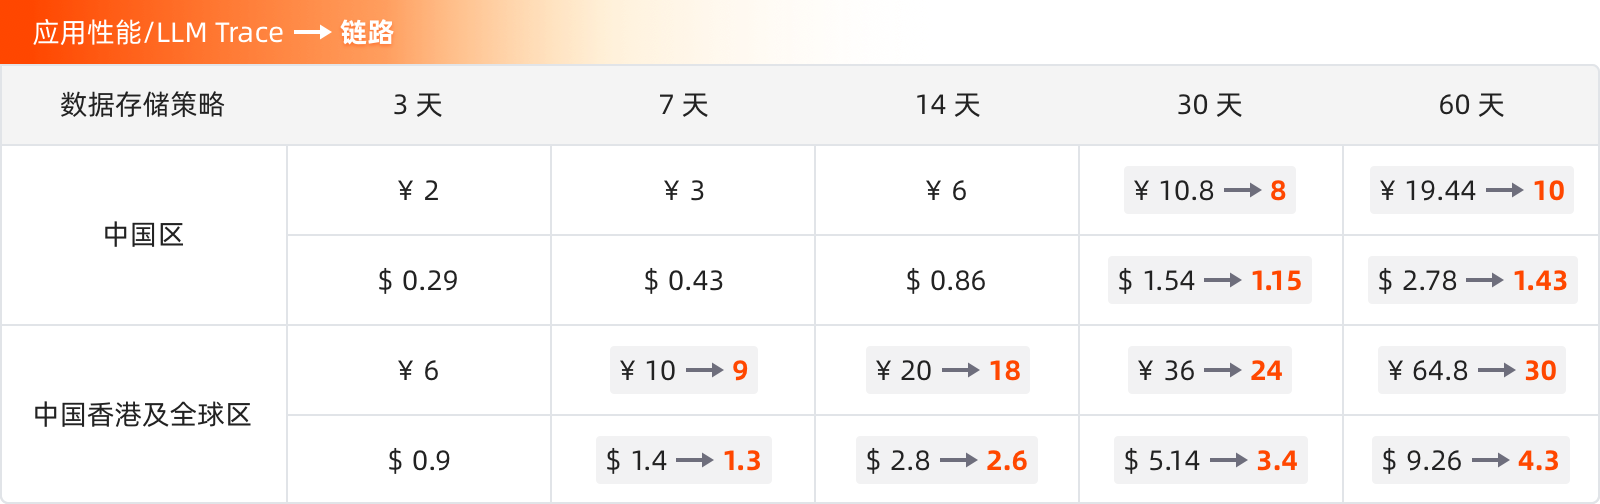
The billing unit price for "APM/LLM Trace" has been adjusted as follows:
Monitoring
Added Programmable Detection monitor, which covers detection needs for various system data types by writing detection rules via scripts.
Obsy AI
Added support for anomaly analysis. Based on the input text, Obsy AI can intelligently integrate complex and disordered information to generate clear and concise root cause analysis results.
MCP Server
Added support for accessing MCP Server (Model Context Protocol). As an open protocol, it provides a unified multi-model callable interface service for Guance Obsy AI, supporting multiple client access, and accessing Guance's monitors, logs, dashboards, and DQL queries via API Key authentication.
Management
- Role Management: Scene Configuration Management / Monitor permissions split.
- Scene Configuration Management: Permissions subdivided into:
- Dashboard and View Viewing
- Dashboard Management
- View Management
- Notes and Explorer Management
- Monitors: Split into Monitor Viewing and Monitor Management permissions.
- Scene Configuration Management: Permissions subdivided into:
- Field Management: Added Attribute Classification configuration options, including: System Fields, Business Fields, and Others.
- Workspace Settings:
- Added Data Reporting IP Whitelist configuration. When enabled, only egress IPs in the whitelist can report data normally; data from other sources will be blocked.
- The original "IP Whitelist" configuration has been renamed to "Login IP Whitelist". When enabled, only sources in the whitelist can log in normally; requests from other sources will be denied.
LLM Monitoring
Added support for collecting and displaying ratings (model quality evaluation scores, descriptions, etc.).
Event Center
Change Events: When a new host is connected, a new change event will be generated.
Scenarios
- Time Series Chart > Analysis Mode added style switching and period-over-period comparison;
- Charts added "Open in Metrics Analysis" function. From any chart, you can seamlessly navigate to the Metrics Analysis interface, which automatically brings in the set query conditions.
Explorers
- Log Explorer: Displayed fields also support filtering by value;
- All Explorers: Added field type icon display.
Log Indexes
- Log Index: Added Description and Associated Service Configuration. When querying traces, the system will automatically associate matching service indexes.
- External Index: Added index description configuration;
- Explorer application index supports single/multi-select mode switching.
APM
Service Map: Added maximum service response time display.
RUM
Explorer > Fetch/XHR tab: The original "Request" column has been renamed to "Resource URL" and supports displaying the full URL, which can be toggled on/off.
Cloud Account Management
Added a search control for fuzzy keyword matching.
New Integrations
- Added Volcengine PostgreSQL integration;
- Added Alibaba Cloud CPFS integration;
- Added Alibaba Cloud ALB integration;
- Optimized Alibaba Cloud NAT view;
- Optimized Tencent Cloud Cloud Monitor;
- Optimized Alibaba Cloud Oceanbase dashboard;
- Added Pipeline templates:
- AWS ELB
- Squid
- Kong
- CloudFront
- CloudTrail
- Added cloud collector templates:
- Alibaba Cloud: cfw/cen/apigateway/mqtt/nas/OceanBase/ga;
- AWS: step function/ssm run command/waf2;
- Huawei Cloud: apic/apig/auto_scaling/cbr/cdm/css_es/dcaas, etc.;
- Added CSPM templates.
Bug Fixes
- Fixed the issue where the context could not be displayed when clicking on a log stream chart to expand the log details page;
- Fixed the issue where the index was not automatically matched in the log slide-out page;
- Fixed the issue where too many view variables in a dashboard could not be selected;
- Fixed the issue where the latest DK version could not be obtained via Helm in the AWS Oregon region;
- Fixed the DQL parsing failure when configuring detection metrics in APM metric detection;
- Fixed the language display issues in the workspace invite member failure report and APM interface;
- Fixed the abnormal display when clicking the "Data Access" menu;
- Fixed the issue where emails were not received for one-time "Immediate" reports in the Singapore site scheduled reports;
- Fixed the chart jump issue in the RUM performance analysis dashboard;
- Fixed the page error when viewing basic machine information in the Oregon site;
- Fixed the issue where the log source under the selected index could not be displayed normally in the log detection monitor;
- Fixed the unresponsive click on the log source in the monitor;
- Fixed the issue of excessive connections when forwarding data to Kafka;
- Fixed the Internal Server Error when querying the last day of data in the APM analysis dashboard;
- Fixed the duplicate display of extended field values in the console;
- Fixed the abnormal display after selecting "All Sources" in the blacklist configuration data source;
- Fixed the abnormal display of trace information in log details;
- Fixed the "service unavailable" display in scheduled report charts;
- Fixed the abnormal display of APM > Resource Call > Response Time Distribution;
- Fixed the issue where the alias could not be set for a bar chart using PromQL to query a metric without aggregation or grouping;
- Fixed the error when clicking the host details page in the Infrastructure of the Deployment Plan;
- Fixed the error in single group deletion in dashboards;
- Fixed the abnormal return result after changing the top value in the Top List chart settings;
- Fixed the issue where Profile data opened blank and could not be downloaded;
- Fixed the slow query alert caused by Redis hgetall slow log;
- Fixed the issue where the
label_valuesfunction was unavailable after upgrading the base version to 1.119.212, and view variables could not be saved after setting them; - Fixed the issue where the link in the Security Monitoring rule writing guide opened incorrectly;
- Fixed the error when querying external index logs;
- Fixed the issue of excessive data point fluctuations in the log query time series chart;
- Fixed the issue where the combined detection monitor had empty configuration when exported from workspace A and imported into workspace B;
- Fixed the abnormal display and drill-down issue in the Heat map.
October 22, 2025
Feature Updates
Open API
- Supports modifying the data storage policy duration;
- Supports log field global configuration > Key Field Configuration;
- Supports creating log indexes via API.
External API
DQL
- Added function
rate_over_sum(), which sums the field within the aggregation window, then divides by the window length (seconds) to calculate the average rate. The result is a float type. - Added function
rate_over_count(), which counts the number of non-null values of the field within the aggregation window, then divides by the window length (seconds) to calculate the event frequency. The result is a float type. - Added support for
count(*) / 1isyntax. - Example:
L::*:( count(*) / 1i ) [::1m]. Divides by the seconds of the time window size (1m) to calculate the log write QPS.
Plans & Billing
- Data Forwarding > External Storage Forwarding Traffic Statistics: Based on the current workspace, aggregates compressed forwarding traffic by external storage type, counts daily increments, and distinguishes between public and internal network traffic for billing. Click to view specific price details.
- Usage Analysis: Supports manually switching to the bill timezone (UTC+8) to resolve inconsistencies between the user's timezone and the bill timezone.
Monitoring
- Alert Policy: Added support for not sending notifications for recovery events: When enabled, all recovery conditions only generate events and do not send notifications.
- Monitors:
- Added Large Batch Alert Protection button: When the number of alerts generated by a single detection exceeds the preset threshold, the system automatically switches to status-based summary strategy: instead of processing alert objects individually, a small number of summary alerts are generated based on event status and pushed.
- Log Detection > Detection Metrics: Supports configuring multiple indexes.
- Interval Detection, Outlier Detection: Supports cross-workspace query for detection metrics.
Scenarios
- Histogram:
- Added support for metric data source queries.
- Controls the statistical dimension based on the BY field in the query condition, divided into "Global Statistics" and "Grouped Statistics":
- Without BY condition, performs global total statistics, calculating the distribution of the total data volume.
- With BY condition, groups by the BY field and then calculates the distribution of data within each group.
- Added X-axis and Y-axis configuration, allowing custom data display boundaries by setting maximum and minimum values.
- Time Series Chart: At a specific time point on the time series chart, you can click to select Fixed Time Marker. Once set, the marker does not change due to mouse movement, page scrolling, or switching time series charts.
- Composite Chart: Added an export button to export all chart information in one click.
- Charts > Links: When creating a new chart in a dashboard (existing charts remain unchanged), if the by field in the query condition meets specific conditions, the system will automatically enable the display of the corresponding link list.
- Reports: The original Real-time Reports and Archived Reports have been unified into Reports. All reports are archived for simplified management and viewing experience.
- Synchronously supports creating reports directly from the dashboard page, automatically bringing in the current view and time range.
- The Report Records page allows viewing historical archived data and directly sharing or deleting them.
Infrastructure
Hosts: Added Real-time Performance toggle. When enabled, the system refreshes every 10 seconds and automatically fetches the latest three metric fields: CPU usage, memory usage, and CPU load.
Explorers
- Global Configuration > Quick Filter Configuration: For RUM and Synthetic Monitoring explorers:
- The
sourcelist is displayed on the left, allowing simultaneous modification of multiple options in a popup. - When opened from different explorers, the corresponding
sourceis automatically selected.
- The
- RUM > Long Task Explorer > Details Page: Added Script details, displaying restored code.
- Time Widget: Added Play button. After selecting a time range, execute the query, and click the ▶️ button to quickly return to the most recent specified time range.
Snapshots
Supports re-editing saved snapshots.
Management
- Blacklist: Supports one-click enable/disable.
- Pipelines: Optimized template export format and updated the official template library samples.
- Role Management: Supports one-click export of roles.
- Data Forwarding: In addition to JSON text format storage, added support for Parquet data storage format.
LLM Monitoring
Added configuration steps for onboarding guidance.
New Integrations
- Added AWS CloudTrail integration;
- Added AWS CloudFront integration;
- Added AWS Athena integration;
- Added Alibaba Cloud NAS integration;
- Added Alibaba Cloud MQTT integration;
- Added Alibaba Cloud OceanBase integration;
- Optimized Kong integration documentation, added Tracing integration method;
- Optimized CSPM templates.
Bug Fixes
- Fixed the issue where after linking log field advanced configuration, members could not view the data and the timestamp variable was set incorrectly;
- Fixed the issue where already joined members could still receive invitation emails when calling the OpenAPI to invite members;
- Fixed the issue where data in the dashboard view was not expanded correctly;
- Fixed the incorrect format after exporting a CSV from a table chart;
- Fixed defects in the multi-step test creation flow;
- Fixed the issue where the return limit for query results in area charts, line charts, and bar charts in Metrics Analysis did not match the documentation;
- Fixed the issue where Profile could not be opened normally;
- Fixed the issue where adding a quick filter in the Explorer showed the field alias, but the alias disappeared after adding;
- Fixed the issue where scheduled report sending failed;
- Fixed the issue where after creating a new synthetic test, there was no synthetic test data on the platform, but self-observation logs showed related errors in kodo logs;
- Fixed the error when querying JSON format data using DQL;
- Fixed the issue where there was no data in the Action and View details of RUM;
- Fixed the issue where the right side of the API Keys management page did not display even though the role had actual permissions;
- Fixed the issue where scheduled reports could not be sent in the production workspace but could be sent in the test workspace;
- Fixed the issue where custom roles could not be deleted;
- Fixed Log Explorer related issues: including abnormal display of bar charts and data row counts, and inconsistencies between the number of searched items and the number of items listed below;
- Fixed the issue where clicking to view a shared snapshot showed no data;
- Fixed the "APM data empty result" issue;
- Fixed the issue where data forwarded to Kafka accumulated, causing the backuplog service to consume memory until OOM;
- Fixed the issue where the China map in the dashboard did not display provinces with data;
- Fixed the issue where the text chart in the panel moved to the top after refreshing;
- Fixed the slow loading issue when querying 5-minute logs;
- Fixed the incorrect escape of filter conditions when jumping to associated views from the event details page;
- Fixed the issue where the time window parameter affected the calculation results when querying data with DQL;
- Fixed the issue where data stored in guancedb-storage had a retention of 1 year, which did not meet expectations;
- Fixed the issue where filtering custom fields defined by the user in the Action did not take effect;
- Fixed the issue where changing the Webhook object address did not take effect correctly in alert events;
- Fixed Log Explorer related issues: including lag when scrolling down to view more details and query errors, and significant discrepancies between the status distribution chart results and actual data;
- Fixed the issue where cross-workspace trace queries only displayed data from the current workspace.
October 15, 2025
Feature Updates
Chart Queries
Expression Query: 1. Added a separate "Expression Query" input box for directly writing expression formulas; 2. All queries are automatically assigned a query identifier (e.g., a, b, c) before execution; 3. Compatibility Notes: - Sub-query identifiers (e.g., A, B) that already exist in historical charts cannot be reused by new expressions; - Existing expressions can still be queried normally, without affecting existing chart functionality; - It is recommended to use new query identifiers to reconfigure expressions when editing charts.
Data Forwarding
- Added support for forwarding data to Volcengine TOS, with five storage type options: Standard Storage, Infrequent Access Storage, Archive Flashback Storage, Archive Storage, and Cold Archive Storage, to meet storage requirements under different business scenarios.
- When the storage type of forwarded data is "Archive", supports restore tasks to thaw the data for access and analysis.
September 24, 2025
Feature Updates
Open API
- Added specified API Key creation permission for newly created workspaces;
- Added support for binding a specified billing center;
- Added support for cross-workspace authorization.
Security Monitoring
- Added CSPM detection type, supporting custom selection of detection types based on actual business scenarios (e.g., cloud resource protection, compliance auditing) to enrich detection coverage. Detection type descriptions:
- CSPM (Cloud Security Posture Management): Identifies misconfigurations (e.g., open high-risk ports, over-provisioned permissions) and compliance risks in cloud infrastructure, continuously assessing cloud resource security to reduce the risk of vulnerability exploitation.
- SIEM (Security Information and Event Management): Collects and analyzes security data from across the infrastructure, detecting threats and anomalous activities (e.g., abnormal login + bulk data export) through correlation event and log analysis.
- Official Detection Library experience upgrade: Detection rules now have a "Detection Library" identifier for easy identification of rule sources; also supports switching views in the template library to browse all detection rules, including monitors, in one go, improving rule search efficiency.
- Security Detection Rule editing experience optimization: Added "Trigger Detection Now" function, which can trigger detection tasks in real-time without waiting for the scheduled detection cycle, allowing users to quickly verify script effectiveness after writing/adjusting detection scripts and instantly view generated security signals.
Management
- Added Preferences for unified configuration of workspace language, theme mode, and detail page opening method;
- Member Management: Added support for exporting members;
- Invite Members: Added configuration for member's team and remarks.
Monitoring
- Monitors: Supports "Trigger Detection Now" when editing monitor rules;
- Mutation Detection, Interval Detection V2 support cross-workspace queries.
- Mute Rules support cloning.
APM
Added "Add Service" button on the service list page.
Synthetic Monitoring
When creating a new synthetic test, supports configuring the task execution frequency by entering a Custom crontab.
Incident
When an Issue is automatically discovered for the first time or manually created, the system supports AI intelligent analysis to automatically summarize the current Issue content.
Metrics
Generate Metrics: Supports Infrastructure and Resource Catalog data sources.
View Variables
Removed the original all values option, unified through * to meet multi-scenario filtering needs. Supports selective use based on different business scenarios, with specific effects as follows:
- Ignore this field filter: When * is selected, this field filter is ignored, and chart queries will not include the filter condition of this variable.
- Full-value filter (equivalent to original all values): When * is selected, all variable values are used as filter conditions (up to 100 values supported). Note: Too much data may affect performance; it is recommended to use selectively based on actual needs, avoiding indiscriminate full-value filtering.
Explorers
- Log Explorer: Index style adjusted, supporting one-click selection of all indexes, pinning indexes, and searching/locating by index name;
- All Explorers: Support Advanced Link Configuration.
- Added query acceleration configuration, which allows indexing frequently used filter fields in the Explorer's "Global Configuration" to improve query speed for those fields.
Time Widget
Added Quick Zoom Out function: One-click expands the current query time range to three times its original size, reducing manual time range adjustment steps and improving data exploration efficiency.
External Data Sources
Added support for SQL Server data source.
New Integrations
- Added AWS AOSS integration;
- Added AWS PCS integration;
- Added Alibaba Cloud CEN integration;
- Added Continuous Profiler JVM dashboard template (for analyzing Profile data);
- Added AWS WAF integration;
- Added FastDFS integration;
- Added Alibaba Cloud API Gateway integration;
- Added Alibaba Cloud Cloud Firewall integration;
- Translated AWS AOSS/AWS PCS views.
Bug Fixes
- Fixed the issue of adding tags to
df_labelin event content via central Pipeline; - Fixed the issue where workspace authorization deletion was unsuccessful;
- Fixed the display issue of database resources in the Resource Catalog;
- Fixed the issue where the number of hosts on the page decreased after clicking the sort button on the Infrastructure > Hosts page;
- Fixed the incorrect billing center username value for newly registered accounts;
- Fixed the internal system error when binding external indexes (TLS/ES);
- Fixed the error when creating a workspace;
- Fixed the error "Failed to create Func query task" when drilling down into Redis metric data;
- Fixed the issue where the Dashboard sometimes queried data successfully and sometimes returned an Internal Server Error;
- Fixed the issue where clicking on
container_crashrelated to K8s events in Infrastructure resulted in "View not found"; - Fixed the issue where the interface display for different versions of the Prometheus exporter collector in Integrations was the same;
- Fixed the issue where some fields were not displayed in the log stream chart unit settings;
- Fixed the inconsistency between Open API call results and documentation;
- Fixed the issue where the system view "APM P90 Resource Analysis View" did not contain charts;
- Fixed the issue where the alert policy did not successfully send emails to customers;
- Fixed the issue where the
key:valueformat in the JSON output of the event template did not follow the format displayed in the Explorer; - Fixed the false alarm issue caused by the host data reporting monitor;
- Fixed the 502 error when uploading SourceMap;
- Fixed the missing Webhook alert flow issue;
- Fixed the issue of abnormal fields when using DQL to query logs in a panel;
- Fixed the "unknown Scalar function" error in dashboard queries;
- Fixed the mismatch issue when switching DQL to simple query in a dashboard;
- Fixed the issue where the Studio dashboard > Pie Chart did not work properly in the Data Display module;
- Fixed the 400 error on the Metrics Management interface > Time Series page in the Hangzhou site;
- Fixed the incorrect text in the Integrations > Cloud Account Management;
- Fixed the incorrect RUM ERROR pattern analysis;
- Fixed the issue where RUM could not query Session and View data;
- Fixed the Warroom issues;
- Fixed the issue where filtering for entry type span resulted in no results in the list, even though the specified resource had both entry and exit span types;
- Fixed the issue where the service list display was incomplete.
September 3, 2025
Feature Updates
Security Check
The Security Check feature has been officially retired. Its related functionality can be achieved through Security Monitoring > SIEM module.
LLM Monitoring
Guance launches LLM Monitoring, providing "monitoring + tracing" capabilities for large model applications, eliminating the "black box" of model operation. It records input/output, tool calls, retries, latency, cost, and tokens for each call, using visual Traces and session-aggregated Sessions for replay and troubleshooting, achieving full-link transparent management. It now prioritizes support for Langfuse integration. If you are already a Langfuse user, you can quickly enable LLM monitoring capabilities.
Free Plan
For independent developers and small teams, Guance has added a Free Plan (Beijing) node. Under this node, you can register for a Free version (other sites no longer support creating Free Plan workspaces), covering key core functionalities.
Open API
Incident > Calendar: Supports adding parameters for getting calendars and filtering events.
Explorers
- Log Explorer:
- Added Advanced Link Configuration: Supports configuring jump links for individual fields, allowing direct opening of target pages from the current field, with parameter passing through variables for linked analysis.
- Log Explorer Display Items optimization:
- Added "Delete All Fields" and "Reset Fields" buttons;
- Added "Time Column" display toggle.
- All Explorers:
- Support DQL Query mode.
- Support searching events under a single IP field using CIDR function.
Event Center
- Events generated by SIEM rules (
security) support Obsy AI intelligent analysis on the details page. - No limit on
dimension tags, default support for jumping to Log/Trace Explorer.
Monitoring
- Alert Policy Management: In Rule Aggregation Mode, supports selecting "Send Only First Alert" to avoid missing important anomalous events while waiting for aggregation.
- Monitors > Event content supports defining domain variables:
df_studio_env_name: Current environment namedf_studio_console_base_url: Current environment console URLdf_studio_monitor_base_link: Current environment monitor URL
Management
Workspace administrators can disable AI Intelligent Analysis at the workspace level.
Metrics > Metrics Analysis
- Table Chart mode added Prom mode to display the return results of PromQL queries.
- Independent chart mode: Added chart title based on query conditions.
Infrastructure
Host and Container explorers support directly creating mute rules.
Synthetic Monitoring
Synthetic test: Request body content now supports multipart/form-data.
Sensitive Data Scanning
Supports covering all data types, no longer limited to scanning log data only.
Mobile RUM
Analysis dashboard added "Crash Analysis" and "Lag Analysis" tabs.
New Integrations
- Added Squid integration;
- Added Openresty integration;
- Added Kafka 4.0 integration;
- Added AWS MWAA integration;
- Added AWS Step Function State Machine integration;
- Added Alibaba Cloud GA integration;
- Updated Nginx tracing integration;
- Updated AWS OpenSearch monitor/view.
Bug Fixes
- Fixed the issue where aliases in grouped table charts in dashboards were not effective;
- Fixed the incorrect display of summary charts;
- Fixed the issue where Import Dashboard (multiple dashboards - zip file) displayed Chinese characters;
- Fixed the issue where clicking the funnel chart jumped to the session list, but the session replay displayed incorrectly;
- Fixed the issue where alerts were still sent even though mute was set;
- Fixed the issue where host tags were not displayed in Infrastructure;
- Fixed the issue where the Android Explorer had data, but the corresponding time period analysis dashboard chart did not display data;
- Fixed the issue where there were no connecting lines between services in the service topology map;
- Fixed the issue where incorrect alert mute configuration caused all alerts to fail;
- Fixed the issue where chart DQL statements could not find results;
- Fixed the error in synthetic tests in the Guangzhou site;
- Fixed the issue where importing templates in the Deployment Plan management console did not meet expectations.
August 13, 2025
Feature Updates
Open API
Supports customizing roles for Tokens.
RUM
To cover query scenarios for application data of different scales, the system has made optimizations for RUM data writes. Corresponding updates are as follows:
- RUM data query drill-down to application level:
- Explorer/Analysis Dashboard: Added application filter at the top, defaulting to "All Applications", supporting single or multiple selection; queries are triggered only after selecting an application.
- DQL query statements support single or multiple application queries; more usage instructions can be found in RUM Data.
- Existing users experiencing performance bottlenecks in application data queries can contact their account manager to enable the "RUM Data Table Splitting" feature in the management console. After creating a workspace, new users will have data written to separate tables automatically based on different applications.
Scenarios
- Scheduled Reports: Added "Archived Reports": Supports generating static snapshots of the full dashboard data on a set schedule (daily/weekly). Archived results are retained long-term, unaffected by dashboard configuration changes. Archived results can be viewed within the platform or sent as notifications according to configuration.
- Dashboard > Log Analysis: Added support for automatically bringing in the dashboard's view variables as filter conditions for display.
- Log Stream Chart: Supports querying data from all data sources on the platform.
Explorers
The search bar supports tokenized search using querystring(md5(xxx)). If data is MD5 encrypted and needs to be searched and located in the Explorer for scanned data, this method can be used.
DataFlux Func
To increase security for DataFlux Func (Automata), the following updates have been made:
- The "Reset Password" operation has been removed from the console Automata page, and the initial account password will no longer be sent to the email;
- For newly created Automata instances, login via the Func page is disabled by default; only authorized access via console user authorization is supported.
- Already installed Automata instances: After upgrading to version 7.2.0 or later, two login methods are supported:
- Authorized Studio users can log in directly via the console > DataFlux Func (Automata) interface;
- Users previously created in Func (including the initialized admin user) can log in via the Func page.
APM
- Traces > Waterfall Chart Details Page / Code Hotspots tab: Resources support one-click expand or collapse;
- Topology Map: Added support for displaying "P95 Response Time".
Synthetic Monitoring
- Synthetic Tests > Request Body: Supports configuring four types of dynamic variables:
- Added support for one-click cloning of synthetic tests.
Monitoring
- Threshold Detection > Detection Metrics: Supports selecting metric data across workspaces. After the monitor rule is successfully created, alert configuration across workspaces can be achieved.
- Monitor List: After quick filtering of monitors, supports cross-page select all and one-click export.
Events
For recovery events, added definition of df_fault_end_time extended field as the fault recovery time.
DCA
- Supports selecting all data in the list;
- Supports filtering conditions based on DataKit version (
datakit_ver), operating system (os), environment (env), etc.; - Added environment display in the list.
Management
- Role Permissions: Added "Client Token View" permission.
- Cross-workspace Authorization: When editing or deleting authorization rules, if the data scope or log index is reduced, a new popup appears after confirmation, displaying the names of affected monitors and data access configurations, and supports exporting the list as a CSV file.
- System Notifications: Added subscription type "Monitor": When a monitor fails, the system sends an email notification.
New Integrations
- Added AWS SSM RunCommand integration;
- Added AWS EBS integration;
- Added AWS ECR integration;
- Added AWS EFS integration;
- Added TDengine monitor;
- Added Milvus K8s view;
- Updated Azure cloud billing: EA architecture support;
- Rewrote OTEL JVM dashboard: 1._ and 2._ metrics are different (Java agent);
- Updated Huawei Cloud billing script: Fixed billing anomalies due to missing instance IDs;
- SIEM templates launched (10 AWS templates);
- Optimized AWS MemoryDB;
- Optimized Tomcat monitor;
- Optimized Tencent Cloud MySQL, supporting cloud disk version (cloud disk) node-level metrics and slow log collection;
- Optimized Alibaba Cloud Oceanbase collector, supporting supplementing tenant data.
Bug Fixes
- Fixed the slow log query issue recently;
- Fixed the inconsistency in data representation of resource objects;
- Fixed the issue where associated logs were displayed as 0;
- Fixed the error when clicking Code Hotspots after deployment;
- Fixed the abnormal data display after scrolling to the bottom of the log stream chart in a dashboard;
- Fixed the import error when importing a dashboard JSON with an
identifierset; - Fixed the incorrect jump location of the official Resource Catalog template library;
- Fixed the issue where sensitive data scanning configuration did not take effect;
- Fixed the issue where
count_distinctquery results were greater thancountquery results; - Fixed the issue where trace details page did not display data;
- Fixed the issue where a PromQL statement reported an error, but changing the query time range resolved it;
- Fixed the issue where the trace service name was not displayed correctly;
- Fixed the issue where Picture charts could not be modified;
- Fixed the issue where cloud billing could not be written in the production environment;
- Fixed the abnormal display of the service topology chart in the dashboard;
- Fixed the failure of site registration and activation;
- Fixed the abnormal display of the RUM funnel function;
- Fixed the issue where after importing a dashboard, there was a probability that the dashboard list was missing, requiring re-entering the page for full display;
- Fixed the misleading onboarding guide on the interface;
- Fixed the
406 - kodo APIerror when performing interface operations; - Fixed the issue where SourceMap file path, environment, and version were all correct, but the source code could not be parsed;
- Fixed the abnormal display of log index data;
- Fixed the issue of adding an APM onboarding page on the page;
- Fixed the issue where variables were displayed in the title after sharing a chart;
- Fixed the issue where the service context did not update when clicking different services on the trace flame graph;
- Fixed the abnormal data search issue when using fuzzy query for view variables in a dashboard;
- Fixed the issue where Pipeline script saving failed;
- Fixed the issue where the template did not take effect after adding a SEIM template, but the tags took effect;
- Fixed the topic 404 issue in the deployment plan's nsqd logs;
- Fixed the issue where the popular page performance overview did not display the loading time correctly;
- Fixed the issue where the .net profile data on the trace details page did not have a "View Details" button;
- Fixed the occasional issue where the same DQL expression query did not display data;
- Fixed the unstable display of infrastructure dependencies in APM;
- Fixed the issue where DQL subqueries did not take effect;
- Fixed the page error when performing mute operations on events in the Event Center.
July 23, 2025
Feature Updates
Monitoring
- SLO
- SLO scoring is performed at the second-level frequency;
- SLI events now display event information generated under the corresponding monitor;
- Details Page added a summary page, with relevant key metric charts linked to the time widget in the upper right corner for dynamic statistics.
- Added "SLO Correction" configuration. When SLO is about to be breached due to uncontrollable factors (e.g., infrastructure failure, third-party service outage), a temporary correction mechanism prevents false alarms while ensuring audit compliance of SLO data.
- Alert Policy
- Supports cloning alert policies;
- When configuring member-based notification rules, added support for one-click copy of member notification configuration.
Event Center
- The default Explorer page's time widget refresh interval is set to refresh every 30 seconds;
- Alert notifications on the details page no longer display the sending status.
Plans & Billing
- Usage Statistics: Added "Backup Log Increment" display to count the number of new backup logs per day;
- Usage Analysis: Default query time adjusted to "Today".
Core Components
- For Shortcut > Snapshot display page:
- Supports filtering by type;
- Supports batch delete operations.
- Explorers:
- Search bar:
- Recent query display count adjusted to 10, saved count adjusted to 50;
- Supports pinning query conditions;
- Quick Filter > Workspace Filter Items: When a field is configured, the system automatically adds an index. At the same time, an icon identifier is added for these fields in the Explorer search bar and chart query dropdown components.
- Details Page: Extended fields that have been added to the display column have an icon identifier added for differentiation.
- Search bar:
- Infrastructure
- Database: Added SQL Server data collection type. The details page can view all Table-related information, including columns, indexes, and foreign keys.
- Resource Catalog: Custom Object Explorer details page added a "Full Information" tab.
- Metrics: Metrics Management: Added display of "Unique Value Count" for tags, counting the distinct count of tag values globally or under a single metric dimension.
- Pipelines: One-click get sample: Supports specifying the data source to obtain test data.
- Scenarios > Top List: External data source queries support sorting.
- Management:
- Data Forwarding: Supports multiple filter conditions as OR;
- Token: When replacing a Token, added configuration to adjust permission scope, supporting use only for reporting.
- Sensitive Data Scanning: Custom rules support lookaround regex test matching.
- Support Center > Tickets: Added character limit for ticket descriptions.
New Integrations
- Added Huawei Cloud APIG integration;
- Added Huawei Cloud SFS Turbo integration;
- Optimized Alibaba Cloud ECS integration view;
- Updated AWS SQS integration;
- Tencent Cloud product collection optimization, supporting multi-dimensional metric collection (Cloud Monitor V2);
- EIP, COS, MySQL, PostgreSQL, MariaDB, TDSQL-C MySQL, TDSQL-C PostgreSQL, Redis, KeeWiDB, MongoDB, Memcached
- Format adjustments for Huawei Cloud integration related documentation.
Bug Fixes
- Fixed the issue where manually changing the status of an Issue created by automatic discovery prevented creating a new Issue;
- Fixed the abnormal display of the log explorer status distribution chart;
- Fixed the issue where Session Replay displayed as expired;
- Fixed the issue where the Event Center displayed no data after switching to list mode;
- Fixed the abnormal front-end display of event data;
- Fixed the abnormal display of Resource data in the RUM explorer;
- Fixed the error when querying forwarded data;
- Fixed the abnormal
/api/v1/inner/alert_opt/getand/api/v1/account/listinterfaces in the Deployment Plan; - Fixed the issue where the trace-associated Pod monitoring view template was not updated;
- Fixed the abnormal display of data range filter in Data Access;
- Fixed the issue where the time range returned by PromQL slicing by 1d in a time series chart > bar chart was incorrect;
- Fixed the issue where data existed in the hourly interval but not in the daily interval for PromQL queries;
- Fixed the issue where the webpack plugin showed SourceMap file upload successful, but the file could not be viewed in the SourceMap list;
- Fixed the issue where Issue automatic discovery in Incident created duplicate Issues;
- Fixed the issue where the Prometheus function
ideltadid not behave as expected; - Fixed the large discrepancy between Log Explorer query results and DQL query results under the same query conditions;
- Fixed the issue where
df_labelwas set in the monitor, but the generated event did not havedf_labelvalue, causing the user's mute strategy to not take effect; - Fixed the issue where the IP field in RUM was not effective in the Pipeline;
- Fixed the error after upgrading kodo-x in the private environment;
- Fixed the issue where the trace details showed "Top-level Span Missing", but the top-level span actually existed;
- Fixed the issue where the application data could not be queried in the RUM > Application List;
- Fixed the issue where the Plans & Billing page in the workspace did not show the consumption details;
- Fixed the issue where pressing Enter after entering the snapshot name in the save snapshot dialog would save directly;
- Fixed the issue where the monthly log bill usage was 0 but the deduction was still made;
- Fixed the judgment issue in displaying
src_ipanddst_ip; - Fixed the occasional display error of the log explorer bar chart within the same time range;
- Fixed the usage issue of the search function in Incident;
- Fixed the issue where the "follow direction" option was checked in a synthetic monitoring task, but the configuration did not take effect and was cleared when re-editing;
- Fixed the inconsistency between the count of log index queries over multiple days and the TLS count.
July 9, 2025
Feature Updates
Plans & Billing
- Launched a new billing model: Enterprise Plan. This model uses a data traffic + total storage combination billing, more accurately aligning with actual resource consumption in scenarios with extremely high log write volumes, making cost structures more transparent and predictable. This model provides optimized cost efficiency for handling massive observability data and is a foundational capability for building a "domain-wide controllable enterprise-level observability hub".
- In Enterprise Plan workspaces, data storage policies support custom configuration;
- To upgrade from Free Plan to Enterprise Plan, please contact your account manager.
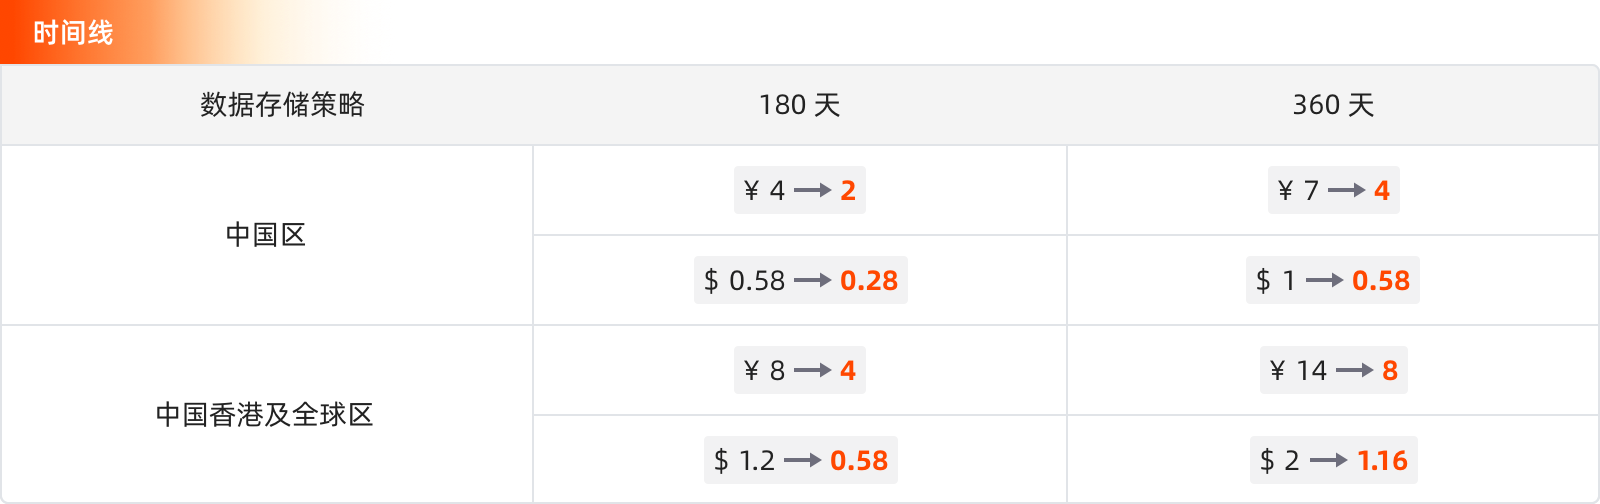
- Commercial Plan:
- Billing item names for Usage Statistics and Usage Analysis adjusted;
- Price adjustments for Commercial Plan Time Series 180-day and 360-day retention.
Monitoring
- Monitors > Threshold Detection: Detection metrics support querying external data sources;
- Monitor List: Supports searching and locating by monitor ID.
Event Center
- Added Display Items: Supports switching between standard and list mode display.
- Change Events > Details Page: Basic Attributes adjusted as follows:
- Change Content: Displays
df_messagecontent, recording the detailed description of the resource change; - Difference Comparison: Displays
diffcontent, recording the difference text of the resource change.
- Change Content: Displays
Scenarios > Charts
- SLO Chart: Locked time added "This Year" dynamic time option;
- Heatmap:
- Added "Metric" data source type query;
- Added Y-axis configuration, supporting Y-axis calculation based on data.
Infrastructure
- Network > Summary
- Supports custom analysis dimensions: by selecting the query fields for source and destination, aggregated query data is displayed;
- Supports cross-workspace network data queries.
- Database:
- Added integration for Oracle database;
- For PostgreSQL databases, can view all Table-related information, including columns, indexes, and foreign keys.
Metrics
- Generate Metrics: Supports different generation rules specifying the same metric name and tag;
- Metrics Management: Added multi-dimensional time series analysis at the measurement level.
Deployment Plan Updates
Workspace List > Index Configuration: Supports configuring data storage policies.
New Integrations
- Added OpenLLMetry integration;
- Added Undertow integration;
- Added Cloudflare integration;
- Added Huawei Cloud CDM integration;
- Added Huawei Cloud DWS integration;
- Added Huawei Cloud NAT integration;
- Added AWS Transit Gateway integration;
- Updated Volcengine ECS monitor, view;
- Updated MinIO view, monitor;
- Optimized integration for Huawei Cloud ASM / CCE;
- Optimized integration for Alibaba Cloud SAE;
- Optimized integration for JMX / MQTT.
Bug Fixes
- Fixed the 404 error when accessing Session Replay data via a tokenless login URL in the SaaS environment.
- Fixed the issue where the Issue automatic discovery configuration content was not recognized in RUM.
- Fixed the issue where the event details from synthetic monitoring alerts did not display specific associated information.
- Fixed the issue where modifying the tag name after adding a tag in the global tags showed a duplicate tag name prompt.
- Fixed the abnormal return results of DQL queries.
- Fixed the issue where PromQL metric queries failed, but DQL queries worked normally.
- Fixed the issue where viewing Deployment > Pod information was scrambled in a multi-cluster scenario.
- Fixed the abnormal display of the log status distribution chart.
- Fixed the issue where the RUM filter time range did not match the time selector, preventing application data from being viewed.
- Fixed the issue where the Issue automatic discovery template variables did not take effect in the RUM Error explorer.
- Fixed the "Invalid address" error when adding a Webhook notification target.
- Fixed the accumulation of forwarded data in the base.
- Fixed the abnormal display of the log status distribution chart.
- Fixed the frequent false alarms caused by DQL query data being 0.
- Fixed the inability to sort, invalid
slimit, and pagination issues when querying logs in the base query tool. - Fixed the issue where time series not constrained by filter conditions and without any tags appeared in time series queries.
June 25, 2025
Breaking Changes
Extracted df_meta fields df_check_targets, df_check_condition, df_check_rules from the event to the same level. In subsequent webhook notifications, when df_source = monitor, the detection time, detection metrics, detection count, detection rules, and other information from the monitor configuration will be displayed.
Feature Updates
External API
- Added
index_list_infointerface to query workspace index information list; - Added
update_index_settinginterface to modify workspace index configuration.
External Data Sources
Added three external data source types: PG, Oracle, and Clickhouse, to meet broader data scenario needs.
Logs
Added Direct Write Index type, which can directly specify the index for writing during data collection, achieving precise classification and storage.
Monitoring
- Interval Detection V2 supports detection of APM and RUM data types;
- Mutation Detection > Event Content: Added
df_check_detailextended field, supporting output of mutation comparison original values to event details.
Events
- Alert events triggered by monitor configuration rules support Obsy AI intelligent analysis.
Infrastructure > Database
- Added PostgreSQL database integration;
- For MySQL databases, can view all Table-related information, including columns, indexes, and foreign keys.
Explorers
Search bar added Query History display, which can be directly reused and flexibly modified by clicking.
Cloud Account Management
Added support for Tencent Cloud and Azure account types.
Scenarios
- Adjusted the Import Dashboard entry, integrating the original custom template import function and supporting batch import of dashboards.
- Dashboard page added Log Analysis function, allowing one-click viewing and analysis of related log data in a new slide-out page without leaving the page.
Incident
A new "Incident Management" entry has been added to the left menu bar under "Incident", which directly jumps to the management page.
New Integrations
- Added Volcengine NAT integration;
- Added Ceph integration;
- Updated Clickhouse integration;
- Optimized Huawei Cloud billing script;
- Added Tencent Cloud billing;
- Added Tencent Cloud WAF integration;
- Added Tencent Cloud ES integration;
- Added English version views and monitors for Tencent Cloud
cos/cdb/mariadb/postgresql; - Added AWS Firehose;
- Added AWS VPC NAT Gateway integration documentation;
- Updated AWS cloud billing script: T+1 calculation method caused billing discrepancies for some components (e.g., EC2), adjusted to T-2;
- Added Azure cloud billing.
Bug Fixes
- Fixed the abnormal data display after generating metrics;
- Fixed the issue where log content could not be loaded after clicking "Load More" on the log details page;
- Fixed the issue where the RUM activation link was invalid and had no pricing information;
- Fixed the issue where clicking on the associated event in an Issue and jumping to it could not query the data;
- Fixed the 406 error when creating a new infrastructure liveness detection v2 monitor;
- Fixed the slow loading of the Session Replay page;
- Fixed the issue where the Open API did not automatically generate a rule name when creating a mute rule;
- Fixed the error when entering a PromQL query for metrics;
- Fixed the abnormal display of the page error rate;
- Fixed the frequent disappearance of host tags;
- Fixed the issue where descending order had no effect after adding a search condition to the resource call top list;
- Fixed the issue where unchecking the 7-day MFA exemption and then unbinding MFA and logging out did not prompt the user to re-bind;
- Fixed the incorrect rendering of aliases in the CSV file exported from dashboard data due to empty aliases;
- Fixed the issue where the monitor did not generate alerts normally, and self-observation logs showed query timeout errors;
- Fixed the issue where imported fields in the backend management were automatically deleted;
- Fixed the issue of user experience data loss.
June 11, 2025
Feature Updates
Plans & Billing
Added statistics items: Trace write traffic, RUM write traffic, SIEM scan volume; Usage Analysis synchronously displays the new statistics item data.
Scenarios
Dashboard > AI Intelligent Analysis: Added support for automatic error discovery and error analysis, further enhancing Obsy AI data processing capabilities.
Monitors
- Detection frequency supports a minimum custom input of 20s, and the system now supports selecting 30s;
- APM metric detection and RUM metric detection support multi-selection of
servicesandapplicationsrespectively.
SIEM
Official Detection Library launched: The system provides out-of-the-box security information detection template libraries.
Infrastructure > Database
- Supports cross-workspace data viewing;
- Added fields:
QPS,TPS,Average Query Latency,Slow Query Log Status,Slow Query Count.
Metrics > Metrics Analysis
- Added Independent Chart mode, suitable for scenarios where multiple queries are added simultaneously and the query result units are inconsistent;
- Added support for displaying the total grouped count, and the default
slimitis changed to 50.
Logs > Explorer
- Stacked Mode added a line break toggle;
- Context logs support ascending/descending sorting by clicking the
Timecolumn.
Cloud Account Management
Cloud Account type added support for Huawei Cloud.
Management > Environment Variables
RUM Android/iOS SDK supports dynamic updates via environment variables.
Query Tool
- Both the table chart and the simple query in Metrics Analysis support selecting multiple columns;
- DQL quick query defaults to simple mode, supporting multi-column configuration queries.
APM
ddtrace added package-level instrumentation configuration. For example, to instrument all methods under the packages com.zy and javax.servlet, configure as follows:
-Ddd.trace.method.packages=com.zy,javax.servlet.
Deployment Plan Updates
- Mapping Rules added "Append Mapping" toggle. When enabled, accounts using single sign-on will be assigned workspaces and roles according to the mapping rules, while the original workspaces and roles remain unchanged.
- For workspaces using the ScopeDB engine, supports configuring tenant-level queries.
New Integrations
- Optimized Tencent Cloud billing script, supporting sub-account method to obtain billing information;
- Added Tencent Cloud billing integration;
- Added Tencent Cloud EIP integration documentation;
- Added Tencent Cloud CDB monitor (English);
- Added Huawei Cloud billing integration;
- Updated AWS ELB integration content;
- Updated AWS Lambda integration content;
- Updated AWS S3 integration content;
- Added AWS Aurora MySQL integration;
- Added AWS Aurora PostgreSQL integration;
- Added HikariCP integration;
- Optimized TiDB Cloud view;
- Added VPC integration;
- Added AWS RDS PostgreSQL integration.
Bug Fixes
- Fixed the issue where
useridwas not displayed in theresourceexplorer in the Singapore site user workspace; - Fixed the issue where the custom-reported
useridcould not be queried through theactionexplorer; - Fixed the inaccurate AI analysis results in the dashboard;
- Fixed the issue with Open API for getting time series trend charts;
- Fixed the issue where the content display had a delay in the monitor modification page data gap;
- Fixed the issue where the
webpack pluginskipped existing files when uploading SourceMap; - Fixed the error in the quick filter under the Network function;
- Fixed the issue where the filter through variables did not work correctly;
- Fixed the high-risk vulnerability in penetration testing;
- Fixed the error in the resource analysis section of the RUM analysis dashboard in the Singapore site;
- Fixed the issue where the
undefinedvariable value appeared in the panel link jump; - Fixed the issue where the time selection box was missing in the upper right corner of the Log Explorer;
- Fixed the issue where the preview chart data in the monitor (APM) did not match the actual data;
- Fixed the display issue regarding DingTalk and WeChat in the cross-workspace authorization email;
- Fixed the inconsistency between the user list and user details for SSO users in the management console;
- Fixed the display issue with external database data source queries;
- Fixed the trend chart display issue when creating a new threshold monitor;
- Fixed the search failure when viewing services in APM;
- Fixed the error in DQL queries;
- Fixed the issue where the daily recurring mute rule did not send the mute notification as expected;
- Fixed the issue where the AI analysis button could not be viewed after entering the trace from RUM Session Replay.
May 28, 2025
Open API Updates
Incident now supports returning the count of associated events when listing and getting.
Feature Updates
SIEM
- Detection Rules: Added test and full-screen edit script functions;
- Added Signals explorer;
- Added Execution Logs explorer.
Monitoring
- Alert Policy > Association: Added selection of SIEM detection rules, with synchronous support for direct creation.
- Editing Monitor Rules > Detection Metrics added support for PromQL query preview.
- Monitor Rules list:
- During import, added support for "Delete and import monitors with the same name" on the operation page;
- Supports one-click export of all monitor rule configurations in the current workspace.
- Intelligent Inspection feature entry is retired.
Infrastructure
- Containers: Added Persistent Volume Claims Explorer.
- Added Database Explorer, providing a centralized explorer tool for real-time monitoring of MySQL database performance metrics, resource usage, and log records.
- Resource Catalog: Resource classification added database, displaying the total number of all databases.
Incident
- Channel > Issue Details Page: Added "Associated Events", which can be clicked to jump directly to the event list for viewing; the notification events (e.g., Issue emails) sent also synchronously display associated events.
- Notification Policy > Issue Escalation: Added the Event Storm option. You can set the system to send "Repeat" or "One-time" notification reminders after the cumulative number of associated events for an Issue exceeds a specific count.
Events
Unrecovered Events: - Added "Mute" button. Clicking it allows direct configuration of the "Mute" rule on the current page. - Added "Recover All" button. Clicking it recovers all abnormal events under the current list, with the option to associate with Issues.
APM
Flame Graph: Added "Locate to current Span" function button.
RUM
- WEB SDK added client timezone recording.
- Session Replay view page added client timezone display.
- All time widgets uniformly added timezone display.
Scenarios
- Dashboard > Obsy AI Intelligent Analysis:
- Optimized page display effect;
- Optimized question output.
- Charts
- Time Series Chart: Added prompt: Query has exceeded the maximum number of time series, only displaying 1,000 data points;
- Bar chart mouse hover color adjusted;
- Table chart order optimization: Compatible with PromQL queries.
Metrics
Metrics Analysis: Added query history and unit configuration.
Management
- Sensitive Data Masking: Supports one rule for masking multiple fields.
- Data Access: Edit page added access site selection.
Explorers > Quick Filter
- All Explorers:
- In Edit Mode, supports modification of "Filter Fields" and "Optional Fields";
- Added hide field alias function;
- When searching for a field, if there is no exact match in the query results, you can directly create and add it to the "Filter Fields".
- Log Explorer:
- Two View Modes display adjustments, adding "Global Configuration" in "Stacked Mode";
- Display Item Configuration adjusted.
Registration
Login and registration page display optimization.
Deployment Plan Updates
Configuration Management > Issue Discovery: Rule detection frequency added support for 1 minute.
New Integrations
- Added TiDB Cloud integration documentation;
- Added Traefik integration documentation;
- Added AWS Cognito integration;
- Added AWS Certificate Manager integration;
- Added AWS RDS PostgreSQL integration documentation;
- Added Aliyun RabbitMQ integration;
- Updated HAProxy view and monitor;
- Added Huawei Cloud DIS English monitor, view;
- Updated AWS ELB Application integration documentation, view, and added AWS ELB Application monitor;
- Updated AWS Lambda integration documentation, added Lambda fetch S3 log data operation steps.
Bug Fixes
- Fixed the issue where generated metric data was not reported correctly.
- Fixed the issue where tag import failed when calling the Open API to import monitors.
- Fixed the issue where synthetic tests did not stop.
- Fixed the 406 error when clicking "Context Logs" in the log details.
- Fixed the cache issue where
alertPolicyMemberInfosshowed existing members even when only notification targets were configured (not members) in the monitor. - Fixed the issue where saving the "treat result as 0" option for data gaps in the monitor did not take effect.
- Fixed the failure and error when batch recovering alerts.
- Fixed the inconsistency in the number of query results in the Log Explorer.
- Fixed the issue where the
extendandrulefields were not configured when batch modifying monitors via API, causing the original data to be overwritten. - Fixed the issue where imported built-in view templates were not correctly replaced in the backend management.
- Fixed the issue where after one-click extracting key fields in the log index configuration, the Log Explorer stacked mode did not display the key fields as configured, but instead displayed based on display items.
- Fixed the
criticallevel error in the monitor execution log. - Fixed the issue where DQL subqueries did not work.
- Fixed the issue where commas in variable values were not escaped when clicking the top list view and applying to view variables, leading to incorrect filter conditions.
May 14, 2025
Brand Logo Change
Guance unveils a new visual identity, reflecting its commitment to iteration and technological strength in the wave of AI.
From now on, Obsy will accompany you in gaining insights into the data world, managing system complexity, and staying at the forefront of the AI era.
External API
Dashboards: Supports global import of platform-level dashboards via identifier ID. This operation only updates the dashboard configuration and does not affect the binding relationship of this view in each workspace.
Feature Updates
Security Monitoring
Added SIEM module: Real-time analysis of logs and event data from various enterprise systems (e.g., servers, applications, network devices), automatically discovering potential threats, helping teams quickly locate anomalies, and acting as a security monitoring hub.
Monitoring
- Alert Policy:
- Association: Supports selecting SIEM detection rules;
- Notification Configuration: Added Security Monitoring level.
- Monitors: Due to changes in the data write for "Infrastructure Change Detection Monitors", old monitors need to be re-saved to avoid affecting the generated event display.
Event Center
- The "Events" module has been renamed to "Event Center", with an optimized interaction page.
- Added Event Center explorer, supporting centralized viewing of all event data.
- Event recovery added a secondary confirmation operation to avoid accidental triggers.
Incident
After adding a shift schedule in Incident > Calendar, when creating a new Issue or assigning a responsible person, you can select "On-Call Person" or "Notification Target". The system will automatically assign the Issue responsible person based on the on-call person of the day and notify them.
Scenarios
- Dashboard: Added Obsy AI Intelligent Analysis function.
- Time Widget logic optimization: When selecting "Relative Time", even if the user sets the refresh frequency to "off", the system will still re-trigger the query if the query conditions change (e.g., adding/removing conditions in the quick filter in the explorer, adjusting filter conditions in the search box, or switching view variables in the dashboard/notes).
Management
- Data Forwarding: For the three archive types of AWS S3, Huawei Cloud OBS, and Alibaba Cloud OSS, added Encrypted Storage toggle. When enabled, data forwarded externally will be encrypted.
- Audit Events: Added workspace field marking.
Infrastructure
- Host, Container, Pod, etc. details page built-in pages:
- Time Widget: Added Pin function;
- Integration Status: View Monitoring View page optimized;
- Associated Views added a timeline display of current events.
- Host Explorer: Default query time adjusted to "Last 2 Hours".
Logs
Optimized log multi-index match hit logic to avoid computation waste caused by matching index rules one by one.
Deployment Plan Updates
- Supports creating, deleting, and modifying groups via External API, as well as adding or removing users from groups;
- Workspace Management > Data Storage Policy: Added network storage policy configuration, supporting a fixed 2-day storage duration or custom retention period.
- Added dynamic parameter toggle for Profile data reporting. Users can dynamically enable or disable Profile data reporting based on platform performance.
- Added API Key configuration and AI function access link configuration toggle, including the following scenarios:
- Monitor > Alert Policy > AI Alert Aggregation
- AI Write Pipeline entry
- Scene > Chart Component > AI Chart Title and Description Generation
- Log Explorer > Log details with status error, Logs > Error Tracking > AI Error Analysis entry
- RUM > Error Explorer > AI Error Analysis entry
- APM > Trace Explorer > Trace details with status error, APM > Error Tracking > Trace Details > AI Error Analysis entry
- When editing an alert policy, supports custom repeat alert time. Example format for custom mute time input: 20m (20 minutes), 2h (2 hours), 1d (1 day).
New Integrations
- Added host-type monitors;
- Added MySQL monitor;
- Updated CouchDB view and monitor;
- Added ActiveMQ integration;
- Added AWS SNS integration;
- Added Volcengine ESCloud integration;
- Added English version of Huawei Cloud API, Huawei Cloud CCE monitor and dashboard;
- Added Volcengine RabbitMQ integration;
- Modified AWS MSK integration metrics.
Bug Fixes
- Fixed the 413 error when uploading SourceMap via Vite bundling, the SourceMap download error, and the issue where Guance could not display the source code error location.
- Fixed the issue where RUM data from multiple workspaces could not be displayed correctly during cross-workspace queries.
- Fixed the inaccurate display of namespace and service data after selecting a self-built log index in the Log Explorer.
- Fixed the page layout disorder when creating a multi-step synthetic test.
- Fixed the issue where the quick filter column could not display the namespace tag data correctly in a multi-index scenario in the Log Explorer.
- Fixed the false positive alert issue in the Guangzhou site.
- Fixed the error when viewing host details with managed Doris in version 0409.
- Fixed the abnormal query data issue when viewing external data sources.
- Fixed the ghosting display issue when expanding a single log in clustered mode.
- Fixed the issue where the event statistics page still displayed recovered events.
- Fixed the error triggered by clicking the "Batch" button in the unrecovered events list mode.
- Fixed the issue where the "Data Forwarding" function could not query historical logs on S3.
- Fixed the issue where the log reported by the Func alert message in the Volcengine base version 1.109.196 was sent to the business workspace.
April 23, 2025
Breaking Change
Synthetic test data storage adjustment: Synthetic test data has been separated from the original log index, stored in a dedicated table, and a new dedicated query Namespace D has been added. This adjustment does not affect historical synthetic test data. If you previously queried synthetic test data through custom charts, please update the query configuration promptly. The official synthetic test templates (e.g., HTTP, ICMP, TCP, WebSocket, Multistep Tests) and related monitors and metric rules have been adapted to this change.
External API
- Supports adding and modifying interfaces for listing roles and members in a specified workspace;
- Optimized interface names and descriptions in OpenAPI and External API.
Feature Updates
RUM
- SDK supports environment variable hot update: By pre-defining variable parameters, the configuration is dynamically updated by importing variables through environment variables within the application.
- Application > New Application: When users configure custom parameters, the code example on the left will update in real-time, and the system will cache the latest parameter configuration, eliminating the need to re-enter each time.
- Error Explorer: Added support for Obsy AI Error Analysis. Performs intelligent analysis on a single RUM error log, automatically extracts key information, and obtains preliminary troubleshooting ideas and suggestions through integrated online search.
Infrastructure
- Cross-workspace Authorization: If an authorized workspace exists and the authorized data type is "Basic Objects", you can directly switch workspaces on the Infrastructure object type explorer pages to view object data across spaces.
- Added Change Events tab, supporting display of change details based on five object types: Deployments, Daemonsets, Services, Cron Jobs, and Statefulsets, facilitating user backtracking of change records.
Monitoring
- Monitors > Detection Rules: Added Infrastructure Change Detection. By continuously monitoring Kubernetes resource configuration changes (e.g., YAML file modifications), combined with version tracking and intelligent analysis, it achieves compliance checks, fault root cause location, and resource usage optimization, ultimately ensuring cluster security, stability, and resource efficiency.
- Detection Rules > Event Content > Custom Event Notification Template: Added time auto-conversion template function
{{ df_fault_duration | to_date_range_human }}.
Events
- Added Change Events:
- View all event data records triggered based on Infrastructure Change Detection rules.
- All Event Details > Historical Trend: When the detection object has a change event, the time series chart will display the time node of the change event, and support clicking to jump to the change details page.
- Event Explorer:
- Added "View Only Unassociated Issues" button, clicking it quickly filters associated events;
- Added Display Items: Supports display preference switching (including list, standard, and extended modes).
Management
Data Forwarding > Data View: Search component optimization.
Chart Export
Charts support exporting to a newly created dashboard or note synchronously. Applicable scope includes: 1. Metrics Analysis 2. Explorer > List/Dimension Analysis
Explorers
- Interaction adjustments for basic "List" view and "Dimension Analysis" chart mode;
- Dimension Analysis: Added grouped table chart.
Integrations
In the left menu of the console, the access path for the "Cloud Account Management" function has been moved from the Management interface to the Integrations directory.
Deployment Plan Updates
Supports adjusting the order of Login Methods (Local Account, LDAP Account, OIDC).
New Integrations
- Added Apollo;
- Updated Argocd integration documentation, adjusted to use
kubernetesprometheusto collect metric information; - Updated Ingress Nginx documentation view monitor;
- Neo4j updated dashboard & added monitor;
- Added Kubelet integration;
- Added Azure Virtual Network Gateway integration;
- Updated TiDB integration documentation, view, and monitor;
- Added Automata management for 30 Alibaba Cloud components.
Bug Fixes
- Fixed the incorrect member count display on the member management page.
- Fixed the issue where the log view time field was not translated when switching to the English interface.
- Fixed the abnormal label display when switching clusters.
- Fixed the issue where the number of jank occurrences on the RUM > Analysis Dashboard > Mobile > Error Analysis page affected the user count display when the mobile SDK was not integrated.
- Fixed the timing judgment issue in the Log Explorer > Details page.
April 9, 2025
Open API Updates
- Supports creating, editing, and deleting multi-step synthetic tests;
- Supports configuring workspace count limits.
Feature Updates
Scenarios
- Chart Optimization
- Bar Chart:
- Adjusted Alias position, supporting listing all metrics and groups;
- Added X-axis configuration item.
- Grouped Table Chart:
- Supports sorting based on grouping selection;
- Added 200 option in the return count dropdown, supporting manual input of max count adjusted to 1,000.
- Time Series Chart > Line Chart: Added line "Style" settings, including Linear, Smooth, Step-Start, Step-End.
- Bar Chart:
- Snapshots: Added permission prompt for Dashboard Snapshot sharing with configured permissions.
- Explorer, Dashboard > Time Widget: Added "Last 1 Minute", "Last 5 Minutes", default selected to the latter.
Management
- Cross-workspace Authorization: Supports cross-site data authorization for expanded data sharing.
- Data Forwarding:
- Data type added "Audit Events".
- Adjusted the query time logic of the explorer:
- Changed to query by day, does not support cross-day queries;
- When viewing forwarded data, the system automatically queries and continuously loads until fully displayed, without requiring manual user action;
- Management > Workspace Settings > Advanced Settings: Added "Data Forwarding Query Duration" configuration.
- Data Access, Pipeline, Blacklist permissions split: "Manage" permission adjusted to "Create, Edit" and "Delete".
Monitoring
- System Notifications: Added jump link for associated logs, allowing jump to the Log Explorer and filtering logs for which this notification target failed to send.
- Monitors:
- Create from Template > Official Template Library: Added search function;
- Configuration Page > Event Content: Updated note prompt. The
@ memberconfiguration only takes effect when associated Incident is enabled, and the event content is sent to the specified members. - Threshold Detection: Added Recovery Conditions toggle, configuring recovery conditions and severity. When the query result has multiple values, if any one value meets the trigger condition, a recovery event is generated.
Incident
The "Source" in Issue email notifications has been changed to a hyperlink; users can click to access directly.
RUM
SourceMap: - Page interaction adjusted, changed from popup to a separate page; - List page added search and export functions.
Obsy AI
Optimized Generate Chart function: by caching metric management data in local Func, the generated DQL is more closely aligned with the semantic description.
Obsy AI Error Analysis
Added context support for root cause analysis, helping users understand the context of an error occurrence faster and more comprehensively, improving diagnostic efficiency.
Integrations > Extensions
DataFlux Func (Automata) / RUM Headless: Application billing added email reminder and system notification.
Infrastructure
Host > Details Page: Disk capacity statistics distinguish between local and remote disk display.
Deployment Plan Updates
Template Management: - Page interaction optimization, including "Template Type" added to display columns, etc.; - Added "Template Type" in the top filter items; - Supports batch export of templates; - Supports preview of template details when importing templates; - Built-in view, Pipeline, and monitor template uploads support same-name overwrite logic.
New Integrations
- Added GCP Compute Engine;
- Added Azure Storage;
- Added Azure Redis Cache;
- Added Azure Kubernetes;
- Added Azure PostgreSQL;
- Added Alibaba Cloud RDS MySQL Automata integration;
- Added Druid integration;
- Updated Trino;
- Adjusted AWS/Alibaba Cloud Automata integration documentation: Added "Automata Activation Script" step.
Bug Fixes
- Fixed the inconsistency between the unrecovered events obtained by calling Open API and the actual data.
- Fixed the error when searching in the Event Explorer.
- Fixed the abnormal query data issue for external data sources.
- Fixed the issue with Incident email notifications.
- Fixed the slow loading of the Incident > Analysis Dashboard.
- Fixed the incorrect color display in bar charts.
- Fixed the issue where external events indicated no AK.
- Fixed the incorrect display of the status distribution chart and log volume.
March 26, 2025
Feature Updates
Events
- Unrecovered Events: Time widget defaults to auto-refresh; after manual recovery of events, a front-end page prompt is added.
- Event Details: Alert notification page display optimized.
- Events, Intelligent Monitoring explorer export appended "Whether Notified" display.
Management
Data Forwarding: Added permission configuration. By setting view permissions for forwarded data, data security is effectively improved.
Monitoring
- Infrastructure Liveness Detection V2: Added configurable detection interval.
- Alert Policy: Notification matching logic adjusted to improve execution efficiency when events hit multiple policy groups and complex alert policy scenarios.
- Notification Target Management: Added Slack and Teams notification targets to meet the needs of more global users.
Scenarios
- View Variables: Supports external data source queries.
- Charts:
- Added Monitor Summary chart, integrating the monitor list, displaying the latest status for instant monitoring and anomaly situation awareness.
- Command Palette: Display optimization;
- Chart Query: In DQL queries, when using "wildcard" or "regex", added query suggestion prompts.
- Explorer, Dashboard > Time Widget: Added "Last 1 Minute" and "Last 5 Minutes" options.
Plans & Billing
- Added Monthly Bill module, intuitively displaying monthly consumption totals.
- Added bill export function.
RUM
Application List > New Application: Added "Compressed Upload" and "Custom Hosted URL" parameter configuration.
Synthetic Monitoring
Added "South Africa" and "Hong Kong (China)" as synthetic test nodes, further expanding global coverage.
Logs
- Log Explorer
- Quick filter operation items adjusted;
- List tokenization logic optimized;
- JSON format data added JSON Search;
- Index > Key Fields: Added One-Click Extract.
New Integrations
- Added Azure Network Interfaces;
- Added Azure Kubernetes;
- Added Azure Virtual Network Gateway;
- Improved English integration translations.
Bug Fixes
- Fixed the low utilization display issue on the log page.
- Fixed the metric unit display issue in Service Map.
- Fixed the inability to select units for multiple columns in a table chart.
- Fixed the error when exporting a CSV from a dashboard > log stream chart with a number other than 1,000.
- Fixed the inconsistency between P75 and DQL query results on the most popular pages.
- Fixed the issue where the time filter still showed "Today" after clicking the
<<button. - Fixed the issue where menu management did not meet expectations.
- Fixed the abnormal filtering when searching for space IDs in the management console.
- Fixed the issue of missing test samples on the Pipeline interface.
- Fixed the long time consumption when exporting configuration migration.
- Fixed the issue of many empty items in the quick filter tags on the event details page after an upgrade.
- Fixed the issue where the detection library list in the official monitor template library was duplicated, and selecting a detection library prevented searching for other monitors.
March 12, 2025
Breaking Changes
The df_alert_info field definition in Events has been adjusted to include the reason for alert policy unmatched. It is still necessary to use isIgnored for filtering and judgment to obtain the actual notification targets sent externally.
Feature Updates
Incident
- Added Incident management entry. Through this entry, the currently logged-in user can view and manage the Incident status of all joined workspaces.
- Optimized the channel list display on the Incident page to improve query efficiency when there are many channels.
Management
- Cloud Account Management: Added Alibaba Cloud account authorization type.
- API Key Management: Added permission control for API Keys, supporting role authorization. Through role authorization, the API Key only has operation permissions within the role scope, effectively reducing security risks.
- Data Forwarding: Default interaction changed to not selecting rules.
Obsy AI Error Analysis
The following detail pages have added Obsy AI Error Analysis capability: - Error logs - APM > Trace/Error Tracking
Scenarios
- Scheduled Reports:
- Added Webhook sending as a notification method;
- Supports sharing dashboard images to WeCom/DingTalk.
- Time Series Chart: When selecting area chart as the chart type, added Stacked Mode style for easy observation of the cumulative effect of overall data.
APM
Traces: Supports batch export of the list in JSONL format.
RUM
User Insights > Funnel Analysis: The queried Session list supports Session Replay function.
Logs
- Explorer:
- Log Explorer > Index quick filter display optimization in the search bar;
- Log Details > Extended Fields: Added "Dimension Analysis" mode;
- Index: Under the index dimension, supports setting exclusive Key Fields.
Explorer Time Widget
The left time range selection and the right refresh frequency are independent. Only two situations affect the refresh frequency: - The selected time range exceeds 1h - The selected time is absolute time
Infrastructure
Host: Explorer supports adjusting the time range.
Pipeline
- Configuration page display optimization;
- Pipeline processing type added "Events";
- Test samples support obtaining JSON format.
- Filter Condition > Synthetic Monitoring: Supports selecting multi-step synthetic tests.
Deployment Plan Updates
Template Management: Supports uploading all explorer templates.
New Integrations
- Added Azure Load Balancer;
- Rewrote K8s Server API;
- Updated GitLab CI;
- Translated Volcengine related views;
- Translated AWS related views.
Bug Fixes
- Fixed the issue where exporting a log stream chart to CSV did not respond.
- Fixed the issue where the JVM metric view variable collected by
ddtracewas theruntime-idfield, and the time series chart had no data after adding the relevant filter. - Fixed the interface display issue for custom gradient interval color scales.
- Fixed the issue where after saving a DQL query with a filter condition
>0in the time series chart, re-editing showed it as empty. - Fixed the abnormal display of the Infrastructure table chart in APM.
- Fixed the issue where the frontend forwarding rule did not support the data forwarding storage duration set to 1,800 days in the management console.
- Fixed the error "kodo service API request error: Service Unavailable" when executing
show_object_field(HOST)in the quick query. - Fixed bugs in the shortcut entry.
- Fixed the issue where
sessionandviewhad no data in RUM, whileresourceandactionhad data. - Fixed the issue where the multi-step synthetic test creation request step immediately validated required fields.
- Fixed the issue where the filter condition did not work when setting role authorization in Data Access.
February 27, 2025
Open API Updates
Metrics: Added Get Metric Info (Measurement and Tags).
Feature Updates
Synthetic Monitoring
- HTTP Synthetic Tests: Supports Script Mode. By writing Pipeline scripts, flexibly customize the judgment conditions and data processing logic of the synthetic test task.
- Added Multi-step Synthetic Tests: Allows creating tests using response data from multiple API connections, and passing values through local variables to link multiple task requests.
Scenarios
- Dashboard > Visibility Range: Added "Custom" configuration, allowing configuration of "Operate" and "View" permissions for this dashboard. Also added "All Members" option under this configuration.
- Charts:
- Added the ability to automatically generate chart titles and descriptions based on AI;
- Log Stream Chart added "Rule Mapping" function;
- Table Chart display column optimization;
- Grouped Table Chart: Expression results support sorting;
- Multiple tables such as Time Series Chart and Pie Chart support data export to CSV files.
Metrics
- Metrics Analysis > Table Chart: When the number of returned query results exceeds 2,000, the three modes added "Query Result Count" display.
- Metrics Management: Supports one-click jump to Metrics Analysis.
- Generate Metrics: Supports import creation method and batch export.
Infrastructure
Container/Pod Explorer: Object data added 4 new fields: cpu_usage_by_limit, cpu_usage_by_request, mem_used_percent_base_limit, mem_used_percent_base_request.
APM
- Profiling > Flame Graph interaction optimization: Selecting a single search method name can directly focus and locate.
- ServiceMap interaction optimization: In the upstream/downstream page, supports searching for nodes in the current canvas.
New Integrations
- Added AWS Cloud Billing;
- Added Kube Scheduler;
- Added MQTT;
- Rewrote APISIX;
- Updated TiDB English documentation and views;
- Updated Zookeeper view, added integration icon;
- Fixed English translations in some component manifest.yaml files.
Bug Fixes
- Fixed the display error when clicking the APM > Trace Details tab;
- Fixed the incorrect
@ memberin Issue replies in Incident; - Fixed the incorrect temperature unit in charts.
February 19, 2025
Breaking Changes
The alert_info related information will no longer be retained in the Event df_meta field. Users who previously relied on this information to obtain notification targets should switch to using the three new fields: df_alert_info (event alert notification), df_is_silent (whether muted), and df_sent_target_types (event notification target type) to achieve the corresponding functionality.
Potentially affected functional scenarios: 1. Custom usage scenarios where events are obtained via Open API and integrated with external systems 2. Custom usage scenarios where events are forwarded to external systems via Webhook notification targets
Feature Updates
PromQL Queries
Added query type: Instant Query, which queries a single time point.
Monitoring
Monitor Configuration Page:
1. Added not between option in trigger condition logic matching;
2. Supports directly modifying the monitor status ("Enabled" or "Disabled").
APM
Traces: Details page added Service Context tab.
Events
Event Details Page: Added support for binding Built-in Views.
Incident
- Issues added
workingandclosedstatuses; - For
openstatus staying overtime, no specified responsible person, and processing timeout, Issue escalation added repeat notification configuration; - Adjusted UI display for Issue system comments and channel notifications;
- Analysis Dashboard: Added time widget.
Scenarios
- Chart Links: Added "View Host Monitoring View", disabled by default.
- Explorer: Supports deleting the fixed
namecolumn, users can customize the list display. - Cloud Billing Analysis View: Supports viewing bill details.
Management
Role Management: Session Replay viewing and Audit Events added custom add view permission capability.
Metrics
Generate Metrics: Metric name input no longer supports the use of - (hyphen).
Integrations
Integration cards added description information.
Deployment Plan Updates
- Template Management: Supports uploading Infrastructure explorer templates;
- Index Configuration: Deprecated "Backup Logs" item; configure the corresponding storage policy in "Edit Workspace > Data Storage Policy > Data Forwarding - Default Storage".
New Integrations
- Added Milvus;
- Added Volcengine Public IP;
- Added OpenTelemetry Python;
- Added OpenLIT Integration;
- Updated K8s, ES, MongoDB, RabbitMQ, Oracle, CoreDNS, SQL Server English monitors & views.
Bug Fixes
- Fixed the issue where special characters in AI aggregation notification messages caused abnormal results;
- Fixed the adaptation issue of ServiceMap in the Deployment Plan;
- Fixed the issue where hidden view variables could not be configured in composite charts;
- Fixed the scrambled display of the "Unresolved Issue List" in the Incident > Analysis Dashboard;
- Fixed the inconsistency between the P75 result of the most popular pages in the RUM analysis dashboard and the DQL query result;
- Fixed the abnormal search box issue in the RUM Explorer;
- Fixed the issue where only part of the same field was effective in the dashboard when using Resource Catalog for field mapping in Scenarios > Object Mapping;
- Fixed the UI display issue in Monitor > Event Content;
- Fixed the issue where the quick filter results for unrecovered events in the Event Explorer did not meet expectations.
January 16, 2025
Feature Updates
RUM
- Added Funnel Analysis function: Users can create funnels by defining conversion steps to view data conversion and perform in-depth analysis;
- User Insights module integration: Added a new User Insights module, integrating heatmaps and funnel analysis within this module, providing a more comprehensive set of user behavior analysis tools;
- Added mobile SourceMap restoration: Android and iOS applications support uploading SourceMap files on the page, and the error explorer supports viewing restored data.
APM
When adding a service in APM, a new Host Auto-Injection installation guide method has been added, simplifying the installation process.
Integrations
- DataKit: The DataKit installation page added a Docker installation guide, providing more diverse installation options;
- External Data Source Optimization: When querying SLS data sources, added query specification prompts to help users perform more accurate data queries.
Scenarios
Composite Chart optimization: Composite charts added view variable configuration, supporting selection of view variables from the current dashboard to apply to the composite chart, helping to filter and analyze data more flexibly.
Monitoring
Mutation Detection Monitor: Added support for week-over-week and month-over-month comparisons of the query period.
Obsy AI
Added DataFlux Func related knowledge base.
Pipeline
Auto-generate Pipeline optimization: Supports interaction with both structured and natural language to obtain Pipeline parsing.
Bug Fixes
- Fixed display issues in log stacking mode;
- Fixed the misalignment of the function input box in the log detection monitor;
- Fixed incorrect metric calculation;
- Fixed the issue where the Volcengine engine did not support the
havingstatement; - Fixed the error when selecting "Request Error Rate" and "Average Requests per Second" in the APM metric detection;
- Fixed the issue where the
not instatement did not work in the Volcengine base; - Fixed the issue where the event list returned too much data, affecting page load speed;
- Fixed the issue where one-click recovery of events in the Hangzhou site did not meet expectations.
January 8, 2025
Open API Updates
- Field Management: Supports getting the field management list, supports adding/modifying/deleting field management.
- Synthetic Monitoring: Supports modifying synthetic tests.
- Incident > Calendar: Supports getting the calendar list, supports creating/modifying/deleting schedules.
- Incident > Configuration Management: Supports getting the notification policy list, supports adding/modifying/deleting notification policies; supports getting the Issue discovery list, supports creating/modifying/enabling/disabling/deleting Issue discovery configuration.
Feature Updates
Logs
- Log Index Optimization:
- When accessing the log built-in view and log context tabs, the system will default to selecting the current log's index and the
defaultindex respectively. Both tabs support multi-index selection. Additionally, when cross-workspace query is enabled and an authorized workspace is selected in the relevant menu, the index data of the corresponding workspace can be queried directly here. This ultimately helps users view all associated log data on one page, optimizing the log query interaction. - When listing log indexes, besides
defaultbeing pinned to the top, the remaining log indexes are sorted A-Z.
- When accessing the log built-in view and log context tabs, the system will default to selecting the current log's index and the
- Log Explorer added stacked View Mode: In stacked mode, fields are integrated into the same column and displayed in rows within the cell. The log information display is more compact and clearer, facilitating quick browsing and analysis.
- Log Pipeline Optimization: The test sample for the log Pipeline is adjusted to obtain all fields of the log and must be filled in line protocol format. Manually entered logs must also follow the format requirements.
Scenarios
- Table Chart Optimization:
- Multi-metric query sorting support: When using a single DQL for multi-metric queries, the table chart now supports sorting.
- Table pagination selection: Added table pagination selection function, allowing users to choose the appropriate page size based on data volume and viewing needs.
- Composite Chart: Supports adjusting the order of charts.
- Chart Optimization: Adjusted the function order of the DQL query component, while emphasizing the use cases of the Rollup function to help users better utilize Rollup for data aggregation and analysis.
Management
- Events support configuring Data Forwarding: Supports configuring data forwarding rules for event types, saving event data that meets filter conditions to Guance's object storage and forwarding to external storage, providing flexible management of event data.
- Workspace added DataKit Environment Variables: The workspace supports managing DataKit environment variables, allowing users to easily configure and update environment variables, achieving remote synchronous update of DataKit collection configuration.
- Query Audit Events optimization: Added multiple fields to record query information, and the event content now includes the query time range for easier tracking and analysis of query behavior.
Pipeline
Auto-generate Pipeline optimization: Changed the prompt appearance method, improving product experience.
Obsy AI
Obsy AI added Generate Chart: The generate chart function automatically analyzes the user's input text based on a large model and intelligently generates appropriate charts, solving the problems of manual chart creation complexity and chart selection difficulty.
Monitoring
Alert Policy: Configuring notification rules by member supports appending a name for usage description.
Deployment Plan Updates
- Management Console > Workspace Menu Optimization:
- Workspace list added main storage engine and business filter items, supporting convenient filtering of workspaces;
- Optimized the logic for returning the workspace list page number. When modifying/deleting a workspace or modifying the data reporting limit of a workspace, it will stay on the current page to optimize the query experience.
- Deployment Plan added parameter:
alertPolicyFixedNotifyTypes, supports configuring whether the "Email" notification method is displayed in the alert policy Configuration Reference.
New Integrations
- Added AWS Gateway Classic ELB;
- Added Volcengine TOS Object Storage;
- Modified AWS Classic collector name;
- Added MinIO V3 integration;
- Updated Elasticsearch, Solr, Nacos, InfluxDB V2, MongoDB integrations (views, documentation, monitors);
- Updated Kubernetes monitoring views.
Bug Fixes
- Resolved the issue where cross-workspace authorization for event data was not effective;
- Resolved the issue where jumping from log-associated traces to the Trace Explorer with
trace_idcould not query data; - Resolved the issue where view expression queries could not perform numeric filling;
- Resolved the issue where external event detection monitors did not generate operation audit records when changing the alert policy;
- Resolved the issue where the column width of the event display list could not be adjusted.