Analysis Dashboard
In LLM Monitoring > Analysis Dashboard, you can view multiple metrics for the selected application in chart form, including core metrics such as request volume, error rate, Token consumption, response latency, and usage share of various models, providing a comprehensive overview of application performance and cost distribution.
Note
When there is no data within the selected time period, the chart area will display a "No data" status. You can adjust the viewing range using the time widget in the upper right corner.
Core Metrics Overview
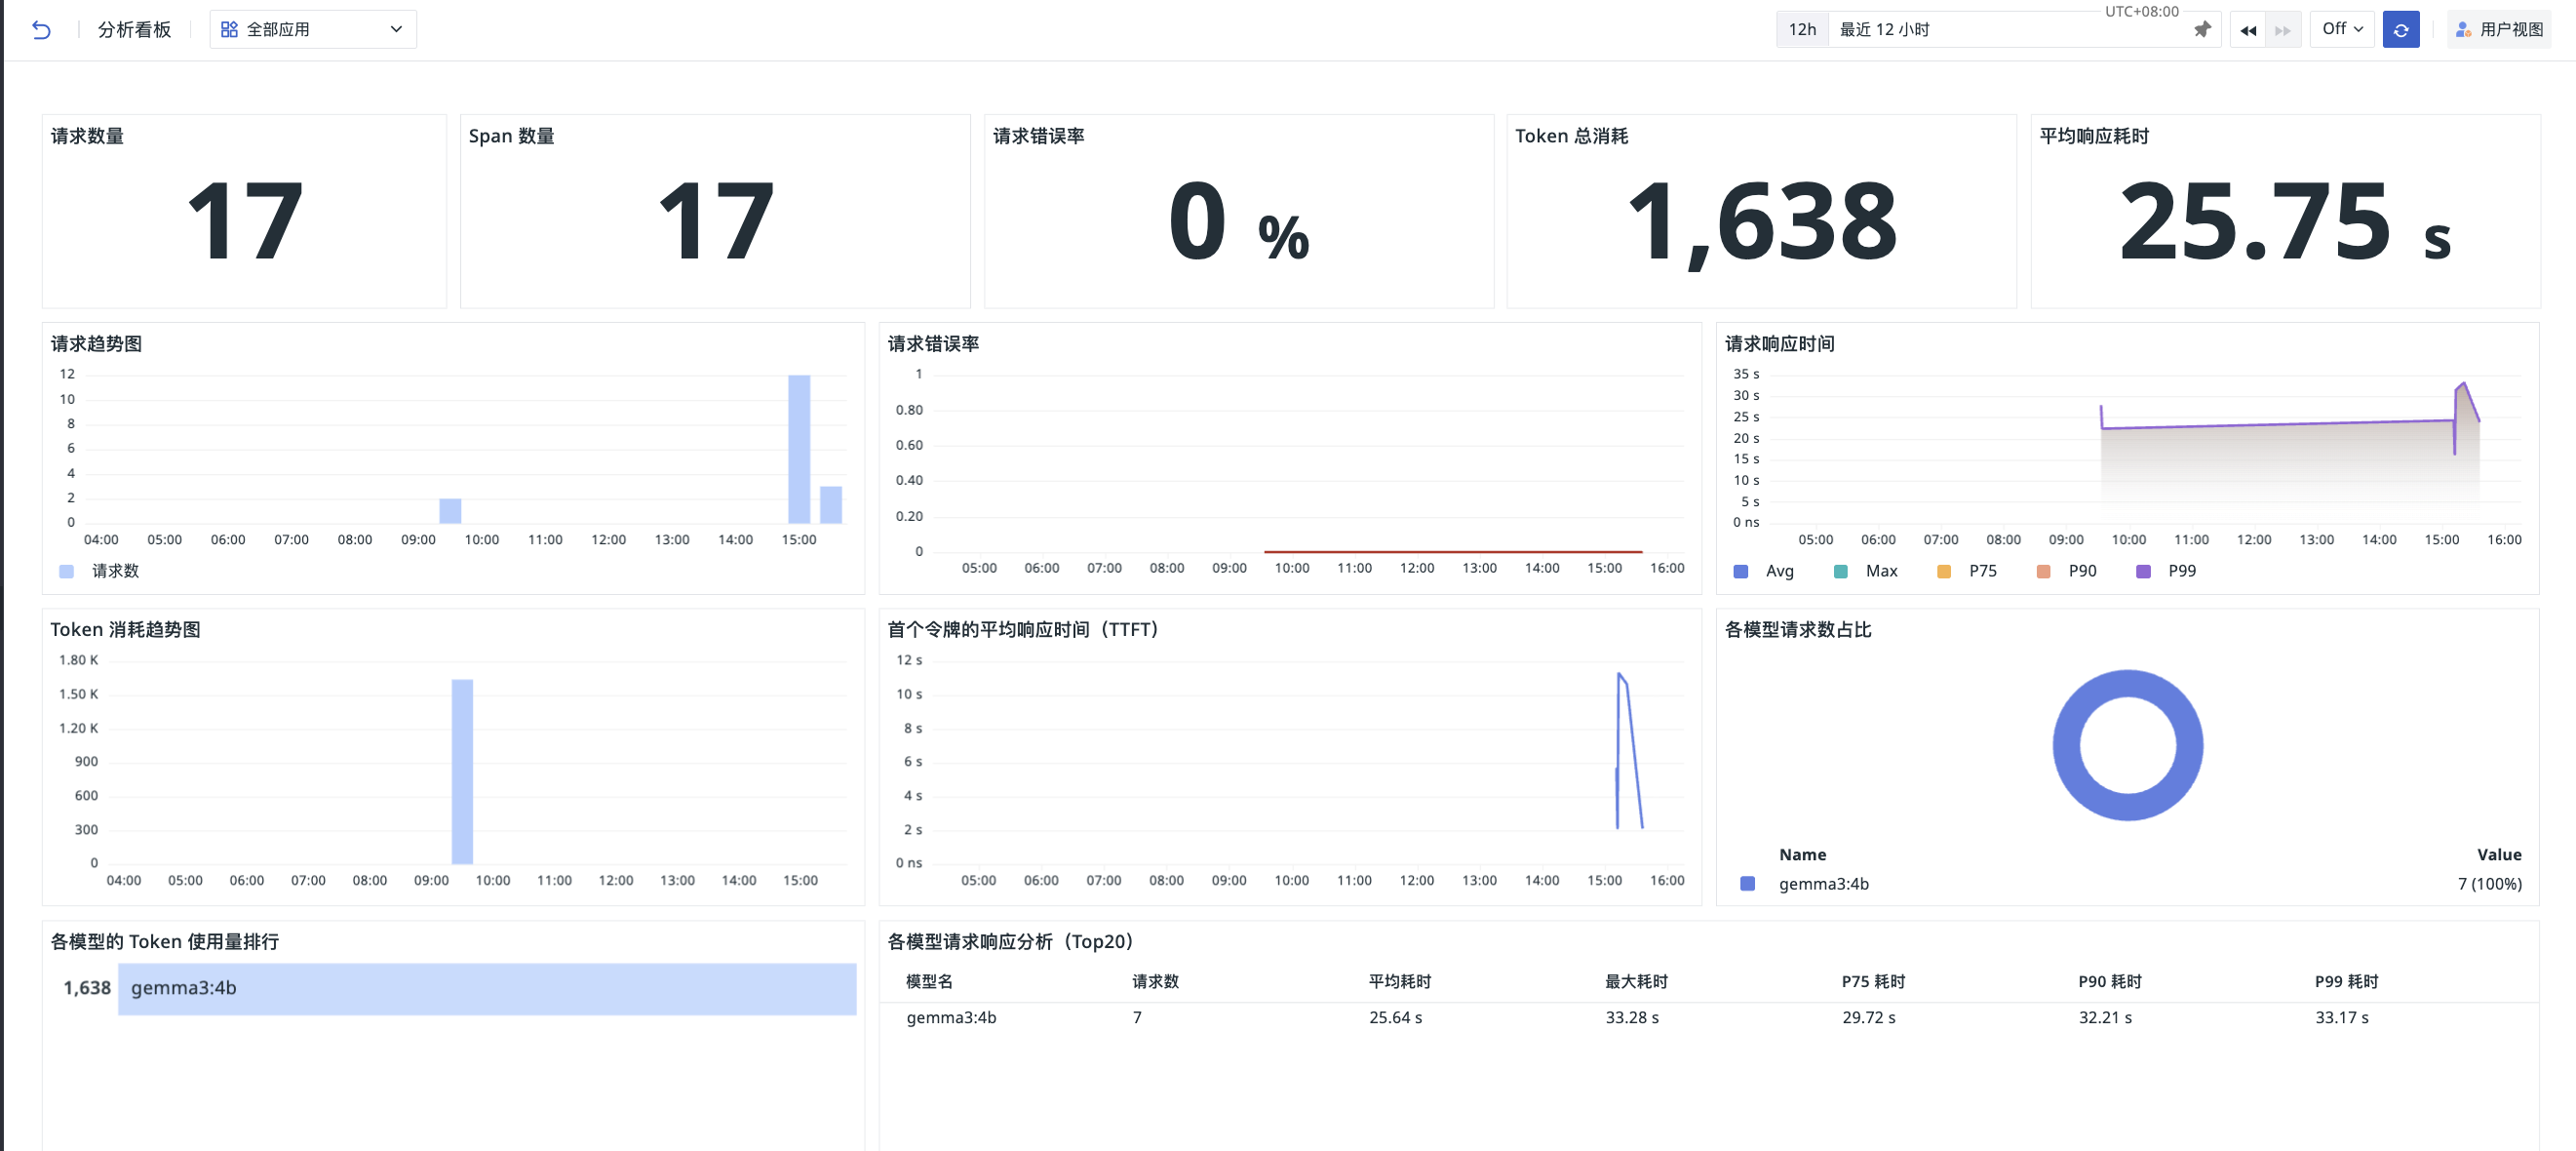
The top of the dashboard displays key metric statistics for the selected time range:
- Request Count: Total number of requests
- Span Count: Total number of associated Span calls
- Request Error Rate: Percentage of failed requests out of total requests
- Total Token Consumption: Total Token consumption for all requests
- Average Response Latency: Average processing time for all requests
Trend Analysis Charts
Through multi-dimensional trend charts, you can track changes in application performance and usage trends:
- Request Trend Chart: View the distribution of request volume across different time periods to identify usage peaks
- Request Error Rate: Display the change trend of error rate to quickly detect abnormal fluctuations
- Request Response Time: Display latency percentiles (Avg, P75, P90, P99) to locate long-tail latency issues
- Token Consumption Trend Chart: Display the time distribution of Token usage to assist in cost forecasting
- Average Time to First Token (TTFT): Measure first-token latency, reflecting model response speed
Model and User Analysis
Analyze resource usage and performance from the model dimension and user dimension:
- Request Share by Model: Donut chart showing the call distribution of different models (e.g., qwen3:1.7b)
- Token Usage Ranking by Model: Compare resource consumption across different models
- Request Response Analysis by Model (Top 20): Table showing detailed performance metrics for each model, such as request count, average/maximum latency, percentile latency, etc.
- User Request Ranking (Top 10): Identify high-frequency users
- User Token Consumption Ranking (Top 10): Locate high-cost users to assist in cost allocation
Further Reading
You might also be interested in: