Trace Details
In the Trace Explorer, click on any trace to view its details, including relative time, duration, HTTP method, URL, status code, TraceId, flame graph, Span list, service call relationships, and associated logs, hosts, metrics, and network information. For frontend applications (e.g., browsers), you can also view the request time distribution, including the proportion of time spent in queue, first byte, and download.
Note
- The RUM SDK must be version 2.2.10 or higher to see this data display. If cross-origin issues exist, header configuration adjustments are required.
For more details, refer to Web Application Integration.
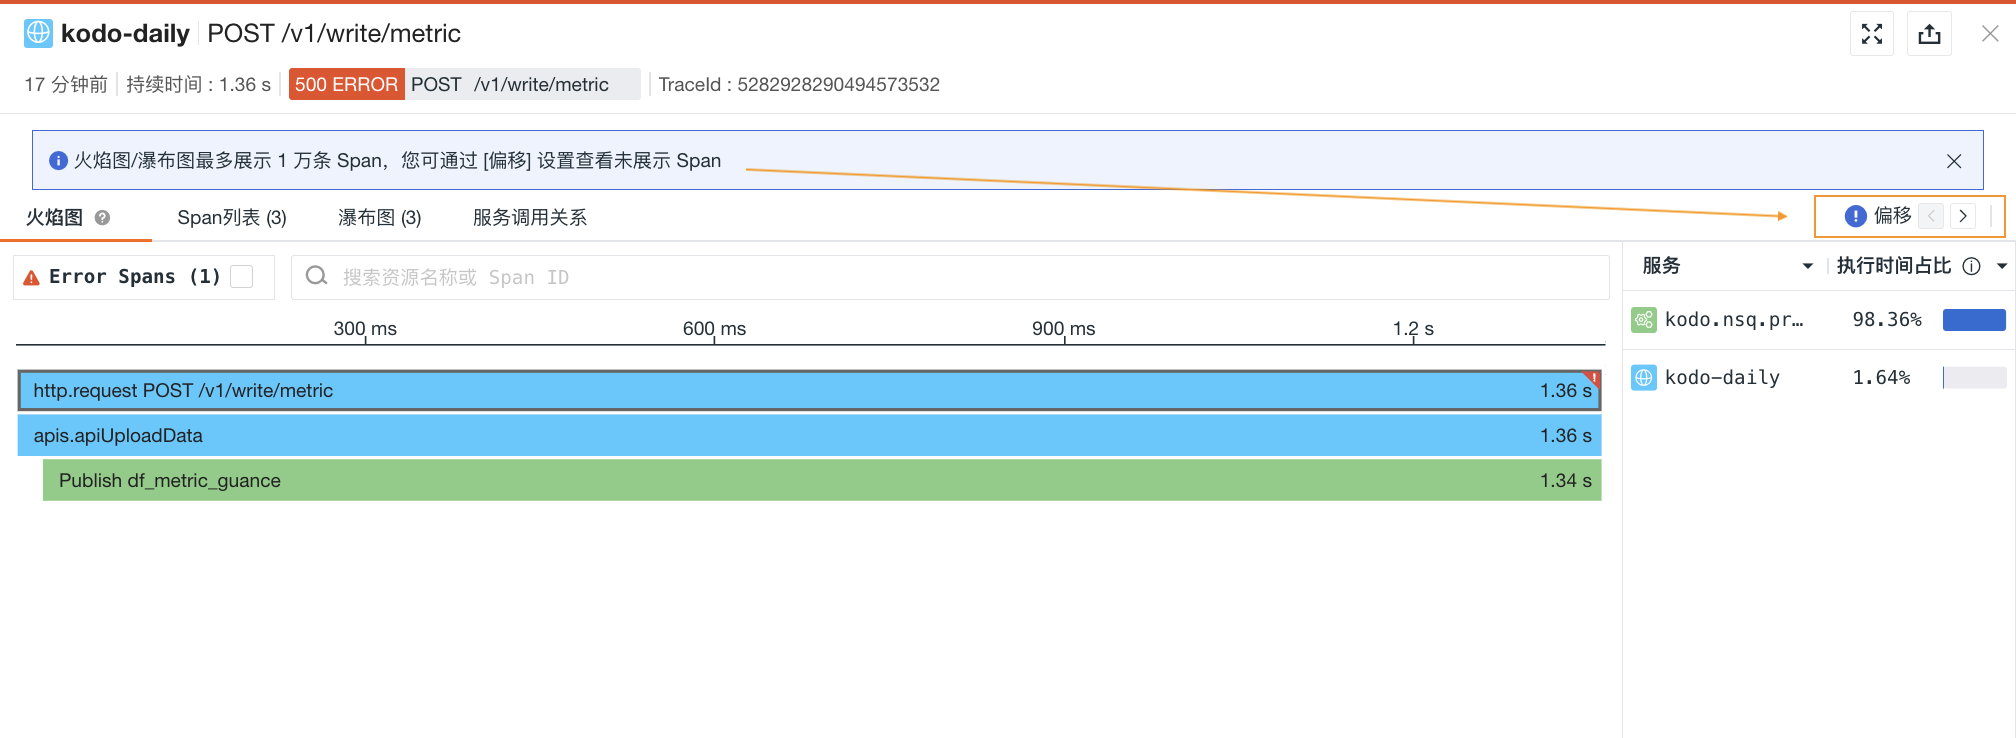
- The flame graph / Span list / waterfall chart can display up to 10,000 Spans. You can use the Offset setting to view Spans not currently displayed:
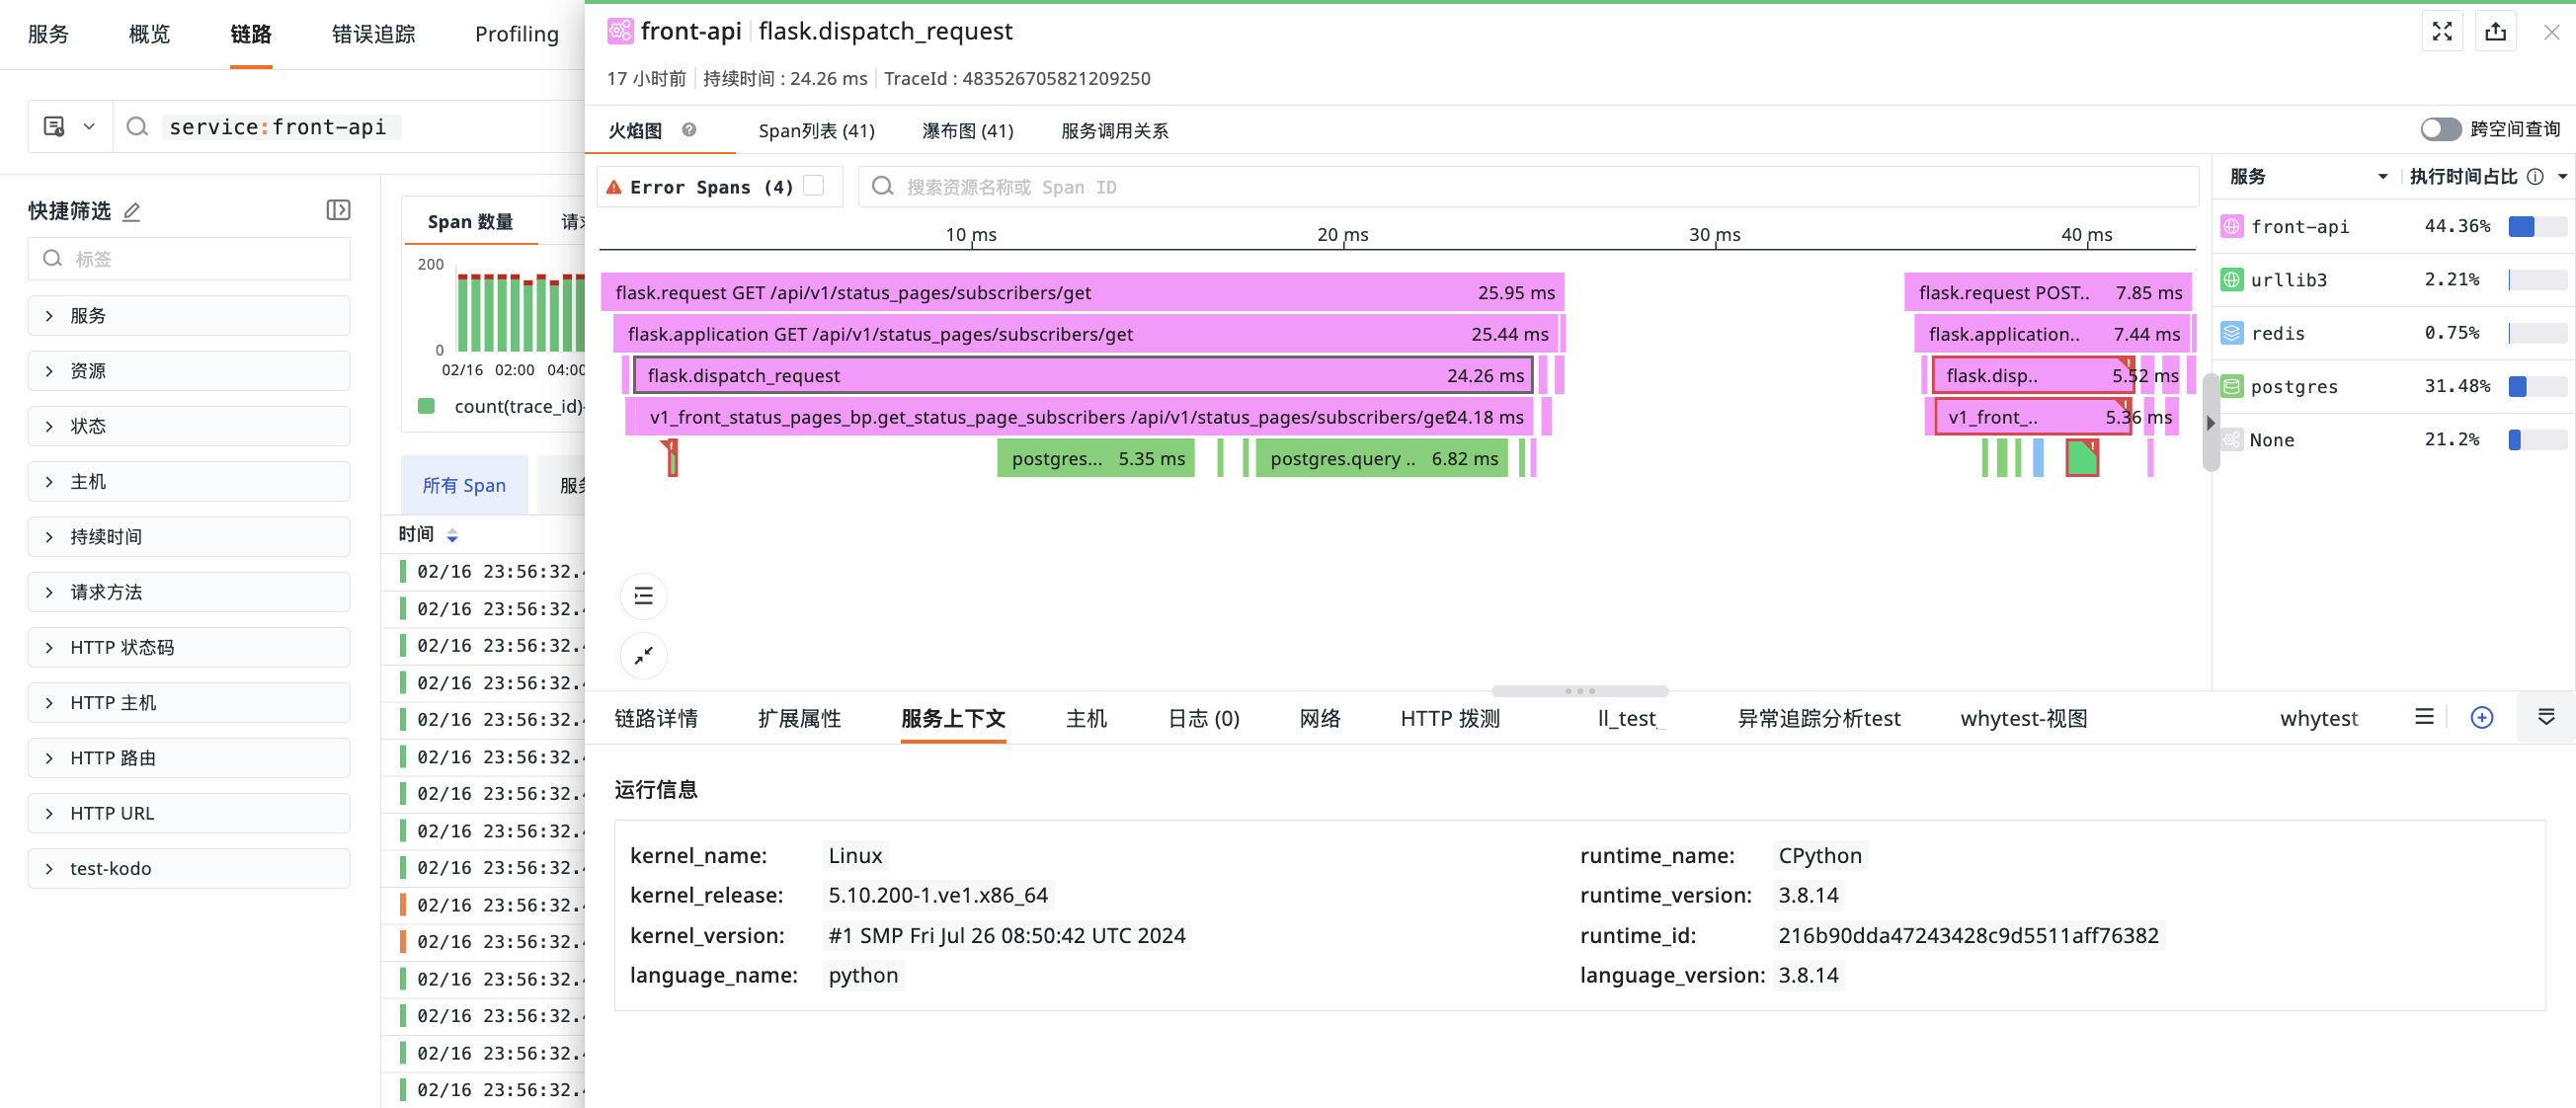
Flame Graph
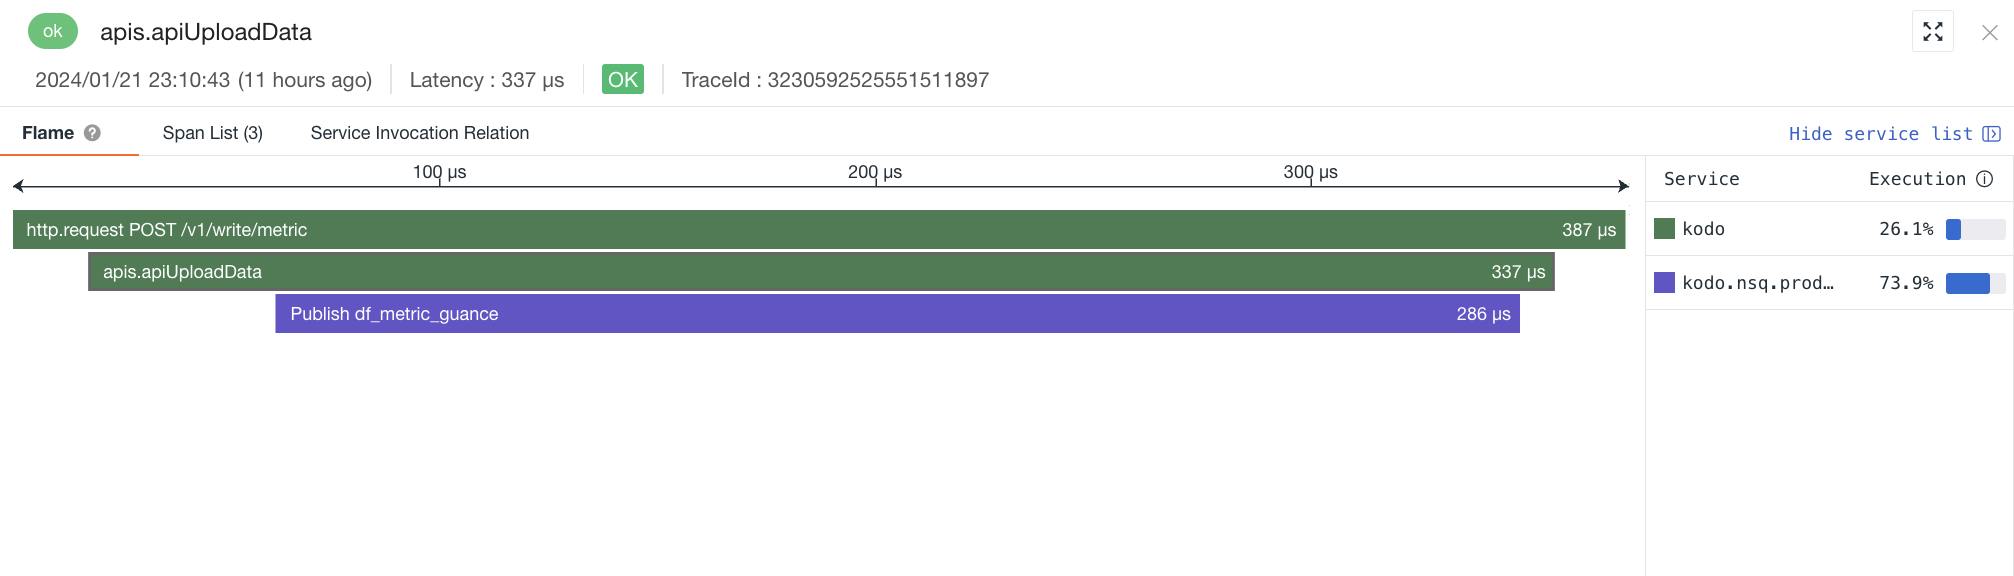
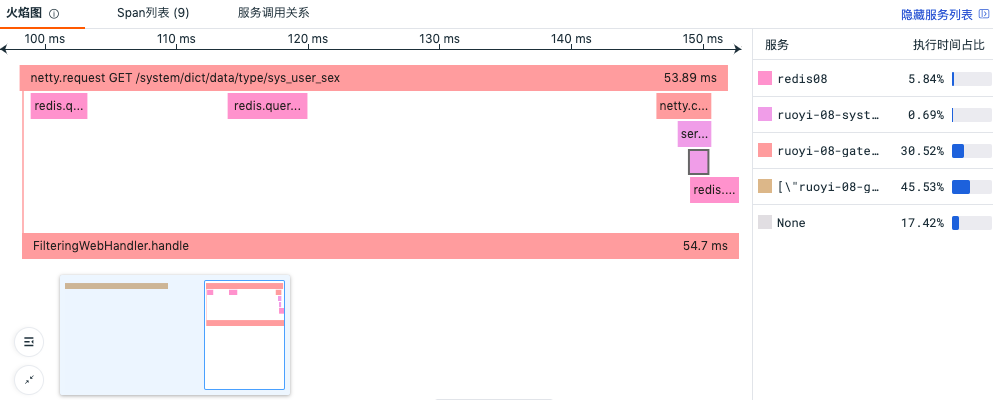
The flame graph clearly shows the flow and execution time of each Span. The right side displays the service list and response times. Clicking a Span shows its JSON content in the trace details. Use the mouse wheel to zoom in and out for detailed information.
For more details, refer to Using Flame Graphs to Analyze Trace Performance.
From the flame graph above, it can be seen that this call trace involves two services: CloudCare and Mysql. The trace starts with a POST request to the CloudCare service, then executes ActionResource.executeAction, and finally executes Mysql statements. During the execution of ActionResource.executeAction, Mysql statements are executed multiple times. The execution time calculation for CloudCare and Mysql is as follows:
- CloudCare service execution time = D1+D2+D3+D4+D5+D6+D7+D8+D9+D10+D11
- Mysql service execution time = span2+span3+......+span11
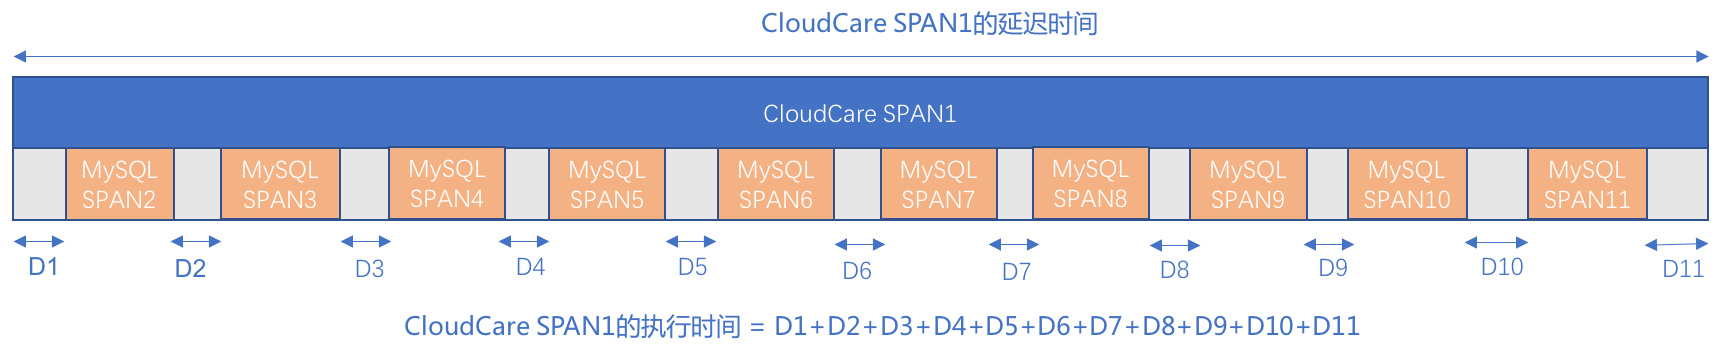
For details on the specific statements executed and their execution times, refer to the Span list.
The service execution time ratio in the flame graph refers to the proportion of each service's time relative to the total time of this call trace. Taking the figure below as an example, this call trace involves two services: CloudCare and Mysql, with execution time ratios of 42.37% and 57.63% respectively. The CloudCare service has 2 Spans, and the Mysql service has 10 Spans.
- Mysql service execution time ratio calculation: Sum of all span execution times / Total duration of the current call trace.
Calculation method explanation: In the figure below, the Mysql service has a total of 10 Spans. You can click each Span to get its execution time. From the figure, this Span's execution time is 5.08ms. Similarly, obtain and sum the execution times of the remaining 9 Spans.
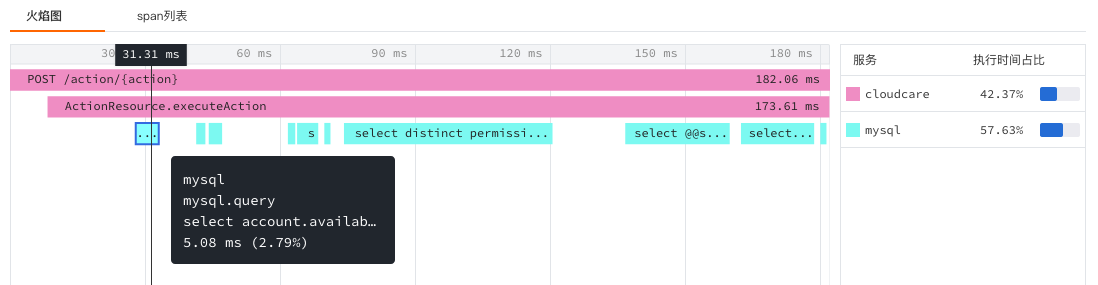
- CloudCare service execution time ratio calculation: (Total duration of the current call trace - Mysql service execution time) / Total duration of the current call trace.
Calculation method explanation: In the figure below, the CloudCare service spans the entire current call trace. The remaining time after subtracting the Mysql service execution time is the CloudCare service execution time (see the execution time marked with a red line). The execution time ratio can also be directly viewed in the Span list, which shows the execution time and ratio for each Span.
In the flame graph, whether service calls are synchronous or asynchronous, every detail of trace performance data can be clearly tracked. For example, the flame graph can clearly show which requests are asynchronous, their start time, end time, and total time spent.
Span List
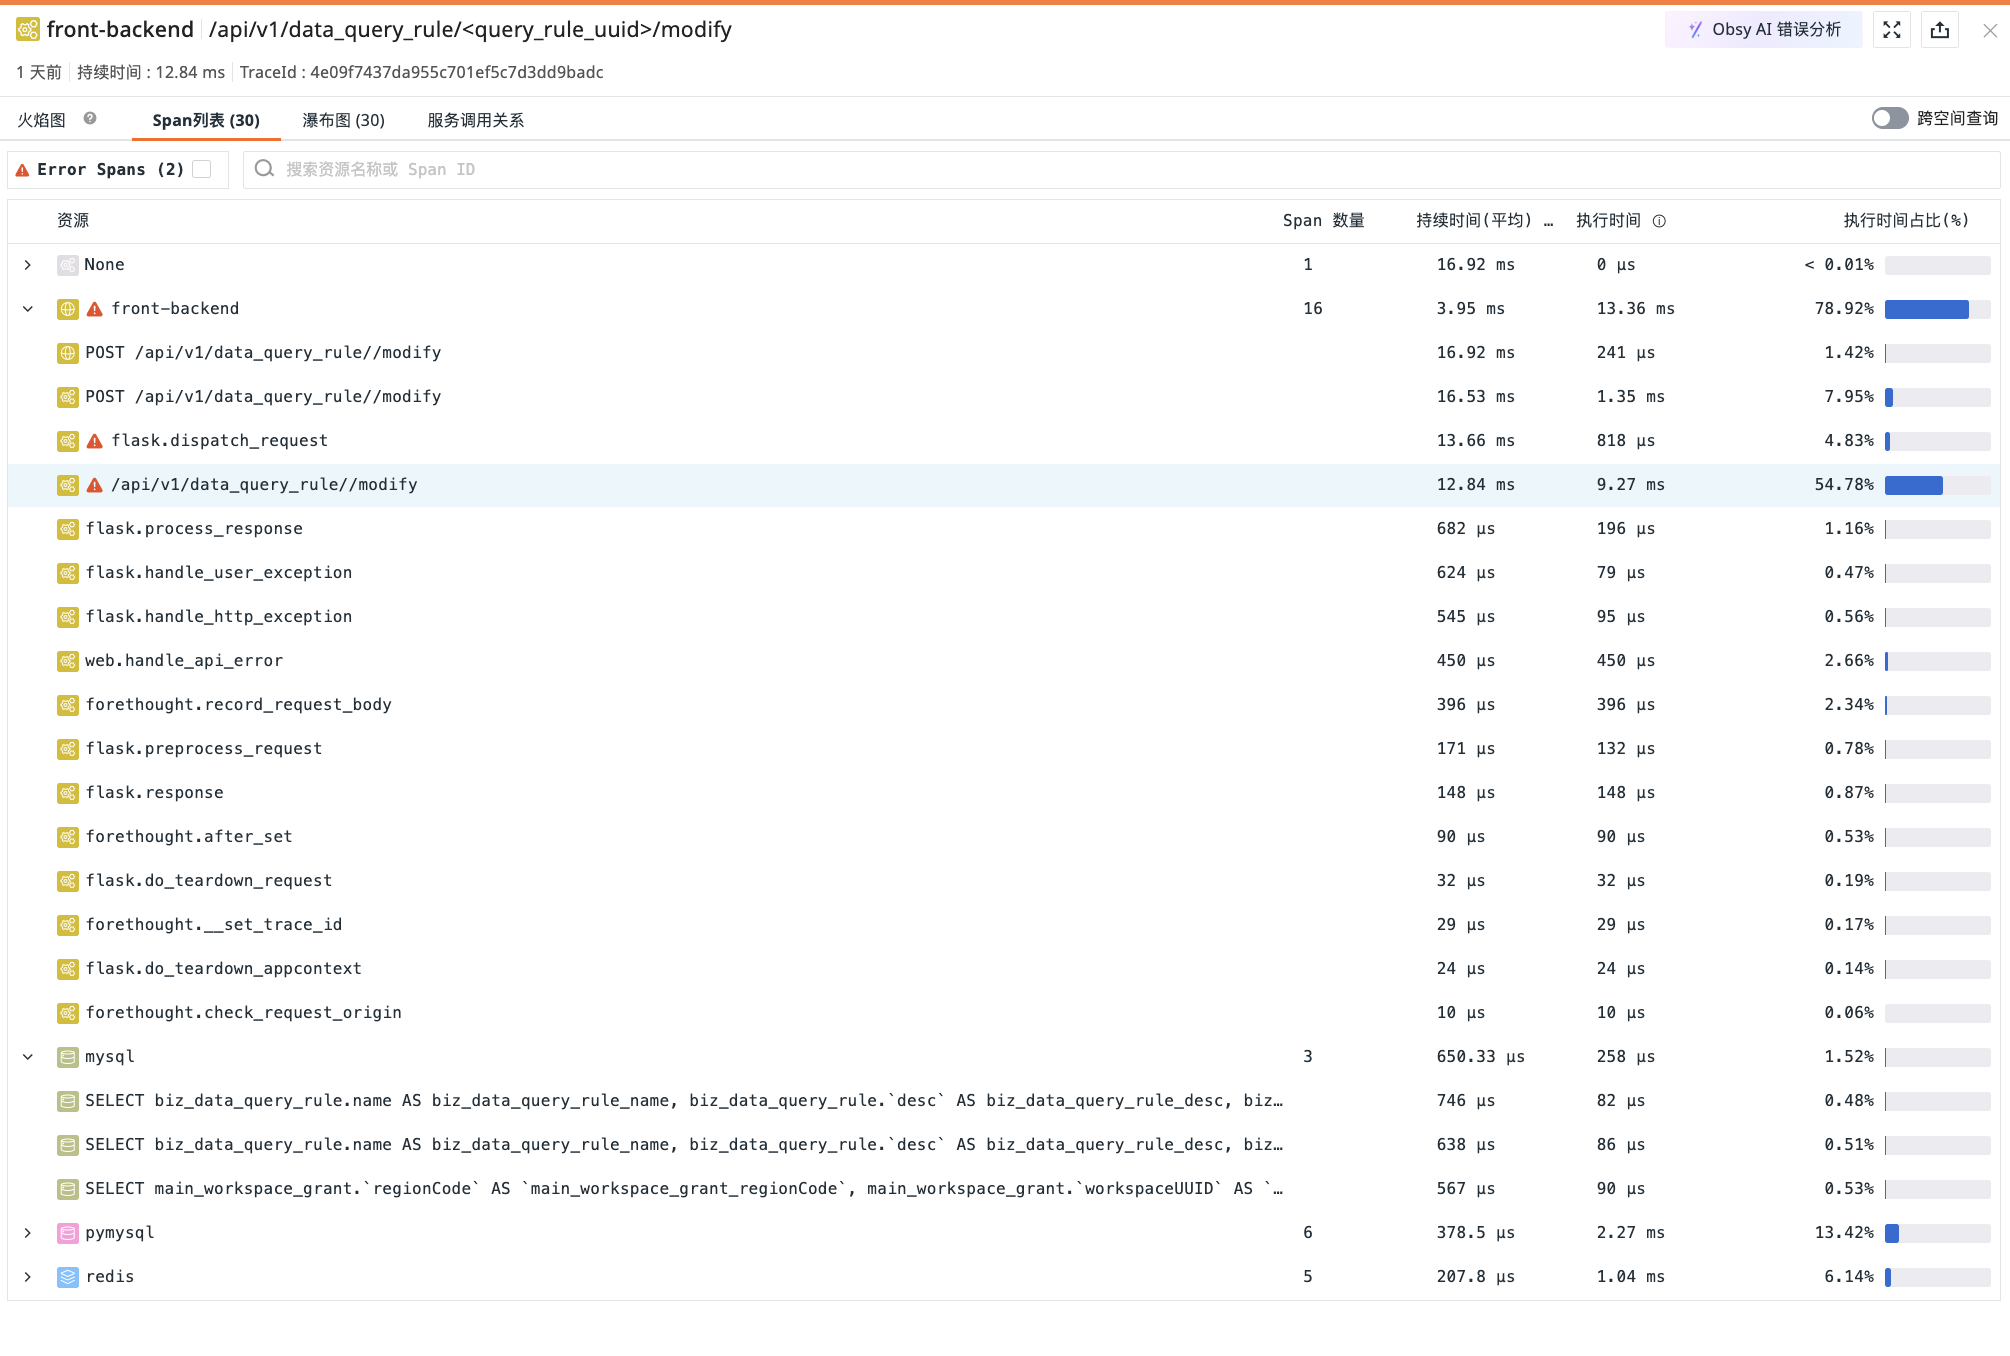
- Displays the resource name, count, duration, execution time, and percentage for all Spans in this trace.
- You can search by entering the resource name or Span ID.
- Click any Span to view its JSON content in the trace details; switching to the flame graph will synchronously display it.
- If there are errors, an error prompt will be displayed.
- Click Error Spans to directly display the filtered results.
Waterfall Chart
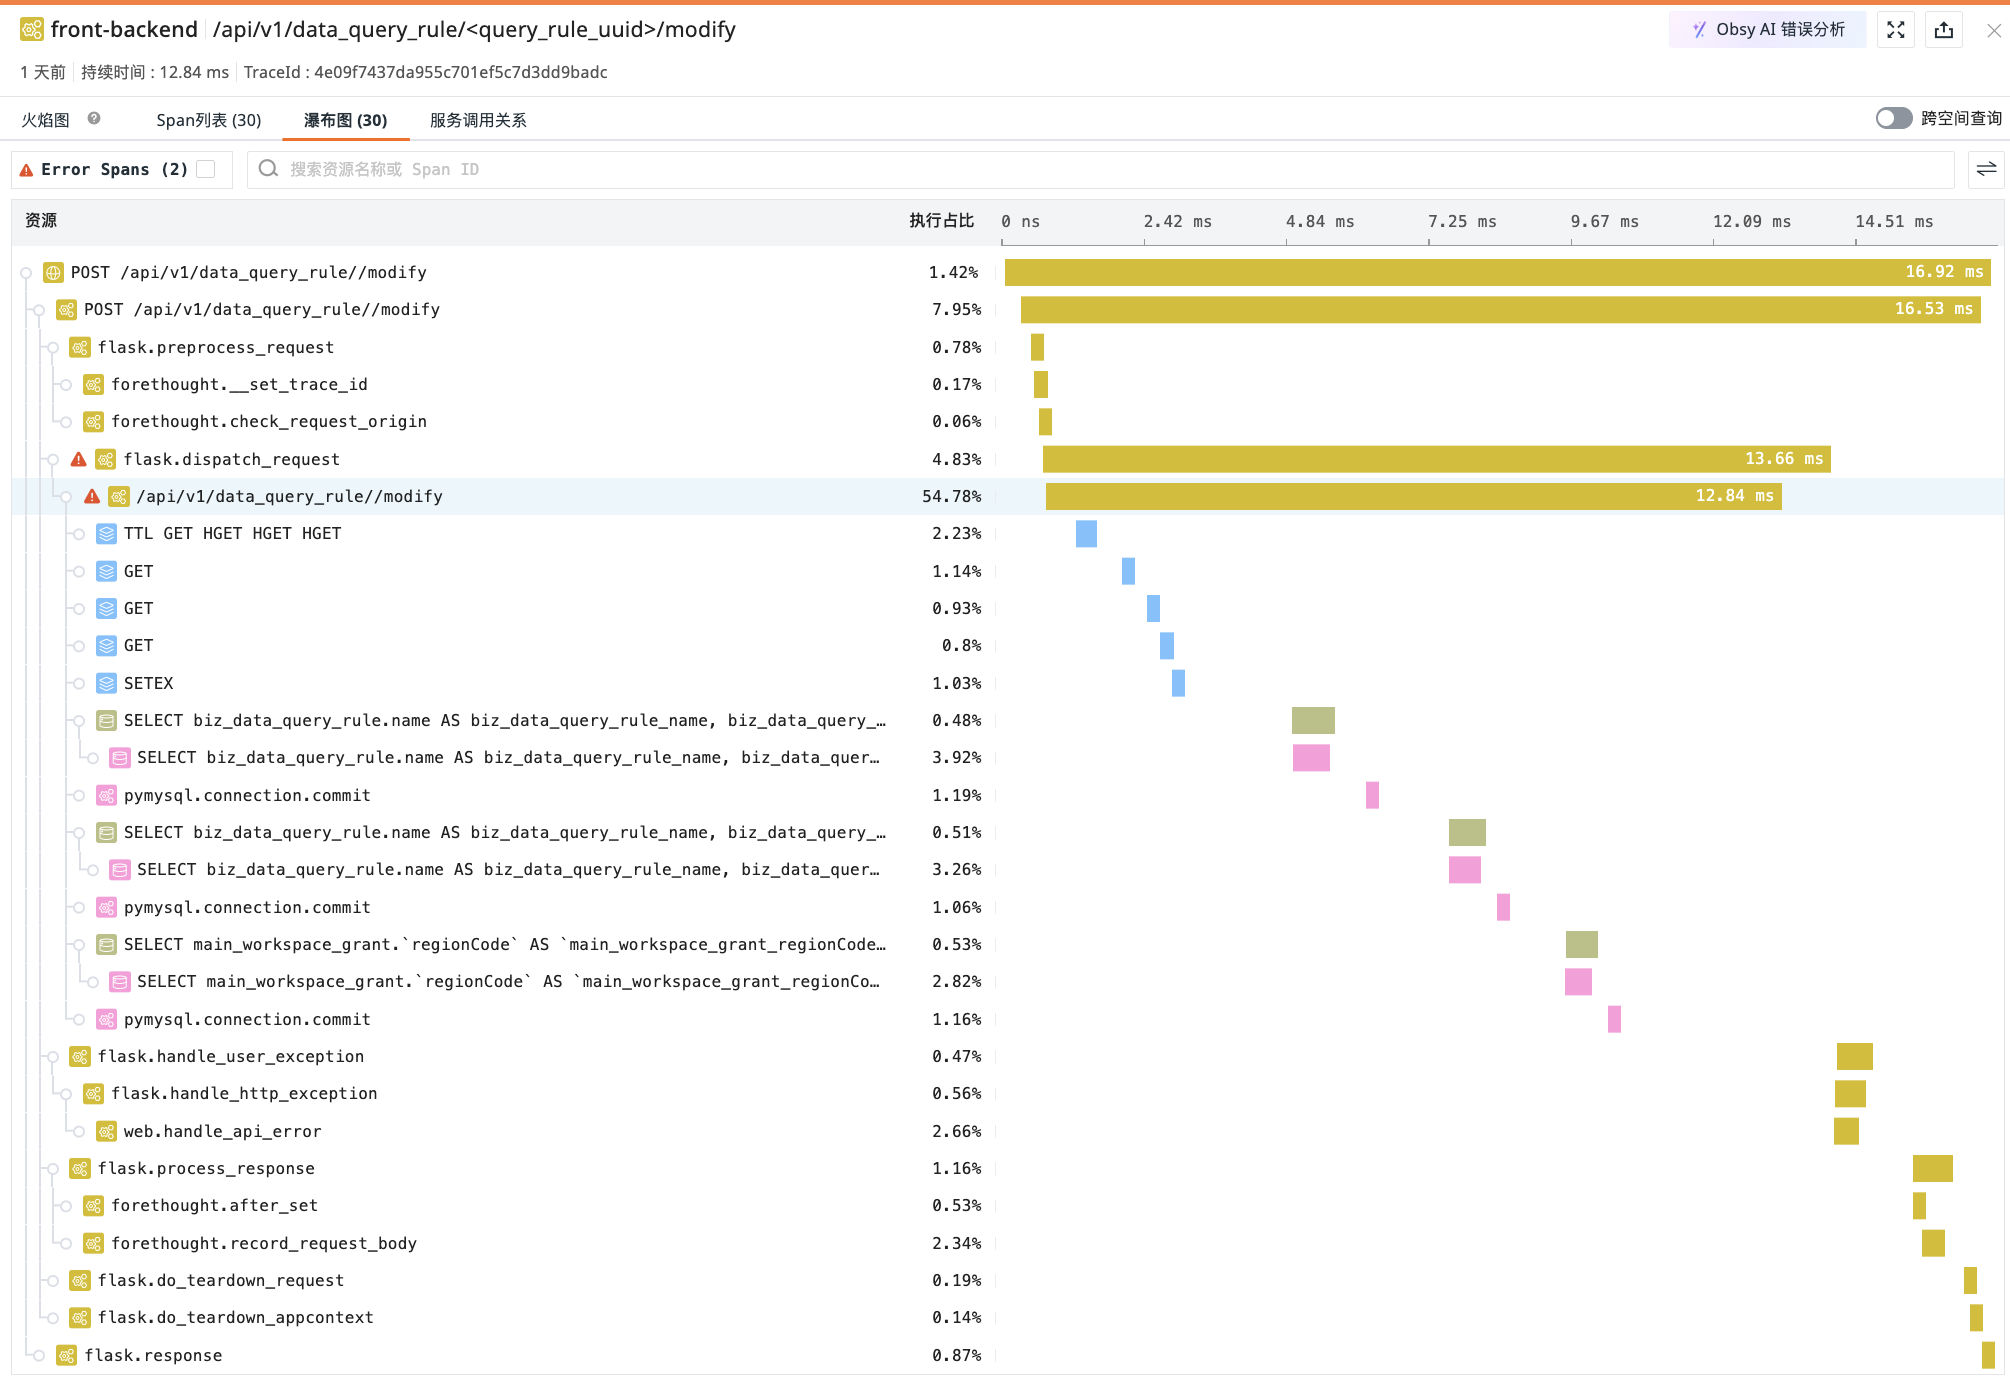
You can view the parent-child relationships between various resources.
The waterfall chart displays Span data in chronological order of start time. The left list shows Span data, displaying the execution time percentage for each resource. The right side shows the waterfall chart in chronological order.
- Search by entering the resource name or Span ID corresponding to the Span;
- Collapse or expand resources on the left with one click;
-
Click to switch the format of the execution time;
-
Click Error Spans to directly display the filtered results.
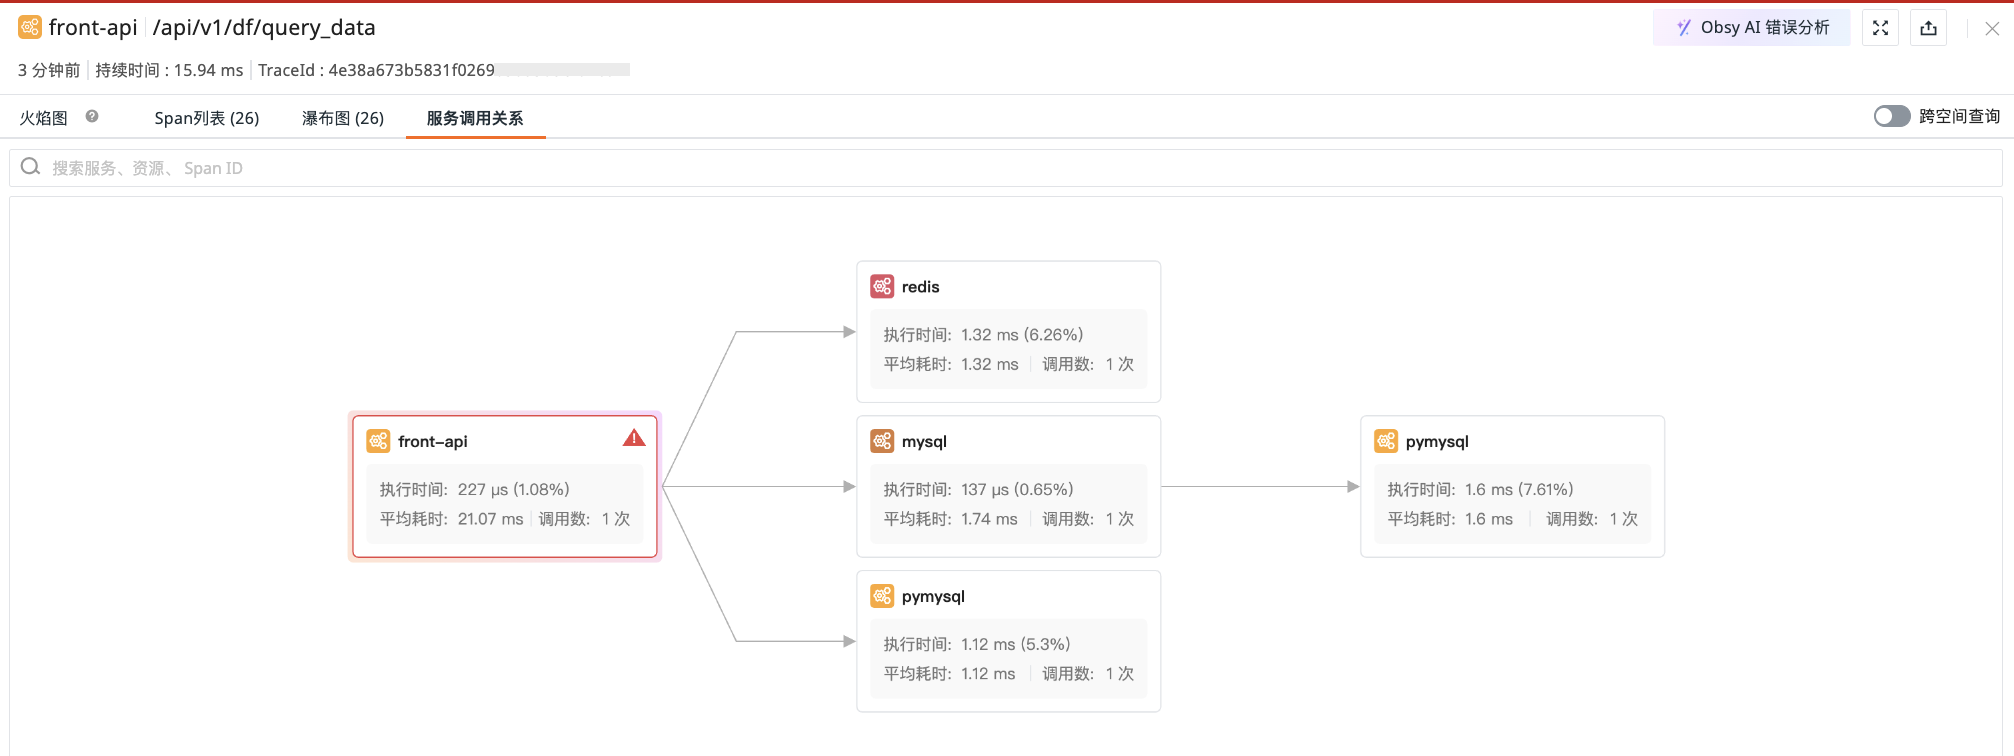
Service Call Relationships
Provides an overview of the call relationships and call counts between different services, as well as the execution time, average duration, and call count for individual services.
Click any service node to view its detailed information:
-
Service Operations and Resources: Lists specific operations (e.g., API interfaces, methods) and related resources contained within this service.
-
Error Status Tracking:
-
If errors exist in this service, error details are directly displayed.
-
Click to view the service's parent Span, used to trace the upstream call source.
-
Note
The system determines the color displayed for services here based on the error results corresponding to services counted in the trace details > Flame Graph.
Quick Actions
Action |
Description |
|---|---|
| Full Screen View / Restore Default Size | You can click the full-screen view icon in the upper right corner of the trace details to horizontally expand and view the trace flame graph; click the restore default size icon to return to the details page. |
| Locate to Current Span | Click to zoom the view and locate the current Span. |
| Expand/Collapse Mini-map | You can click the expand/collapse mini-map icon on the left side of the trace details. Use the mini-map to select intervals, drag, and scroll for quick viewing of the flame graph. |
| View Global Trace | You can click the view global trace icon on the left side of the trace details to view the global trace in the flame graph. |
| Double-click Span | Expands and displays the Span in the center of the flame graph, allowing you to quickly locate and view its contextually associated Spans. |
| Click Service Name | Highlights the corresponding Spans. Click the service name again to restore the default selection of all Spans. You can quickly filter and view Spans corresponding to a service by clicking its name. |
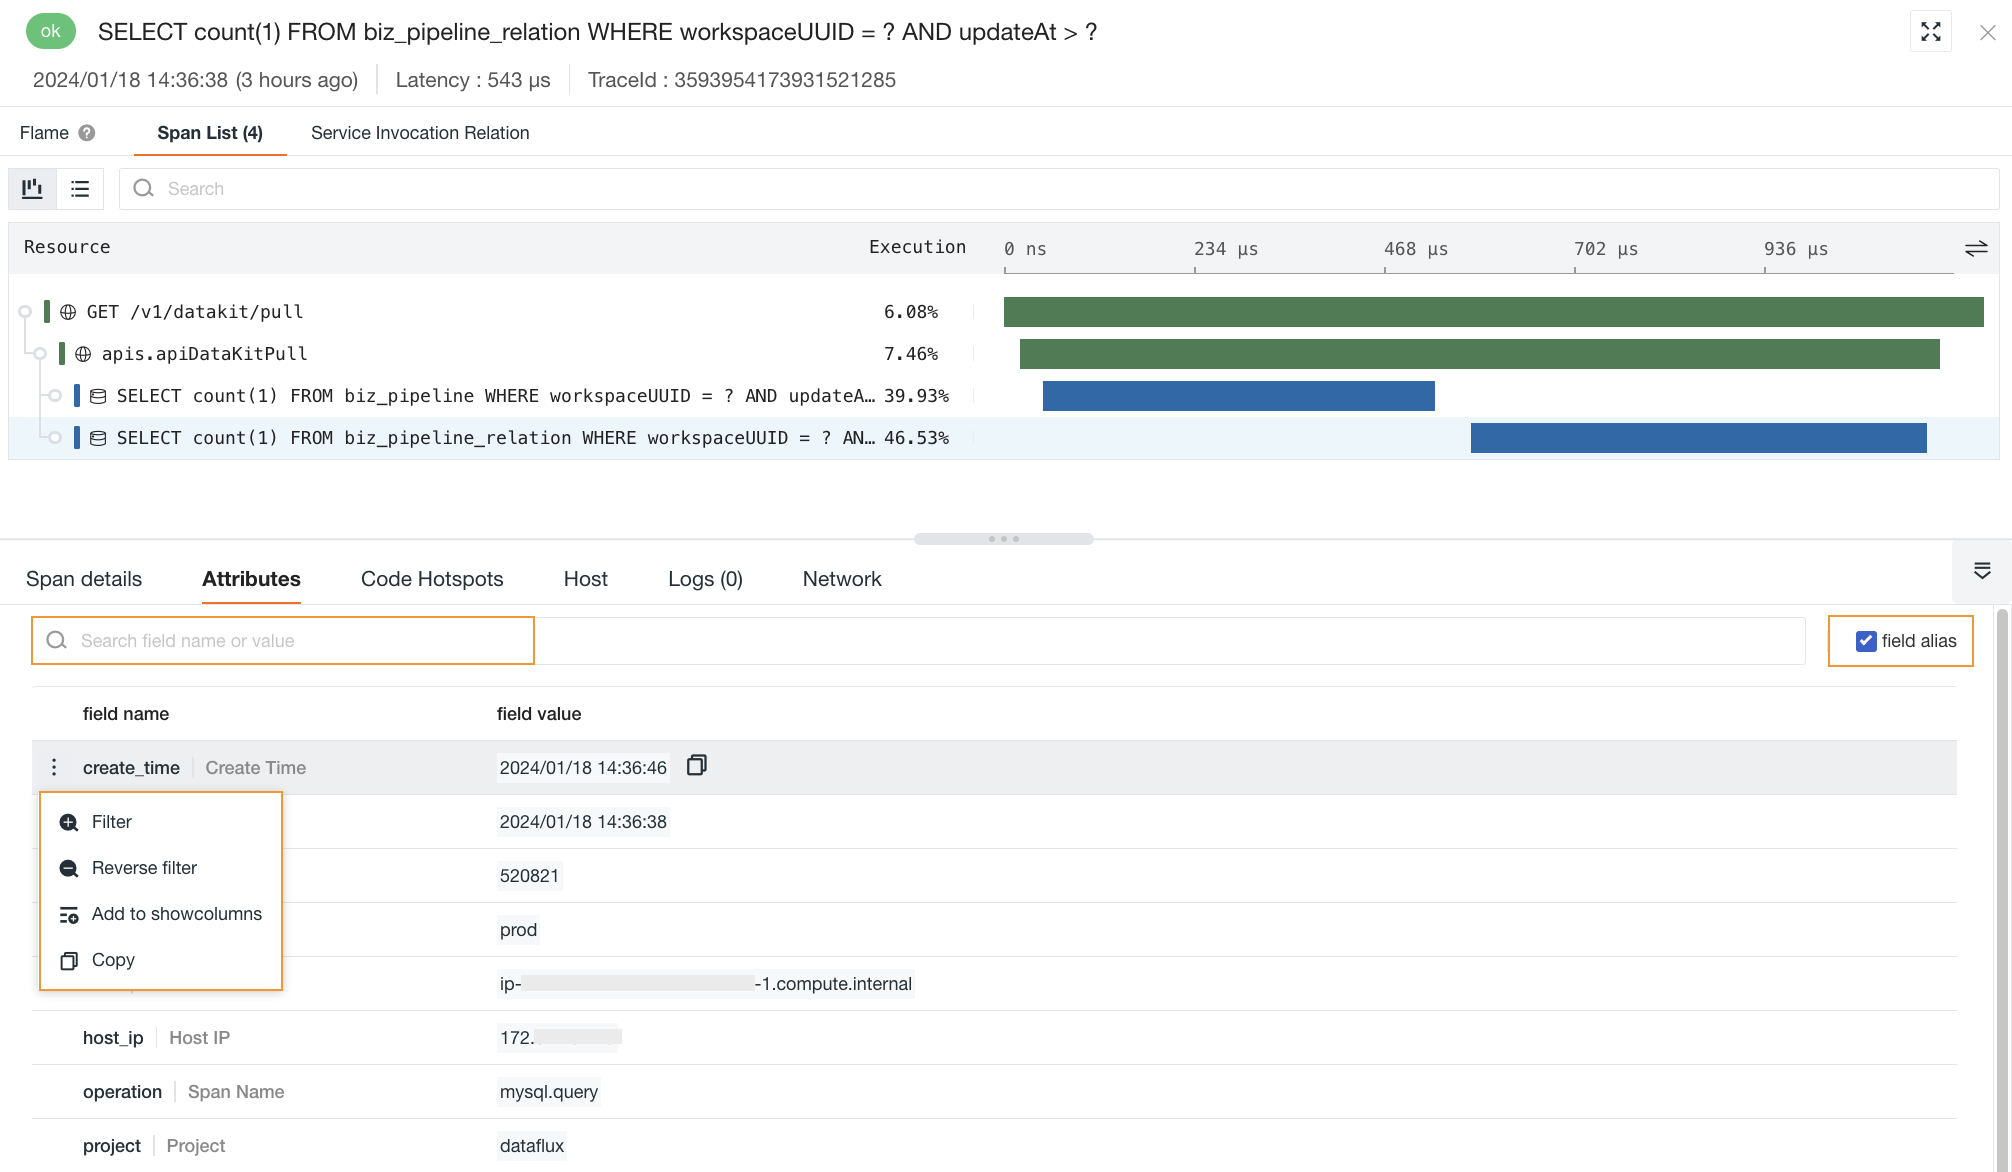
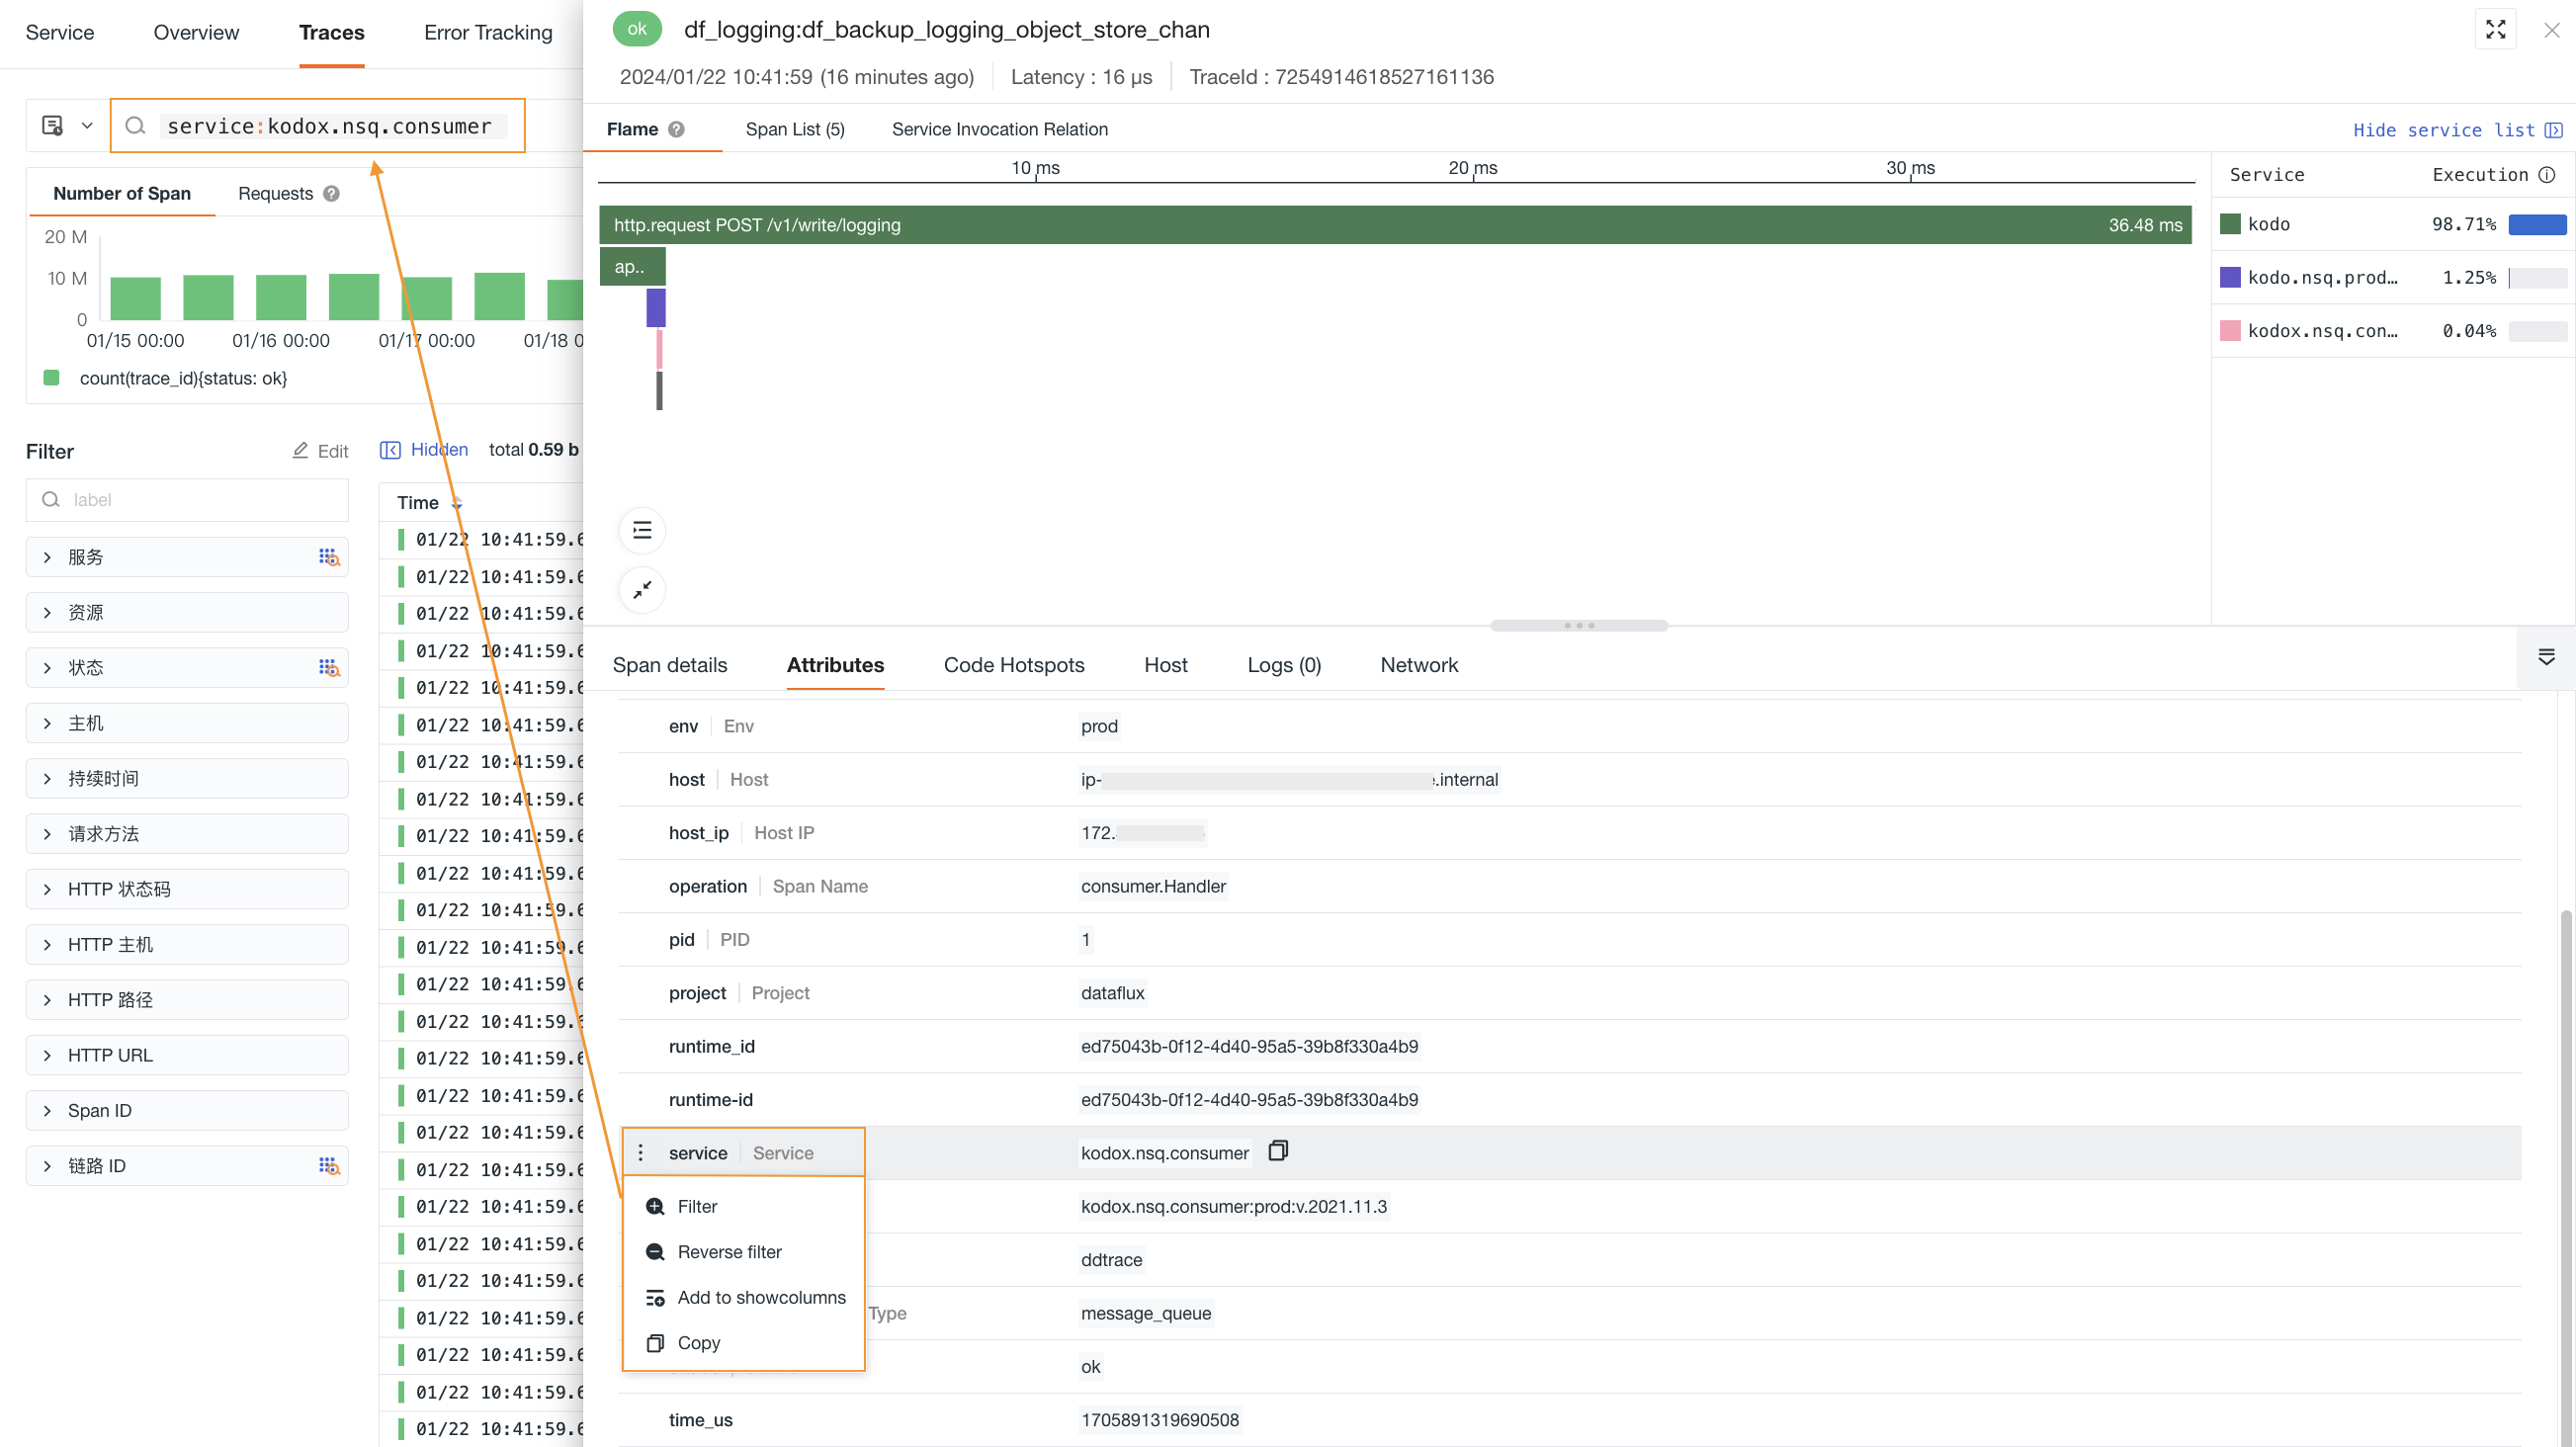
Extended Attributes
-
In the search bar, you can enter a field name or value to quickly search and locate;
-
After checking the field alias, you can view it next to the field name; you can choose as needed.
-
On the trace details page, you can view the relevant field attributes of the current trace under Extended Attributes:
Field |
Attribute |
|---|---|
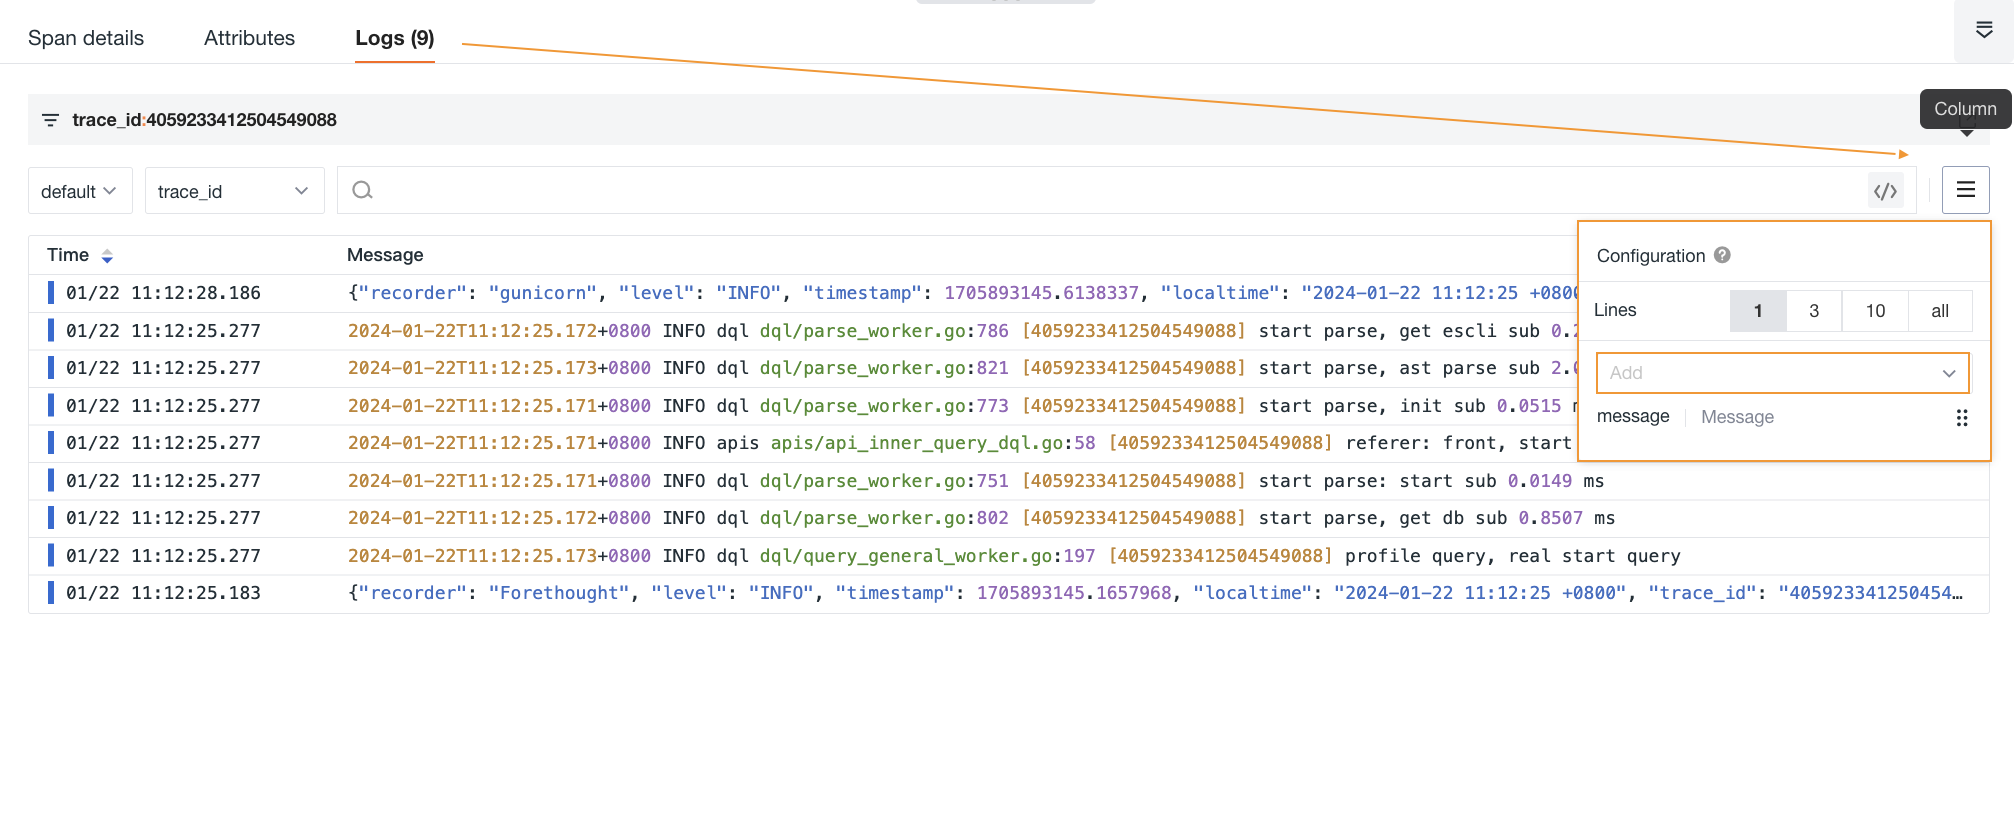
| Filter Field Value | Adds this field to the explorer to view all data related to this field. You can filter and view the trace list related to this field in the trace explorer. See Figure 1 |
| Reverse Filter Field Value | Adds this field to the explorer to view all data except for this field. |
| Add to Display Column | Adds this field to the explorer list for viewing. |
| Copy | Copies this field to the clipboard. |
Some fields do not support filtering, aggregation, and related logic.
Guance has some fields that use full-text indexing. These fields do not support filtering, aggregation, and related logic. The scope of full-text indexed fields is as follows:
| Category | Fields |
|---|---|
| Object, Resource Catalog | message |
| Log, Backup Log | message |
| Security | message / title |
| Network | message |
| Trace | error_message / error_stack |
| Event | message / title / df_message / df_title |
| RUM Error | error_message / error_stack |
| RUM Long Task | long_task_message / long_task_stack |
Figure 1
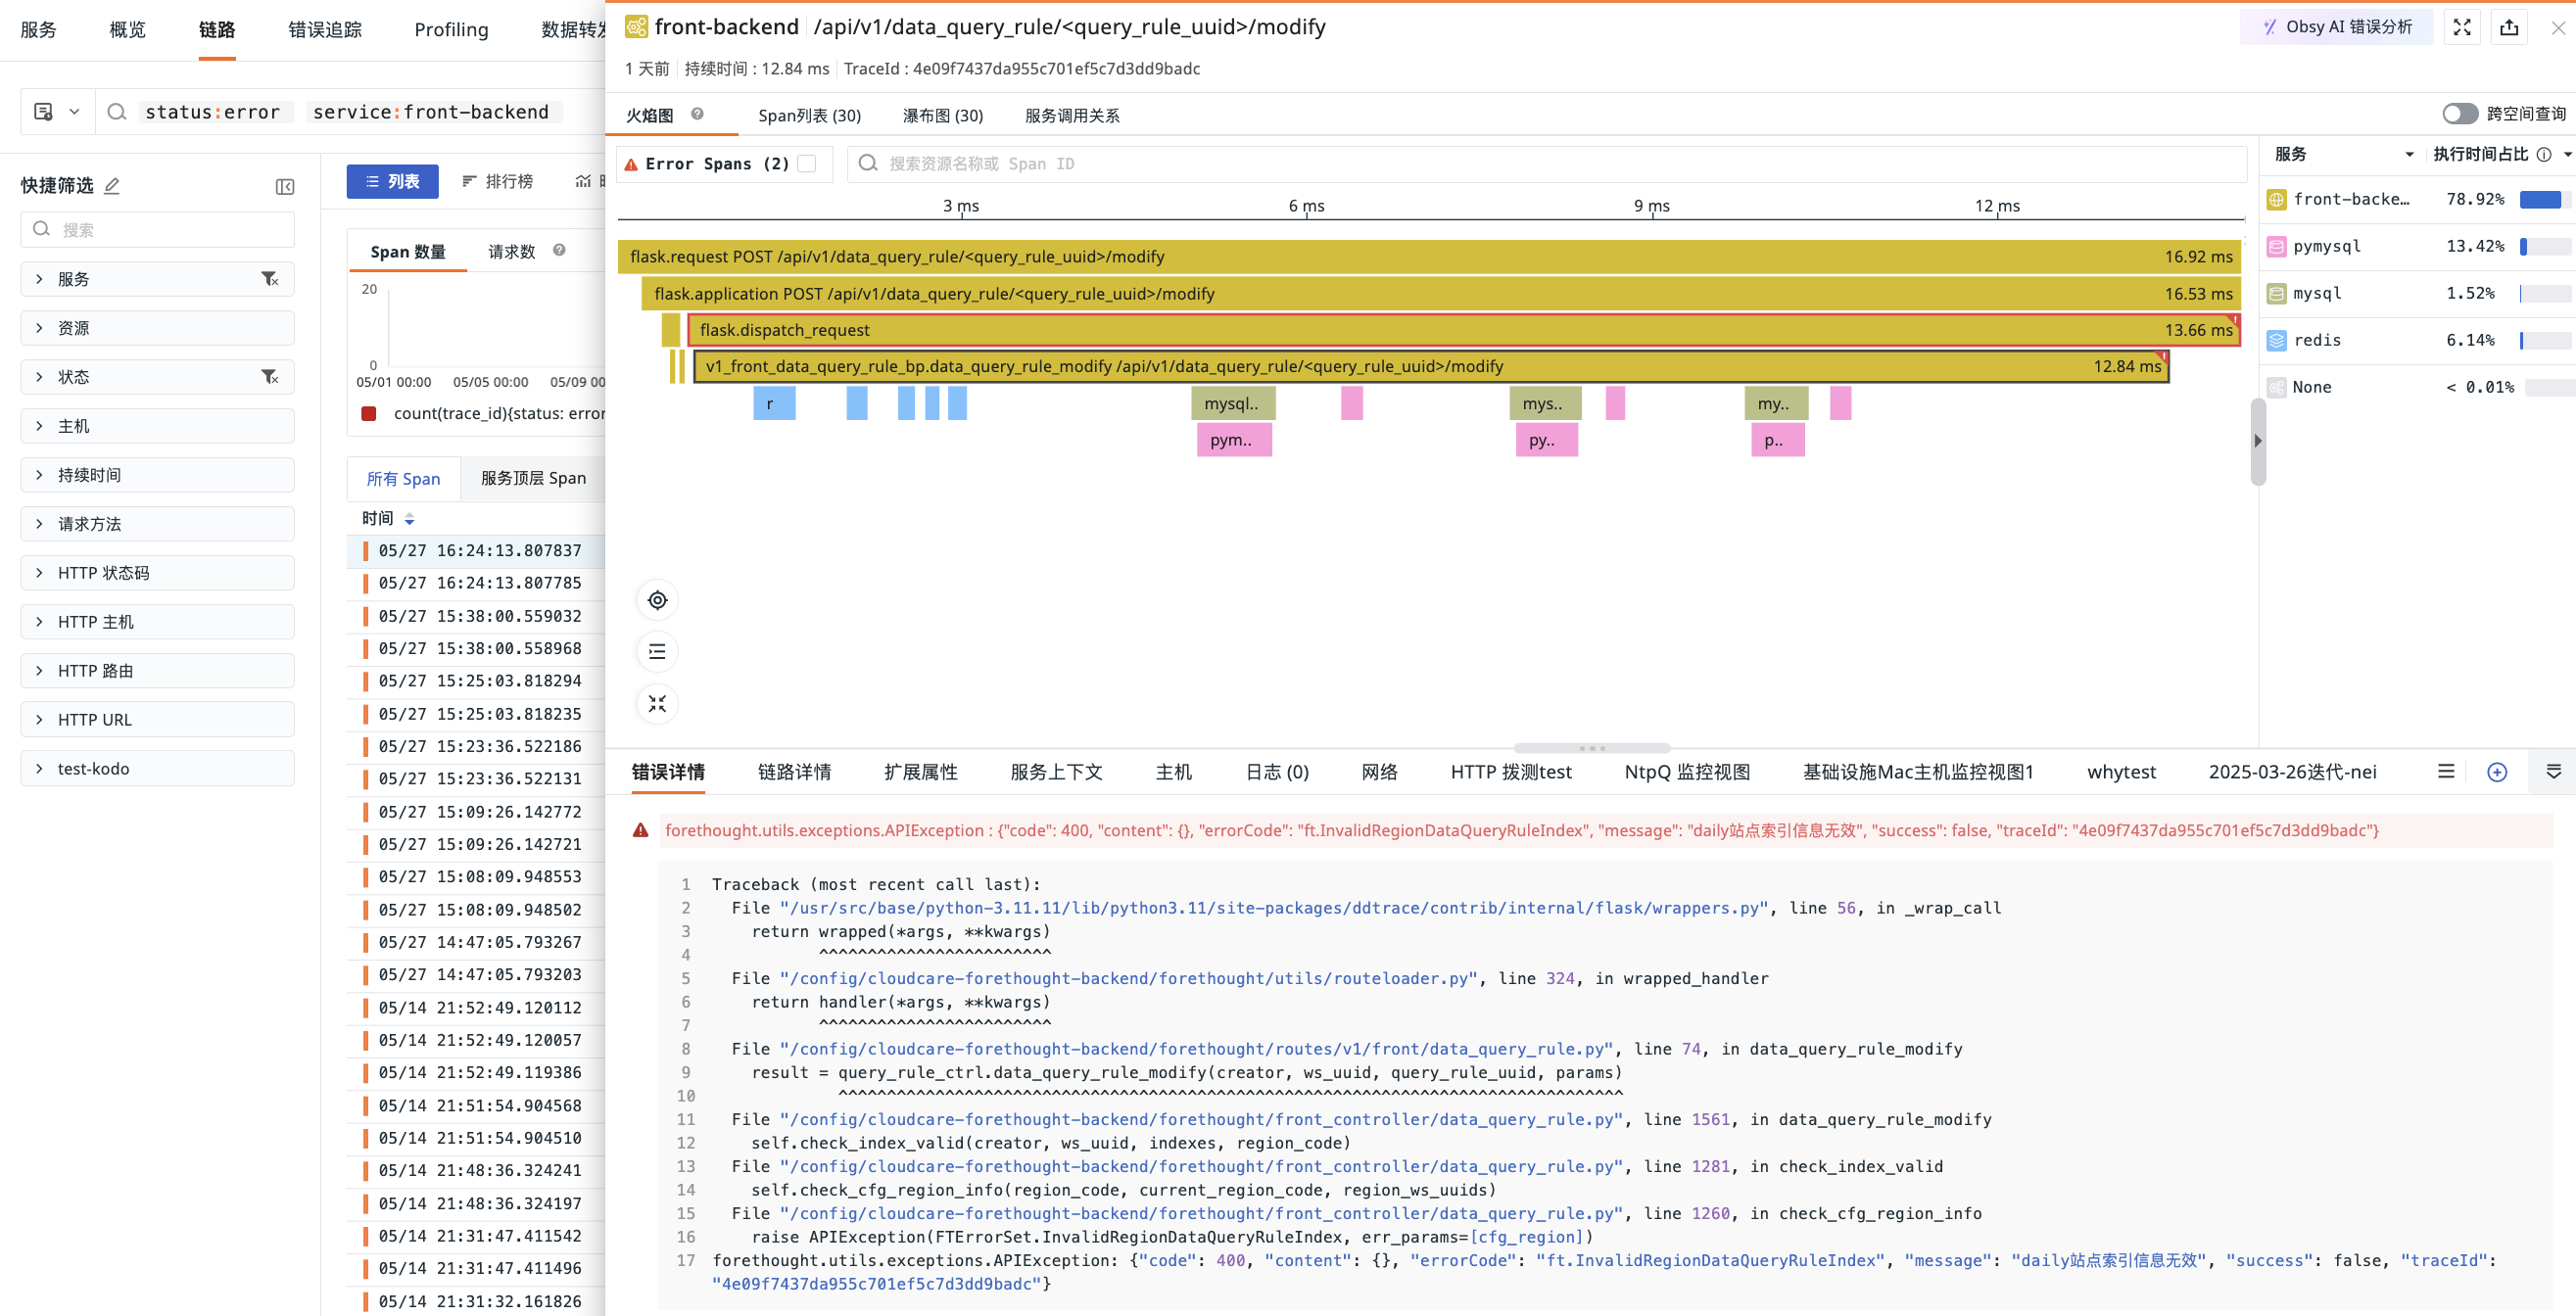
Error Details
On the trace details page, if errors exist in the current trace, you can check the error span filter in the sidebar. The system will automatically highlight all error Spans. Click any highlighted Span to view its associated error stack, logs, and other detailed information.
For more details, refer to Error Tracking.
Service Context
By obtaining object classifications under the infrastructure resource catalog and selecting the latest object based on create_time for display, you can quickly view the current service's runtime information, service dependencies, and integration information.
Correlation Analysis
You can view all log data associated with the services in the entire trace via Logs (correlation field: trace_id). You can customize the display columns. If you need to view more detailed log content, you can click the log content to jump to the log details page, or click the jump button to open it in the Logs page.

If you have administrator or higher permissions, you can customize the correlation fields. Click the settings button to the right of the correlation field, select the fields you want to correlate in the pop-up dialog, support manual input, drag-and-drop ordering, and confirm to complete the configuration.
Note: Custom fields for correlated logs and custom fields configured for service list correlation analysis affect each other. If custom fields are configured in the service list, they are displayed here as well.
When the application uses the ddtrace collector with both APM trace collection and Profile performance trace data collection enabled, the system provides Span-level correlation to view code hotspots, including execution time, methods, and execution time percentage.

Click View Profile Details to jump to the Profile details page and view more associated code.
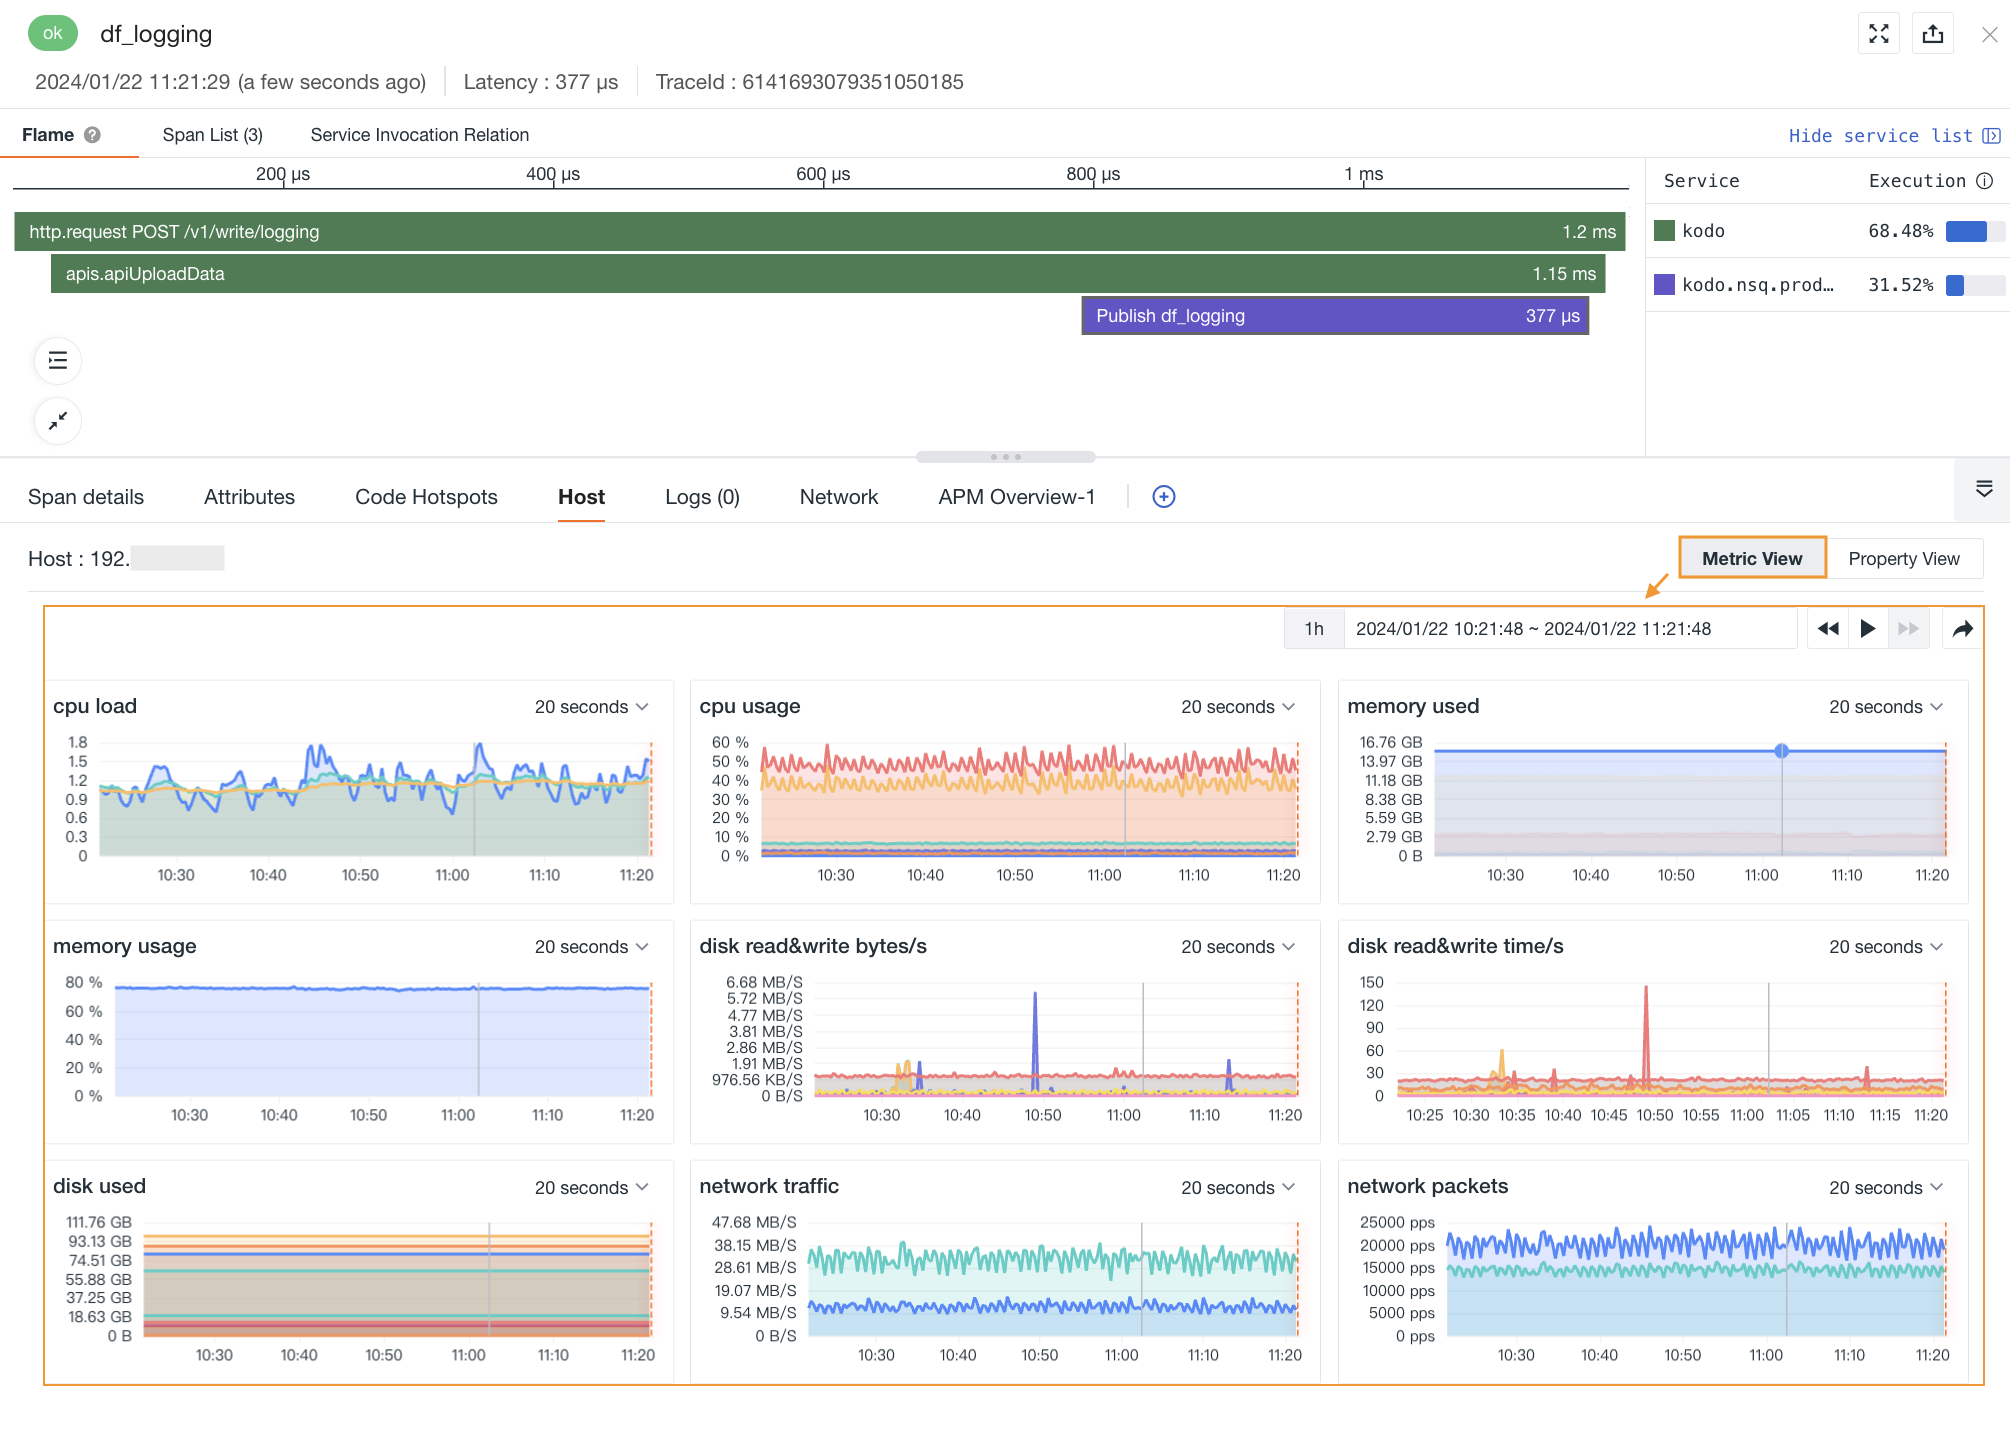
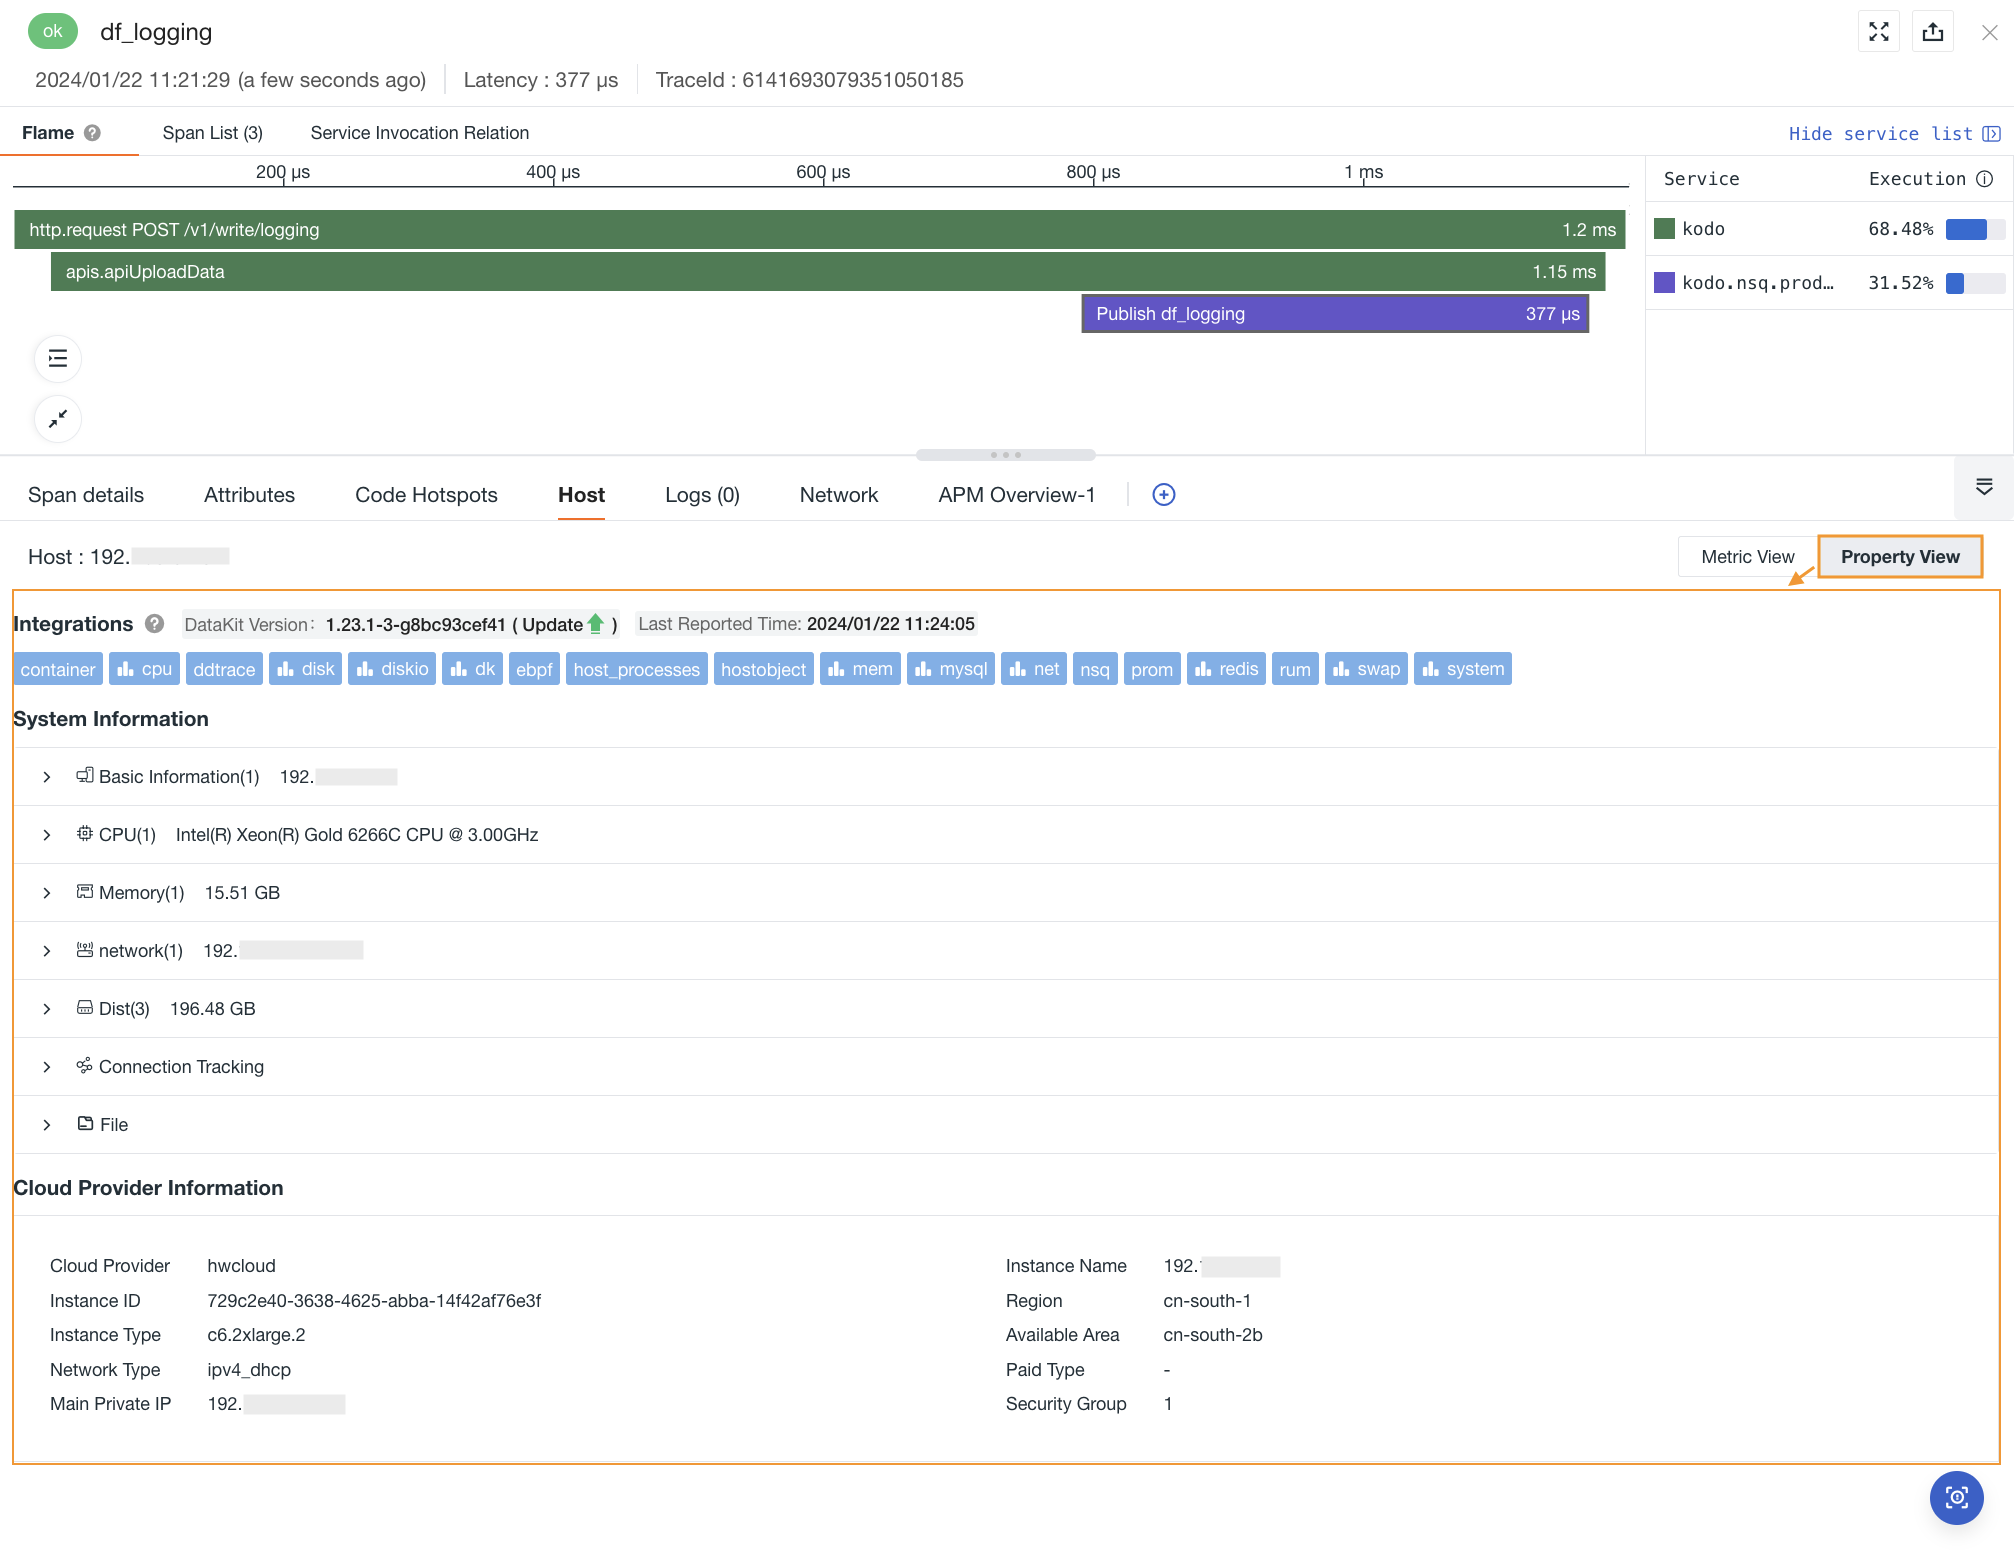
On the trace details page, you can view the metric views and attribute views of related hosts via Hosts (correlation field: host).
- Metric View: You can view the performance metric status of related hosts from 30 minutes before the trace ended to 30 minutes after the trace ended, including CPU, memory, and other performance metric views for the related hosts.
- Attribute View: Helps you trace back the actual state of the host object when the trace was generated. It supports viewing the latest object data generated by the related host within the corresponding time period, including basic host information and integration operation status. If cloud host collection is enabled, cloud provider information can also be viewed.
Note: Guance by default retains host object history data from the last 48 hours. If no host history data corresponding to the current trace time is found, you will not be able to view the attribute view of the correlated host.
On the trace details page, you can view the metric views and attribute views of related containers via Containers (correlation field: container_name).
-
Metric View: Supports viewing the performance metric status of related containers from 30 minutes before the trace ended to 30 minutes after the trace ended, including container CPU, memory, and other performance metric views.
-
Attribute View: Helps you trace back the actual state of the container object when the trace was generated. It supports viewing the latest object data generated by the related container within the corresponding time period, including basic container information and attribute information.
On the trace details page, you can view the attribute views and metric views of related Pods via Pods (correlation field: pod_name).
-
Metric View: Supports viewing the performance metric status of related container Pods from 30 minutes before the trace ended to 30 minutes after the trace ended, including container CPU, memory, and other performance metric views.
-
Attribute View: Helps you trace back the actual state of the container Pod object when the trace was generated. It supports viewing **the latest object data generated by the related container Pod within the corresponding time period, including basic container information and attribute information.
Guance supports viewing network topology maps and overview data across multiple dimensions including Host, Pod, Deployment, and Service in Network.
Matching Fields:
To view the correlated network in the details page, the corresponding correlation fields must be matched. This means the corresponding field tags need to be configured during data collection; otherwise, the correlated network view cannot be matched and viewed in the details page.
-
Host: Match field
host. -
Pod:
| Matching Field Priority |
|---|
| namespace, pod_name |
| namespace, pod |
| pod_name |
| pod |
- Deployment:
| Matching Field Priority |
|---|
| namespace, deployment_name |
| namespace, deployment |
| deployment_name |
| deployment |
- Service:
| Matching Field Priority |
|---|
| namespace, service_name |
| namespace, service |
Note:
- If correlation fields for Host, Pod, Deployment, and Service are all queried, the network data is displayed in this order when entering the details page;
- If no correlation fields are found, it is displayed as gray at the end, with a prompt No network view matched when clicked.