Service Details
Click a service in Performance Metrics or Unified Catalog > Services to enter the Service Details page.
When you enter from cross-workspace query results, the details use the source workspace of the selected service and display the currently viewed workspace and service name. Services with the same name in different workspaces are queried separately; in cross-workspace read-only mode, you cannot modify service configurations, create monitors, or bind views. For related conditions, see Cross-Workspace Query Notes.
Components
The Service Details page consists of tabs such as Summary and Resource Invocation, as well as elements such as the Time Widget.
Summary
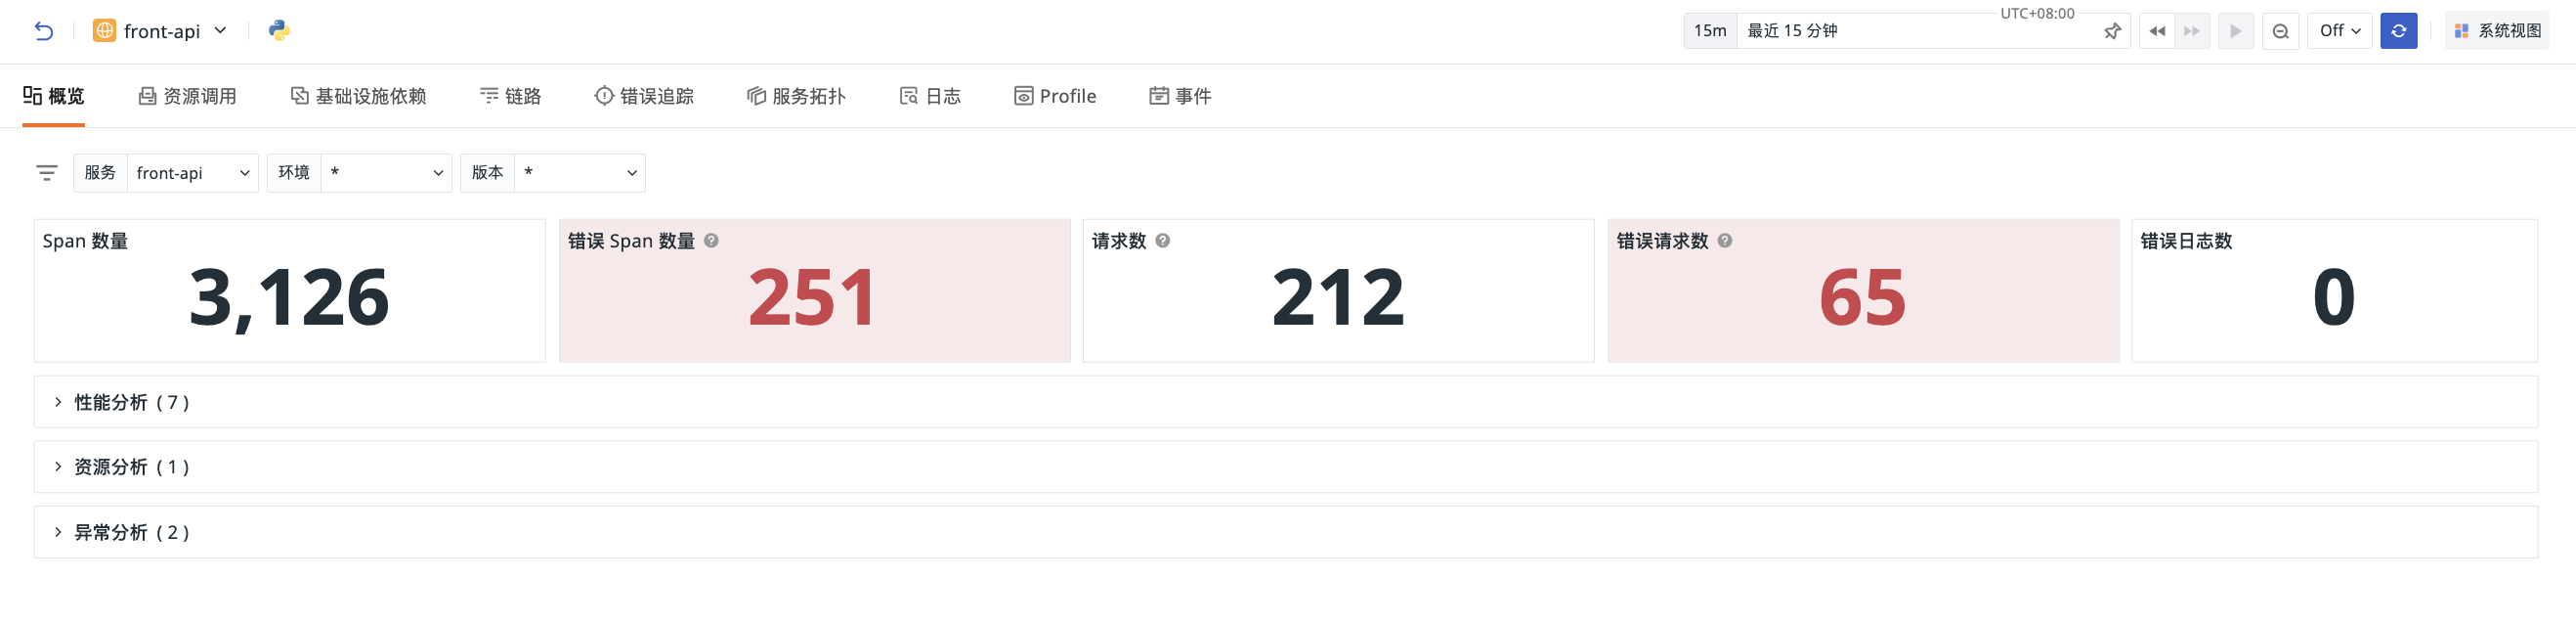
Displays the number of error spans, error request count, error log count, and error trends filtered by service, environment, and version. It also supports analysis views from different dimensions:
- Performance Analysis: covers key metrics such as average response time, service request response time, slow call count, and service request distribution;
- Resource Analysis: displays the TOP 50 data list of resource invocation analysis;
- Anomaly Analysis: presents anomalies proactively discovered by the system and their associated context, including the TOP 10 distribution of monitors associated with events, associated log status distribution, and more.
For more details, see Analysis Dashboard.
Resource Invocation
Displays resource invocation analysis for the service filtered by environment, version, and K8s cluster dimensions. On the left, the resource invocation ranking under the filter conditions is displayed. You can click any resource entry, and the detailed view of the resource is displayed on the right.
On the left side of the page, the resource invocation ranking associated with the current service is displayed. You can switch to view the invocation ranking of all resources.
- Entry Resource: the Root Span in a Trace, representing the initial request that enters the system from outside. It is the direct service entry that the system provides externally. A Trace has only one Root Span;
- All Resources: displays all invocation nodes in the trace, including the entry and all downstream dependencies. This involves a large amount of data. A Trace contains multiple Spans.
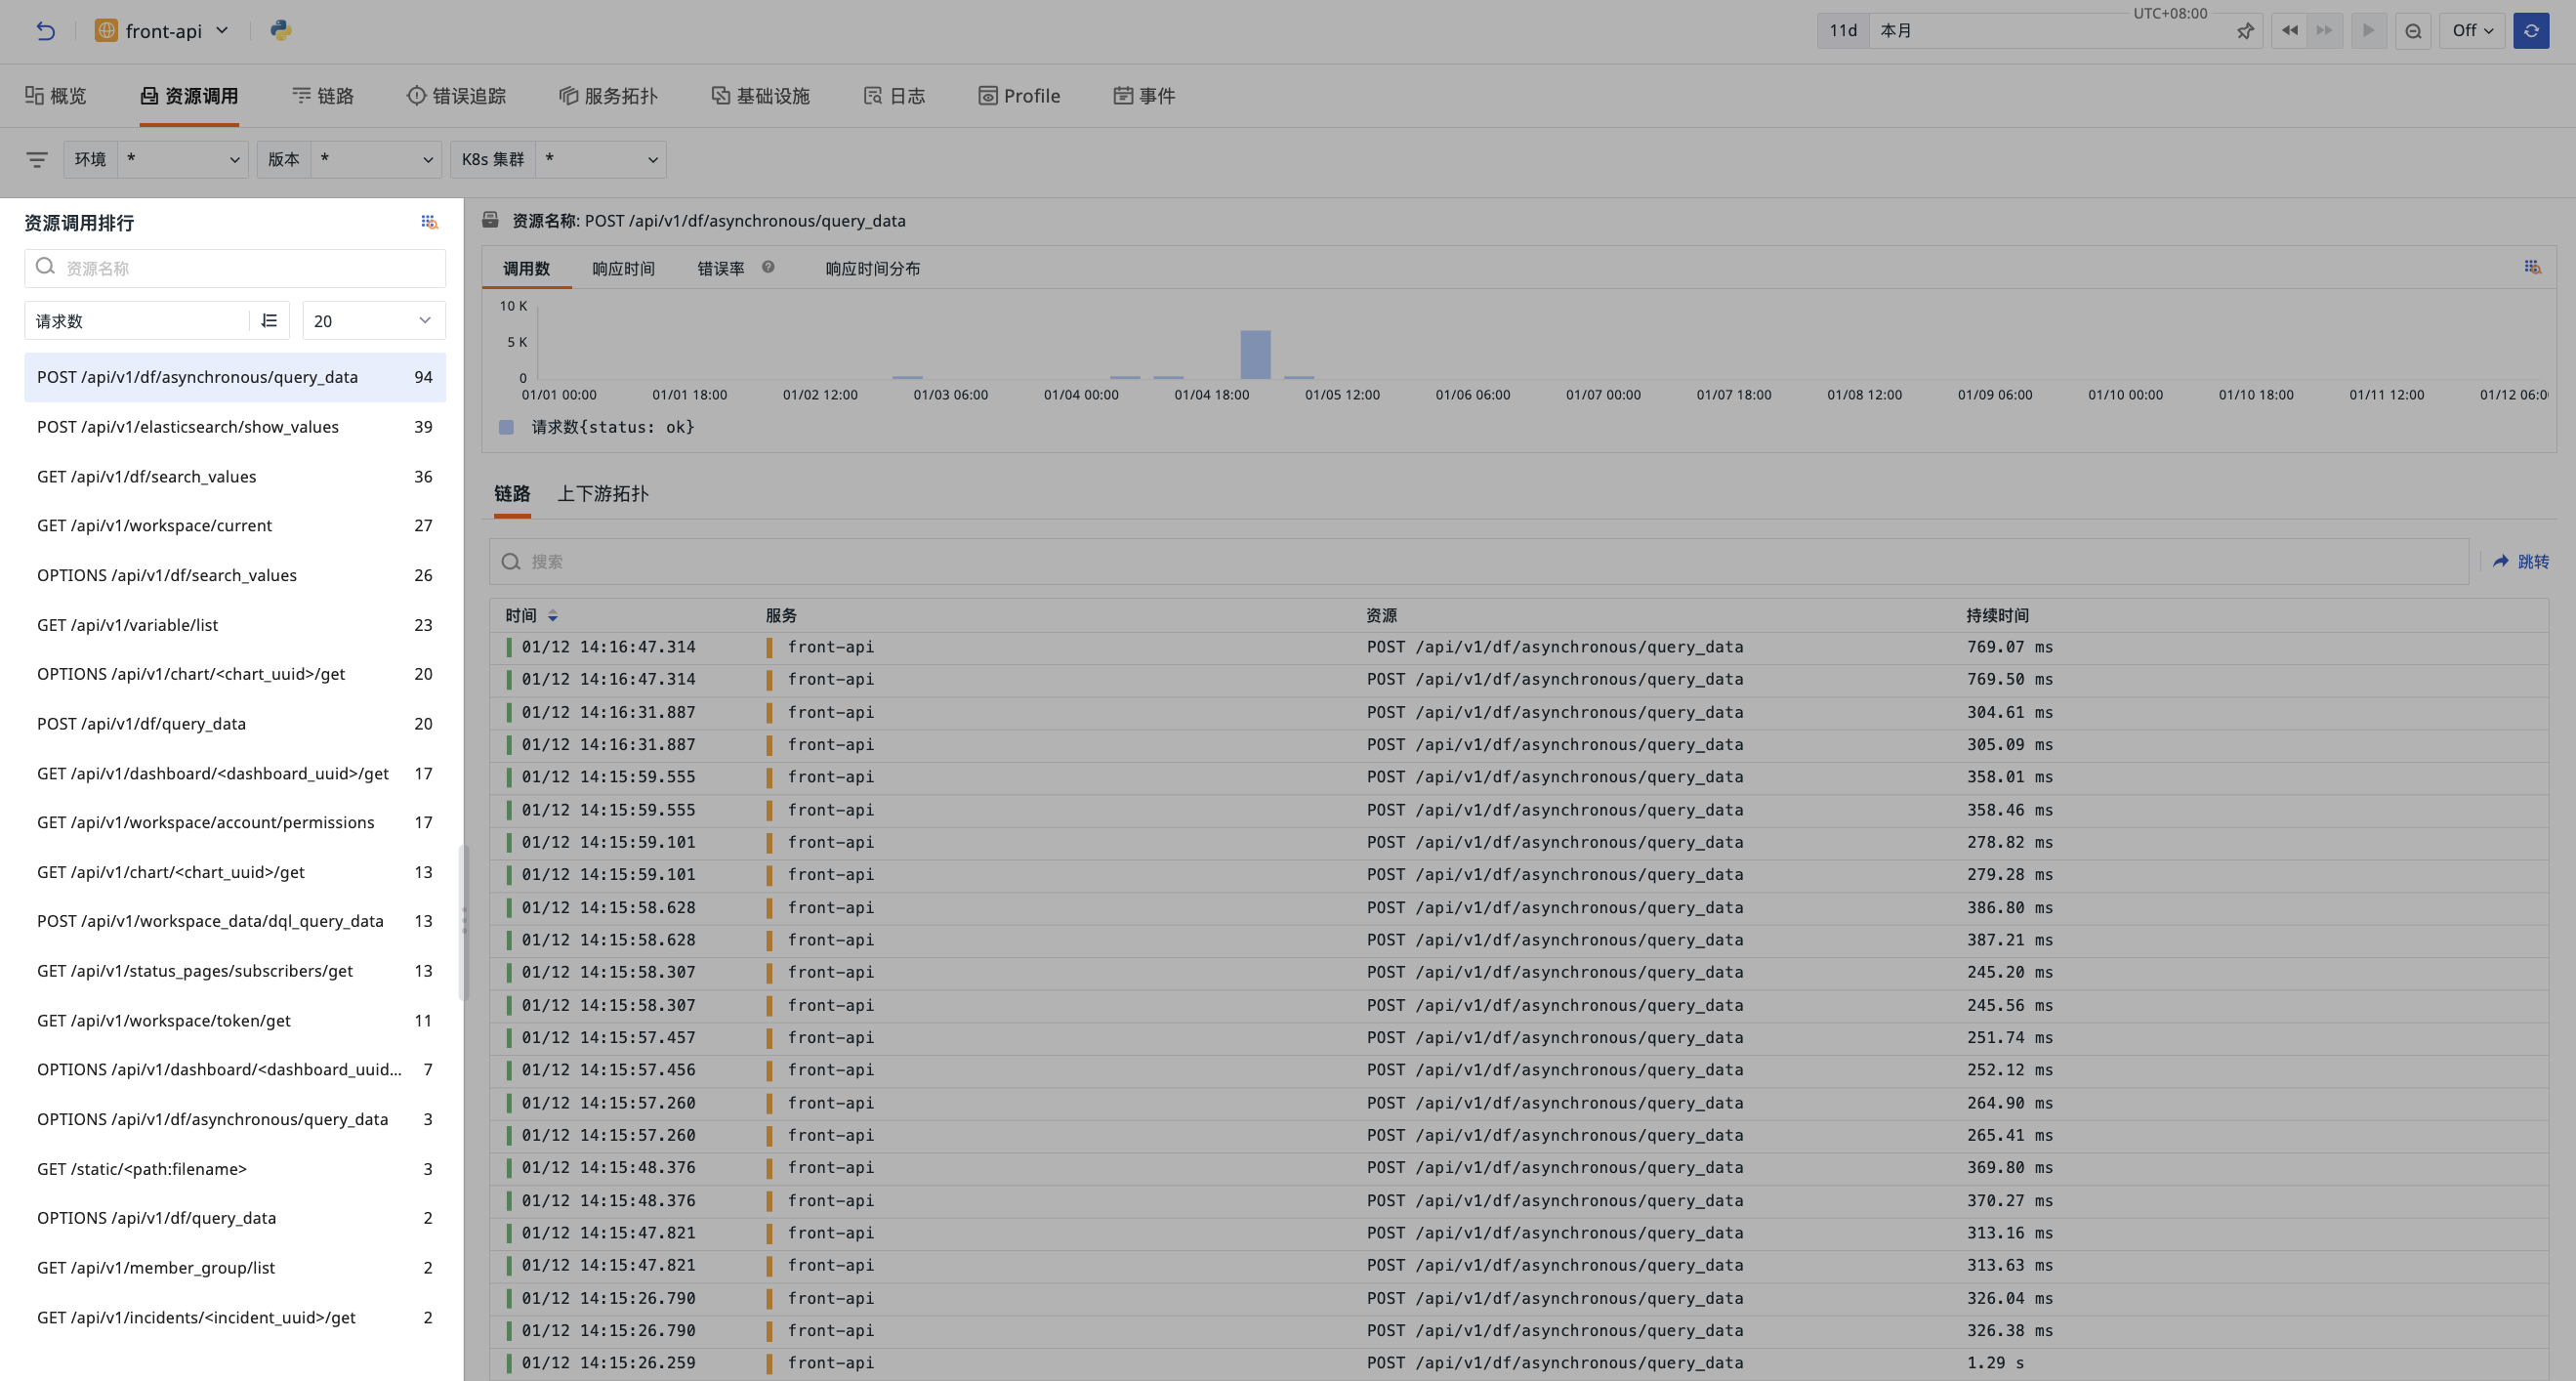
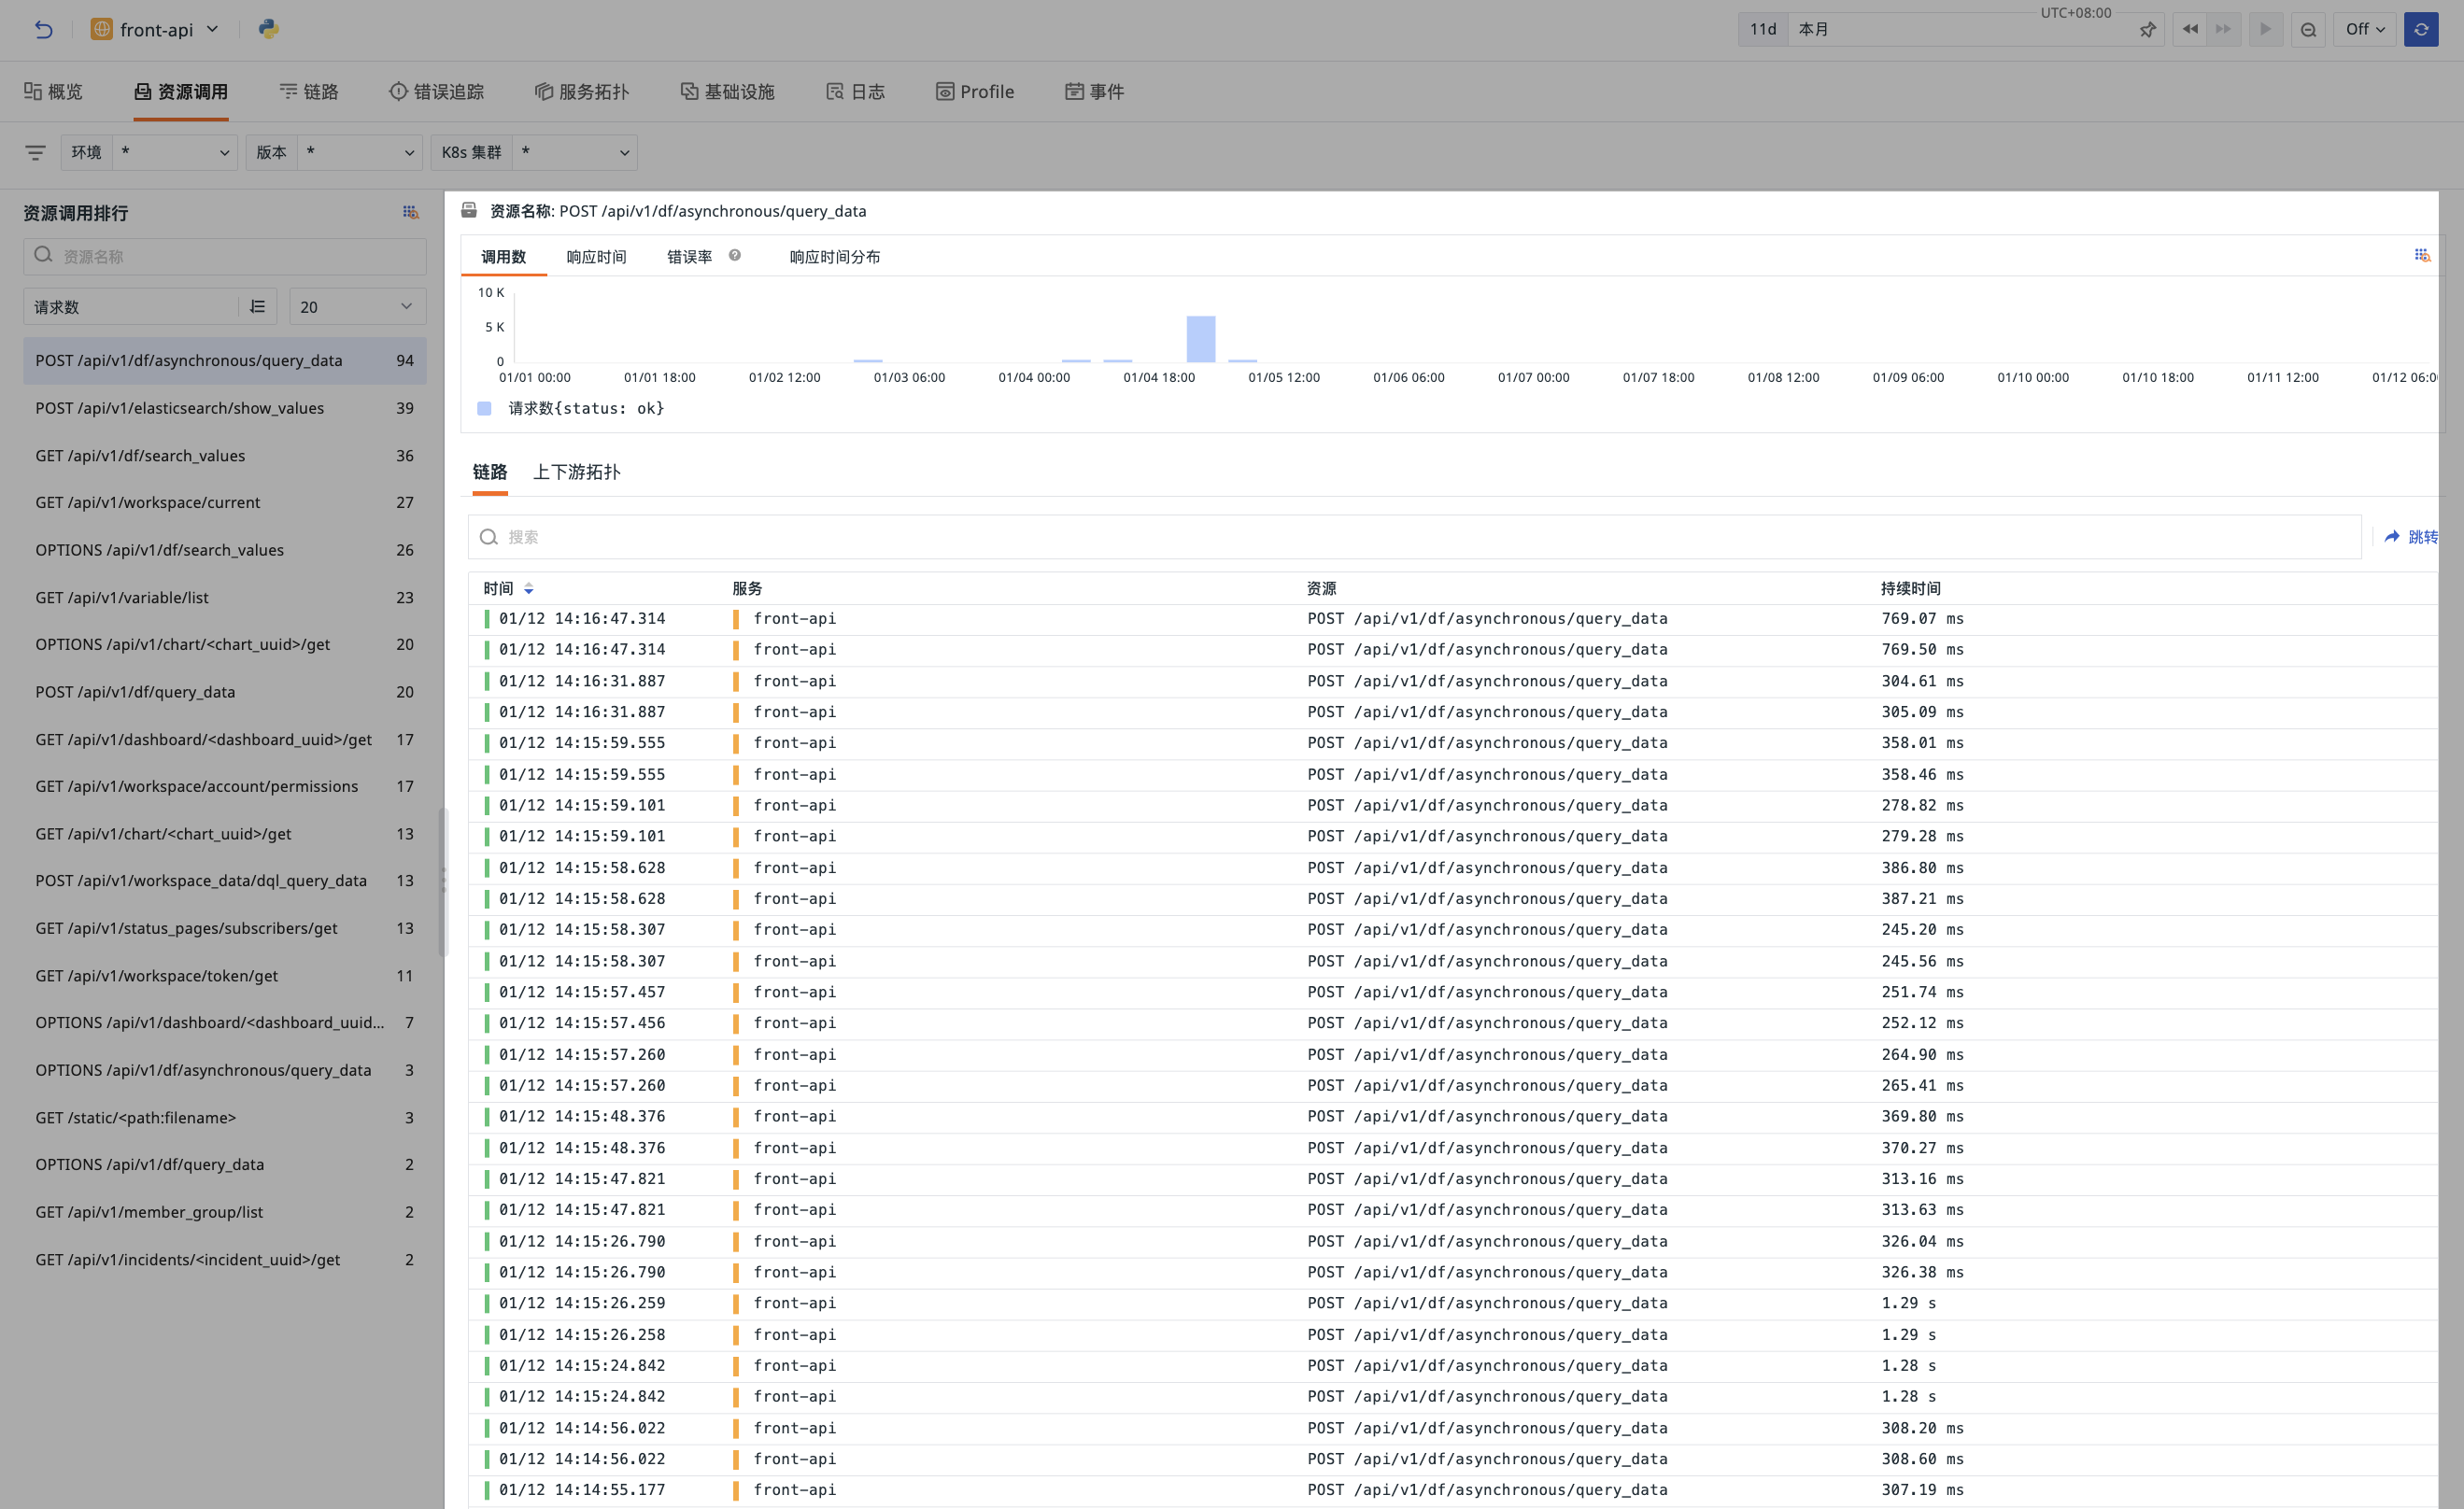
Click a resource entry, and the right side displays:
- Time Series Trend Chart: displays core metrics in chart form, including the number of calls, response time, error rate, response time distribution, and the number of requests classified by status
status: ok,error; - Complete Trace List: lists trace data related to the resource. Click to expand the details of a single trace;
-
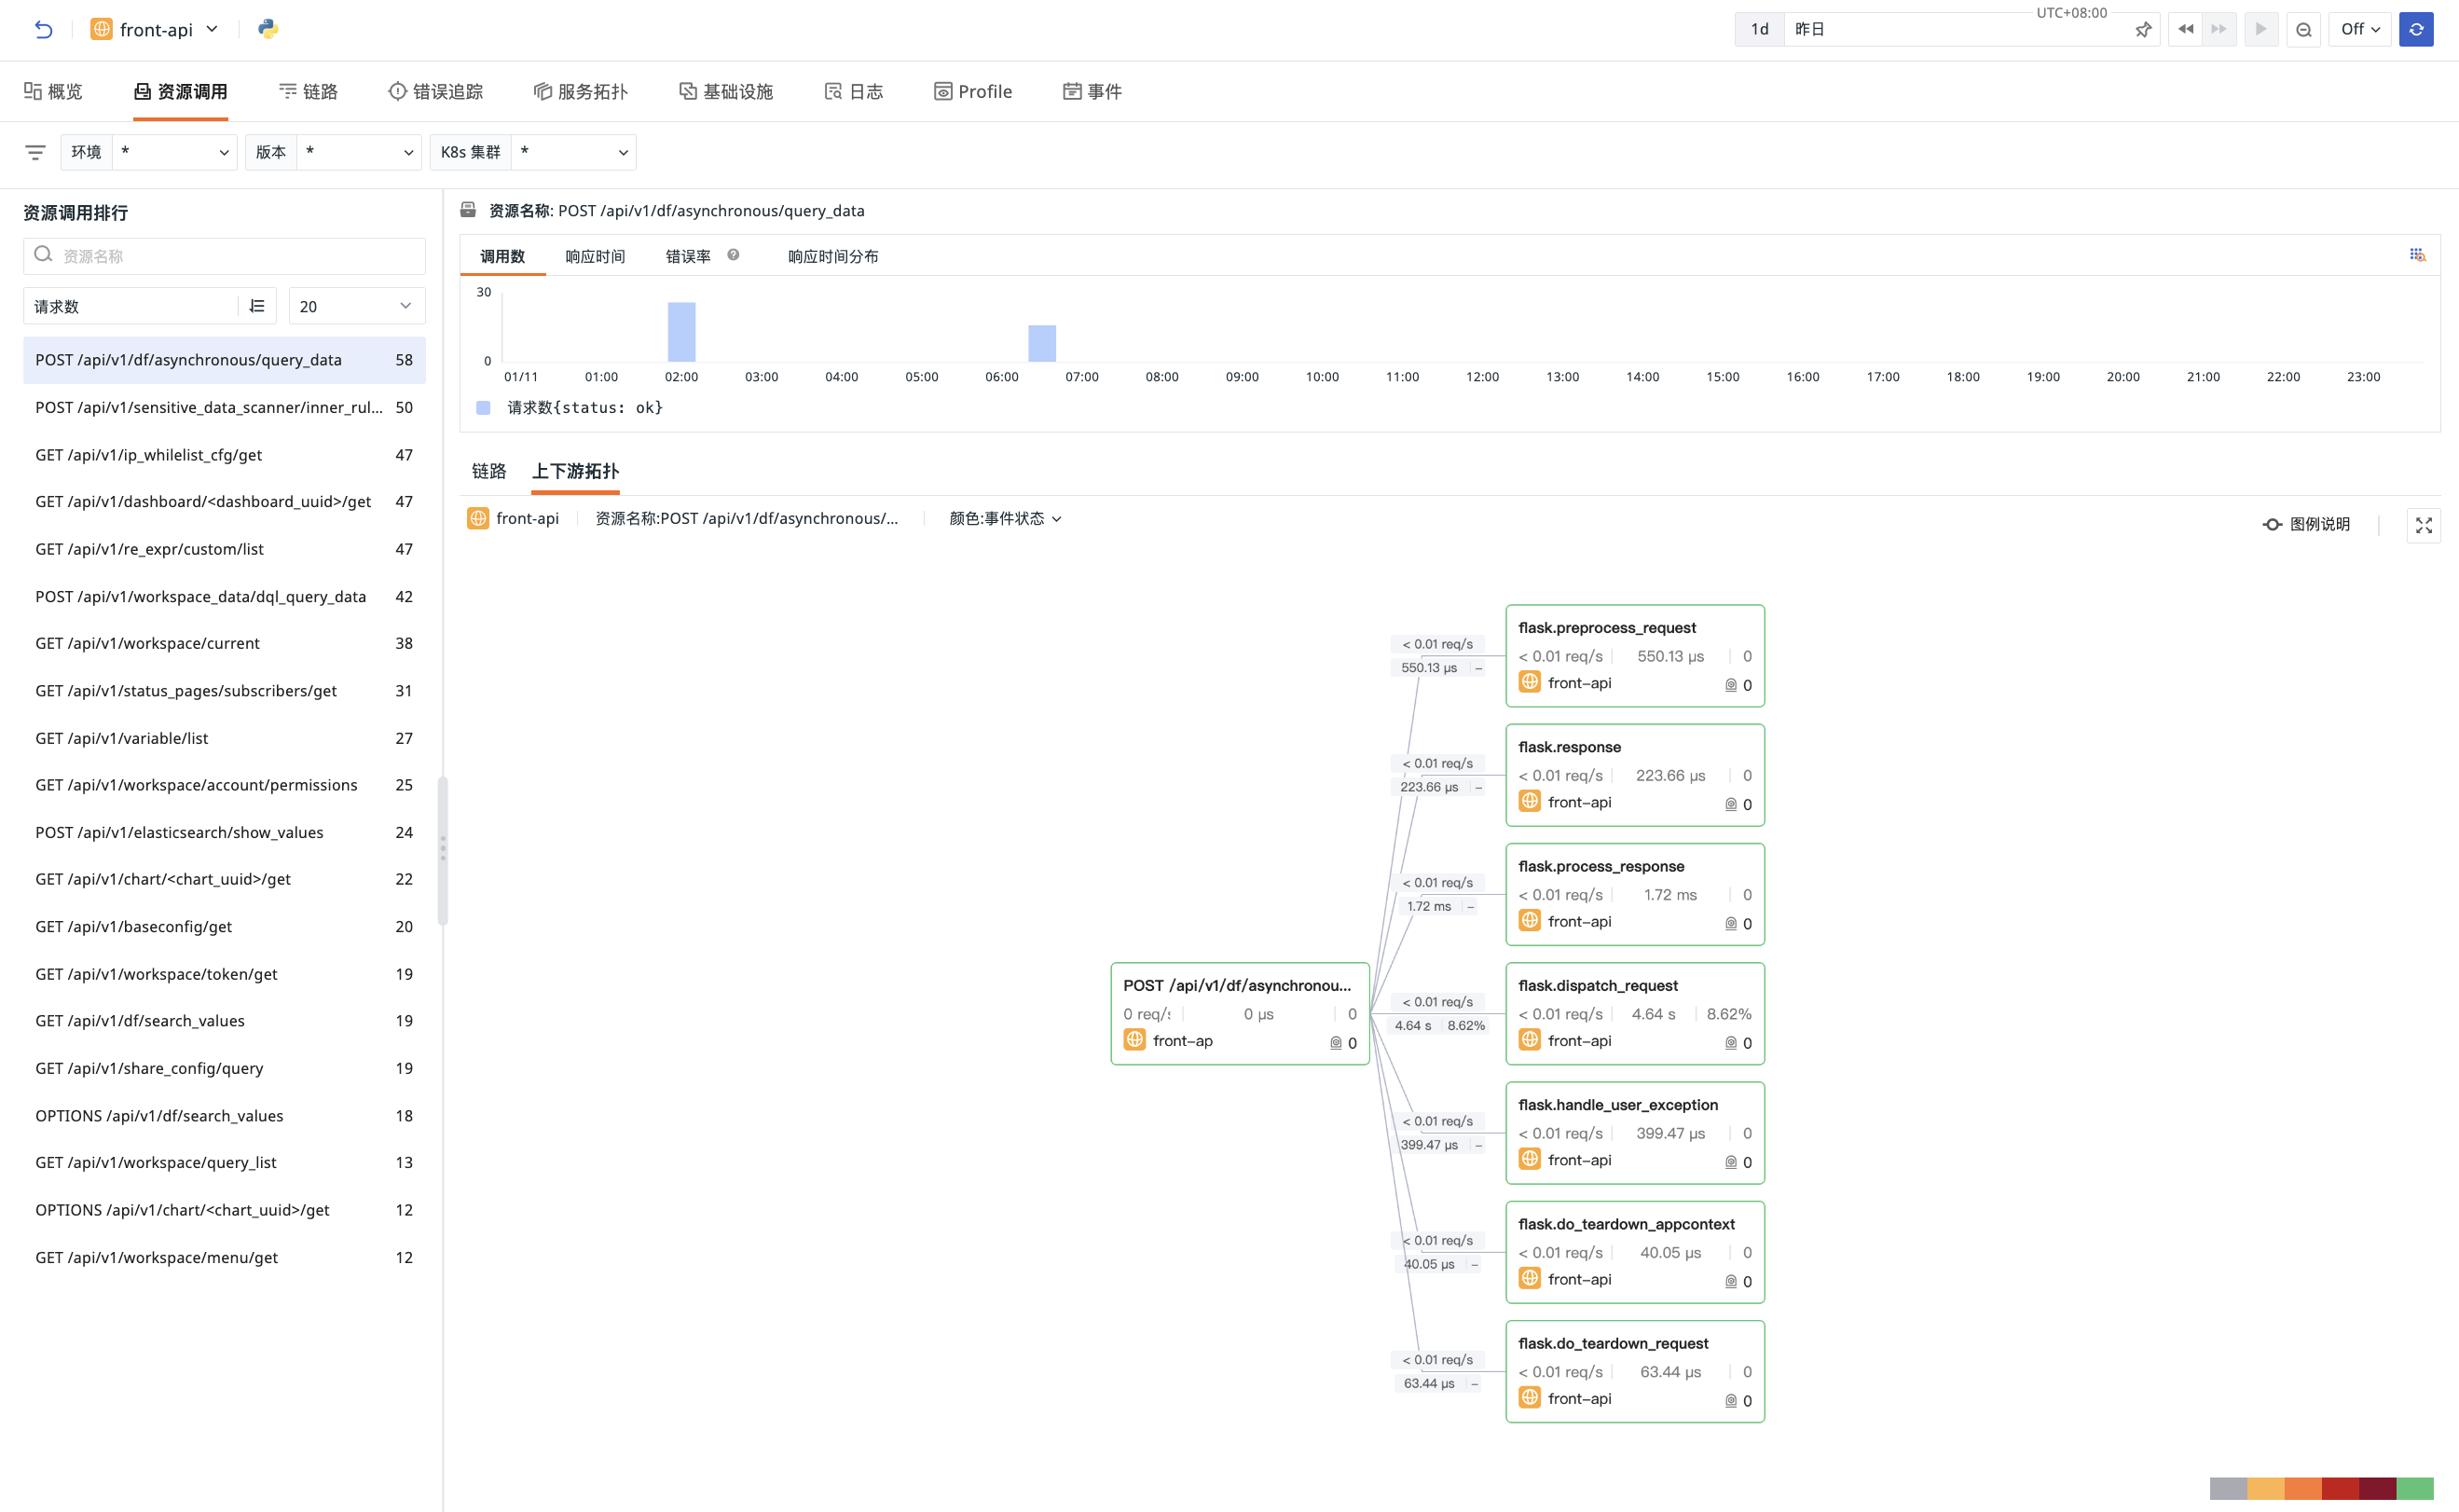
Resource Upstream/Downstream Topology: displays the upstream and downstream relationships of the current resource in the call chain and provides the following interactions:
- Fill topology node colors based on three dimensions: event status, P99 response time, and request error rate;
- Hover over a node to directly view key metric data;
-
Click any resource node in the topology to directly view its upstream/downstream calls, related logs, user access, and related events, or create a monitor based on that node;
-
Use the "View Upstream/Downstream" button to analyze the full-path call relationship layer by layer: the system dynamically displays associated resources at adjacent levels based on the current topology state (if upstream is already expanded, only downstream nodes are shown), and filters out unrelated resources to ensure that the call chain directly related to the current node is always presented;
- After adjusting or expanding the topology, click the "Restore" button to reset the node layout and display range to the initial state;
- Click the "Full Screen" button to enlarge or restore the topology with one click.
Traces
The system automatically filters trace data associated with the current service. On this page, you can perform all operations available in the Trace Explorer.
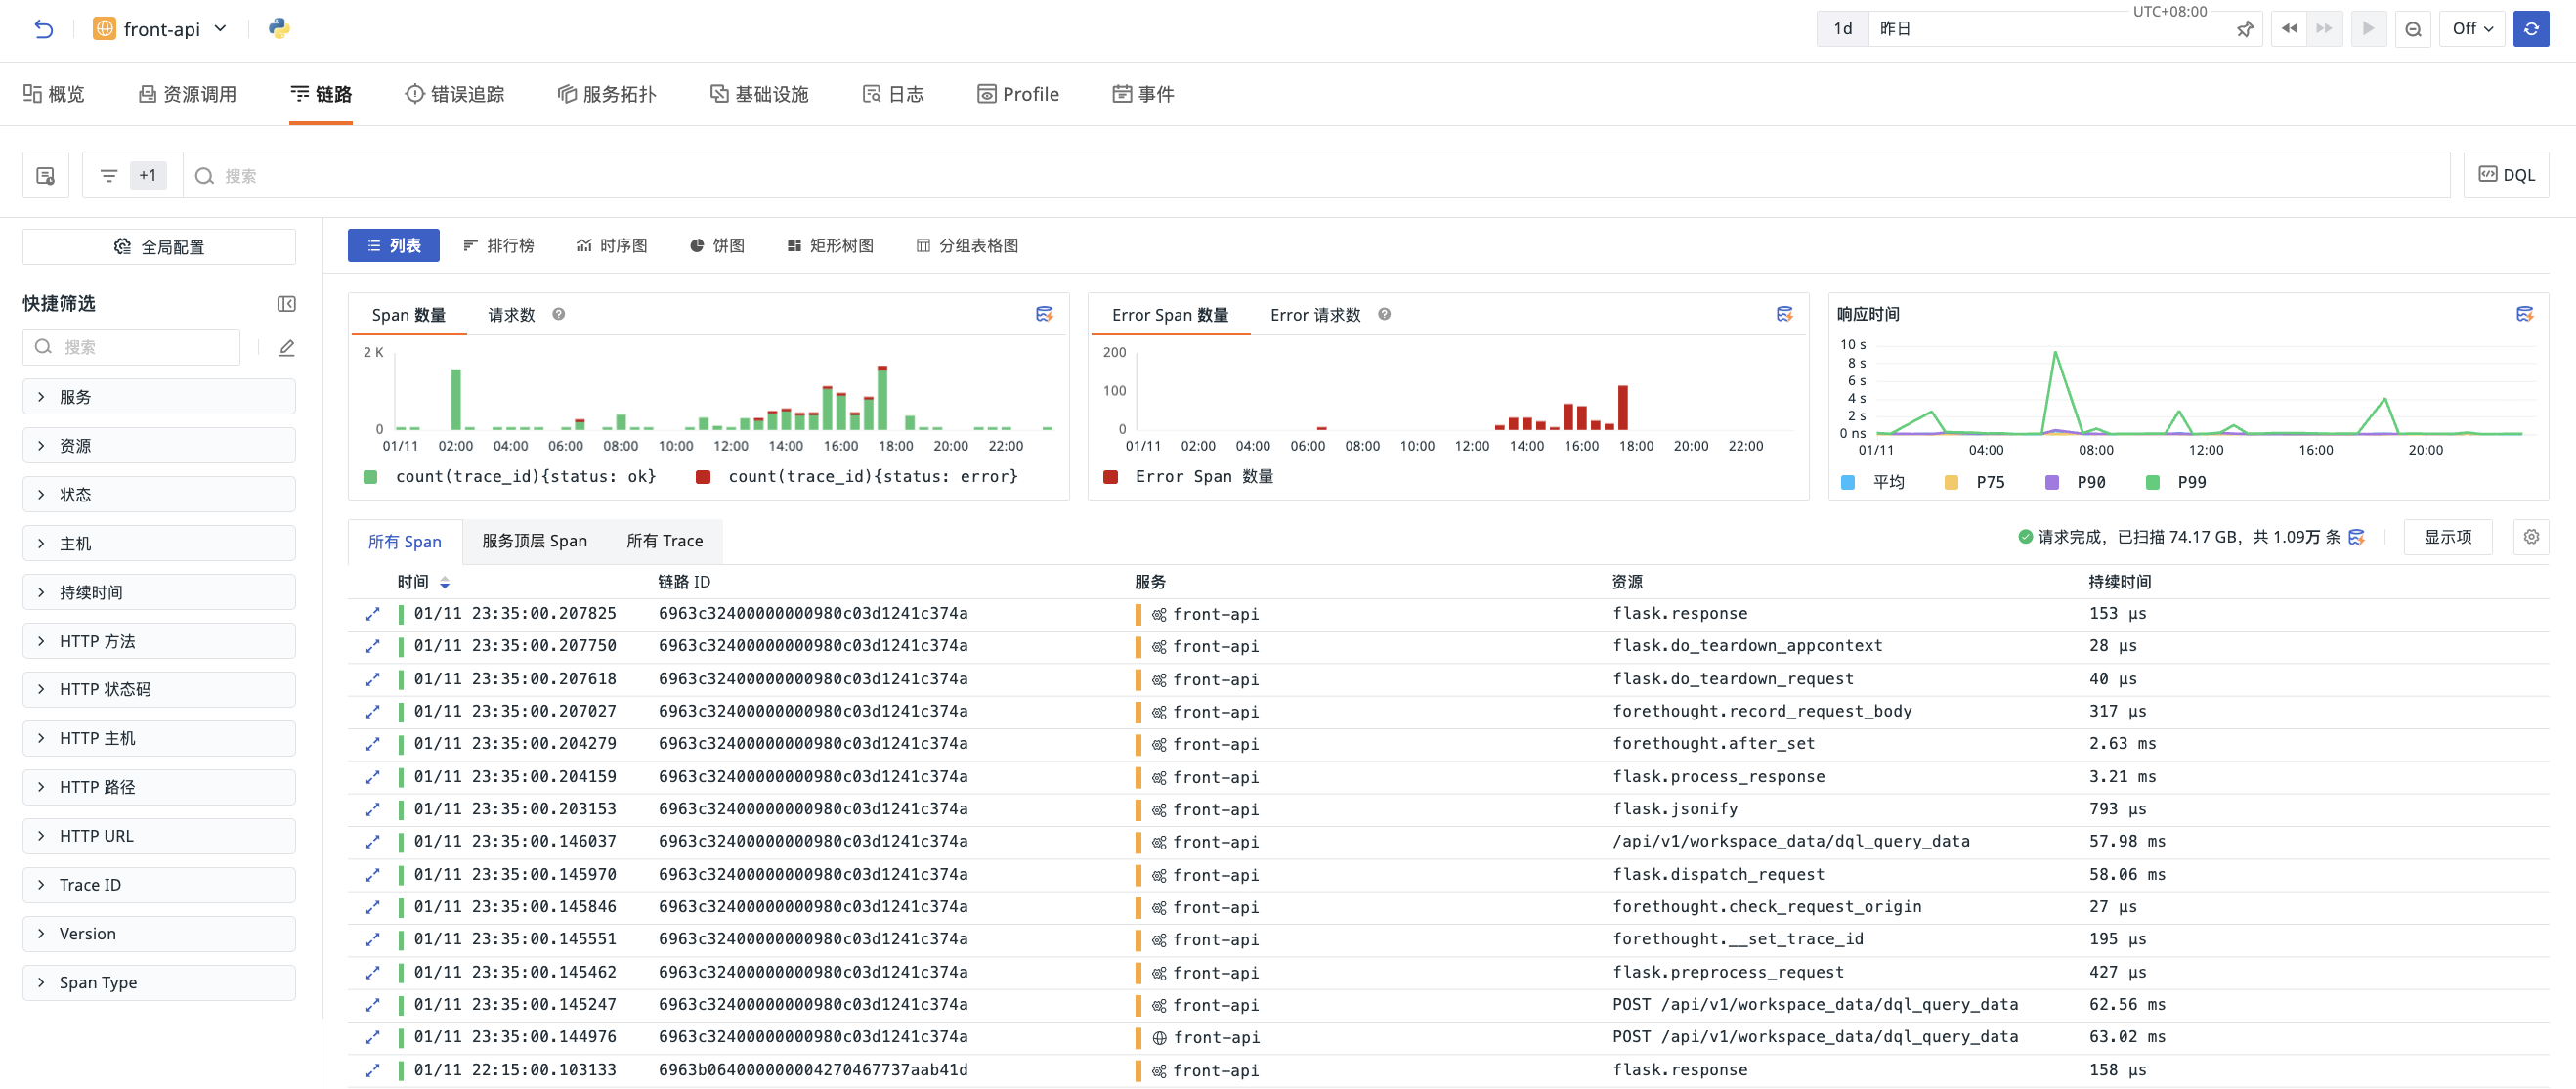
For more details, see Traces.
Error Tracking
The system automatically filters error data associated with the current service. On this page, you can perform all operations available in the Error Tracking Explorer.
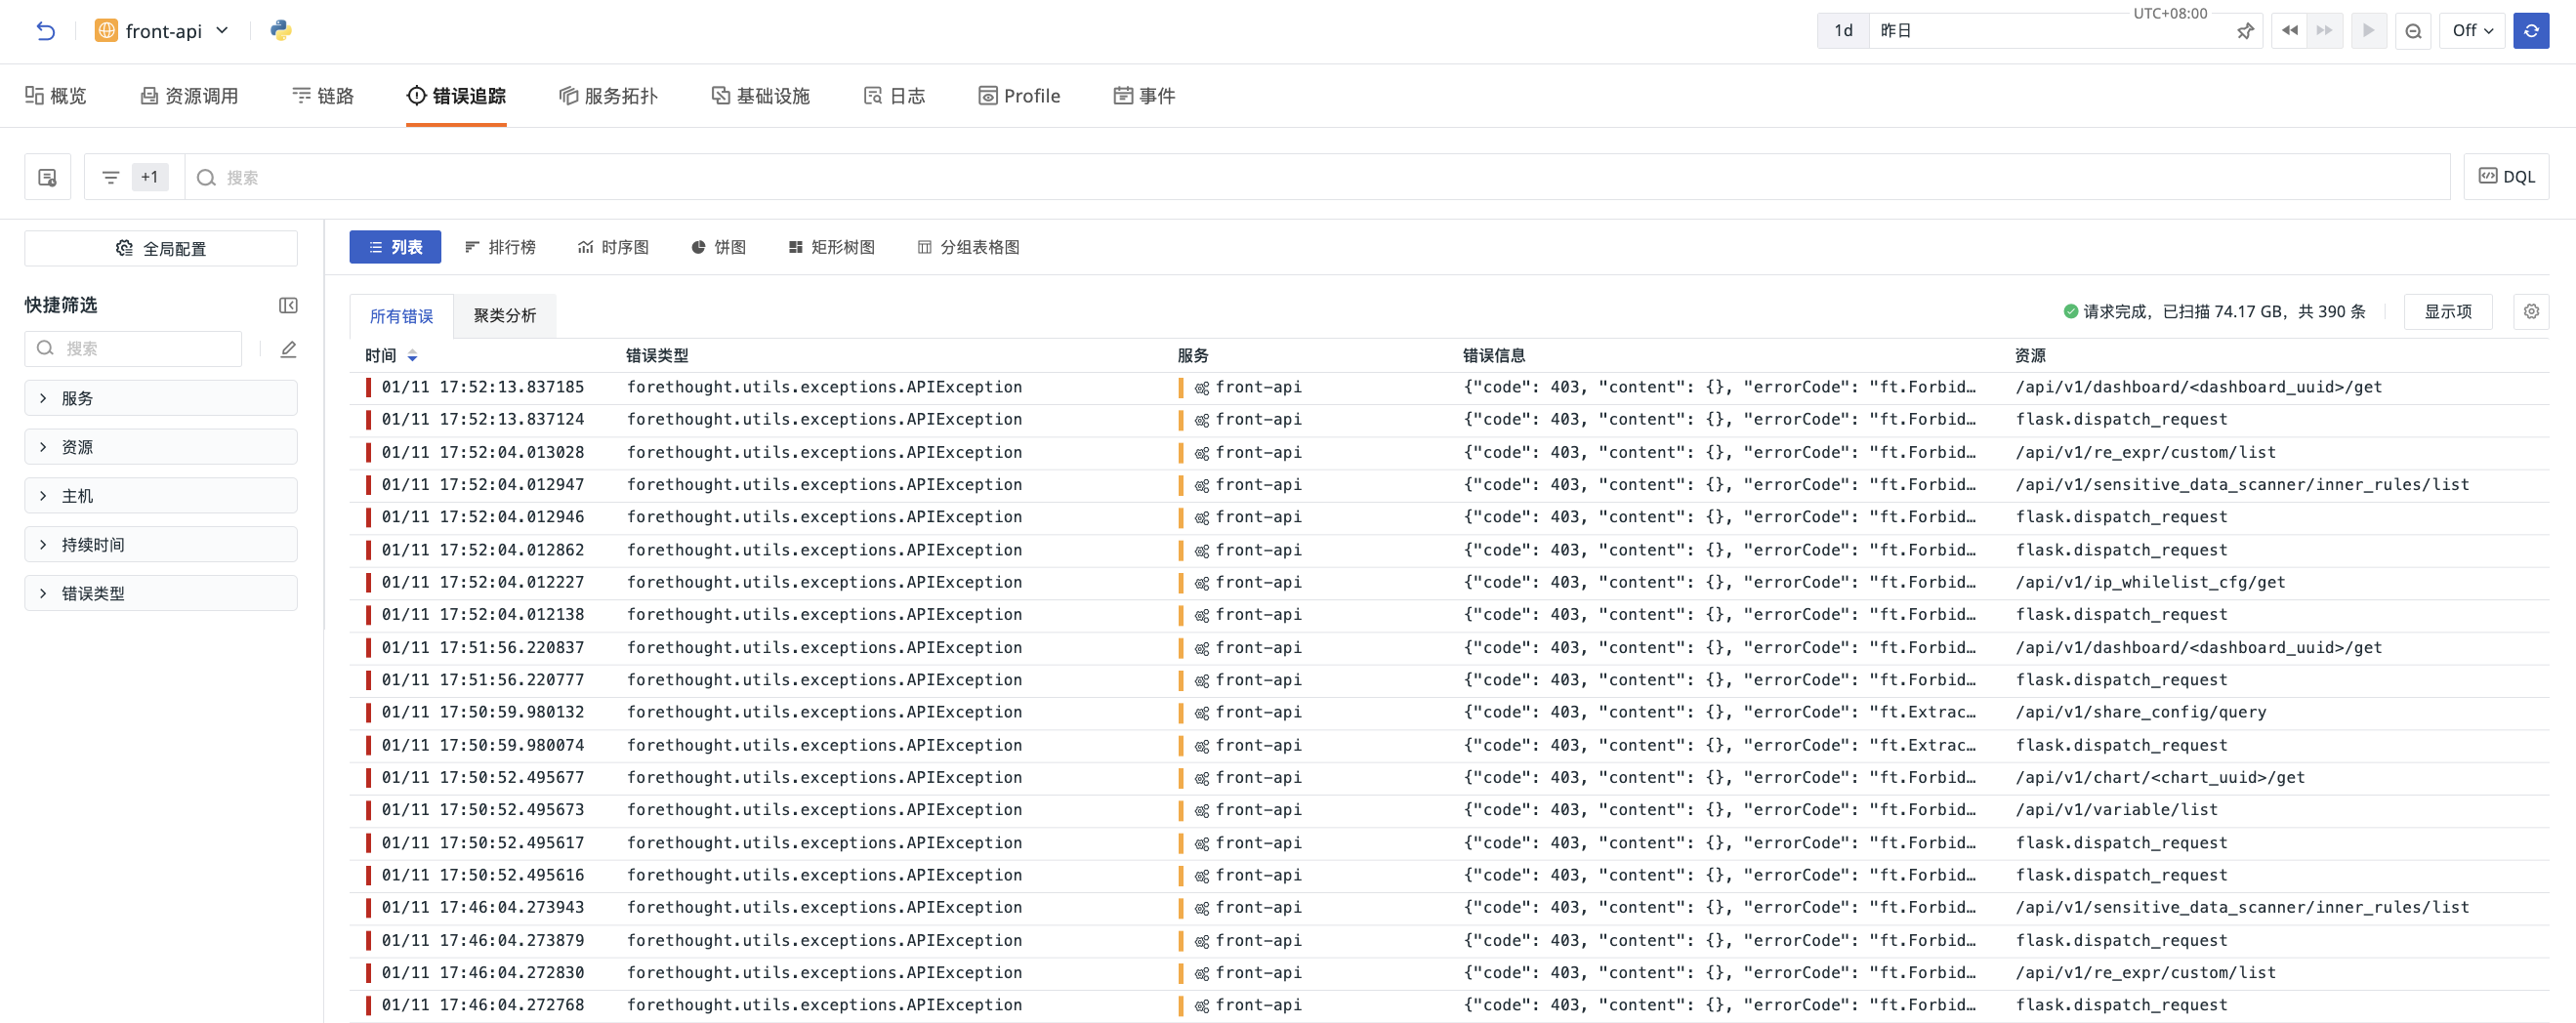
For more details, see Error Tracking.
Service Map
By default, the upstream and downstream call relationships of the current service are displayed using rectangular metric cards. Each card shows the service name, request rate, P99 response time, and error rate, with the current service highlighted. Cross-workspace services also indicate their source workspace, and services with the same name in different workspaces are displayed separately.
The call lines in the upstream/downstream topology display the number of requests, number of errors, and P99 response time. Node metrics describe the service itself, while line metrics describe the corresponding call relationship, making it easy to distinguish service performance from the calls between services. Missing metrics are displayed as -, and actual values of zero are displayed as 0.
After you search for another service in the current service topology, the system focuses on the call relationship between the current service and the target service and hides nodes and lines unrelated to their call relationship, making it easy to quickly analyze the dependency path between specified services.
You can also switch to view the full-path or infrastructure service call topology. In the "Full Path" view, the grouping feature is supported to view service call relationships, making it convenient to analyze dependencies between services by group.
The upstream/downstream view uses fixed-size cards and does not provide a setting to calculate node size by request count; the full-path view retains the original node size and grouping rules.
The following figure shows an example of the upstream/downstream view:
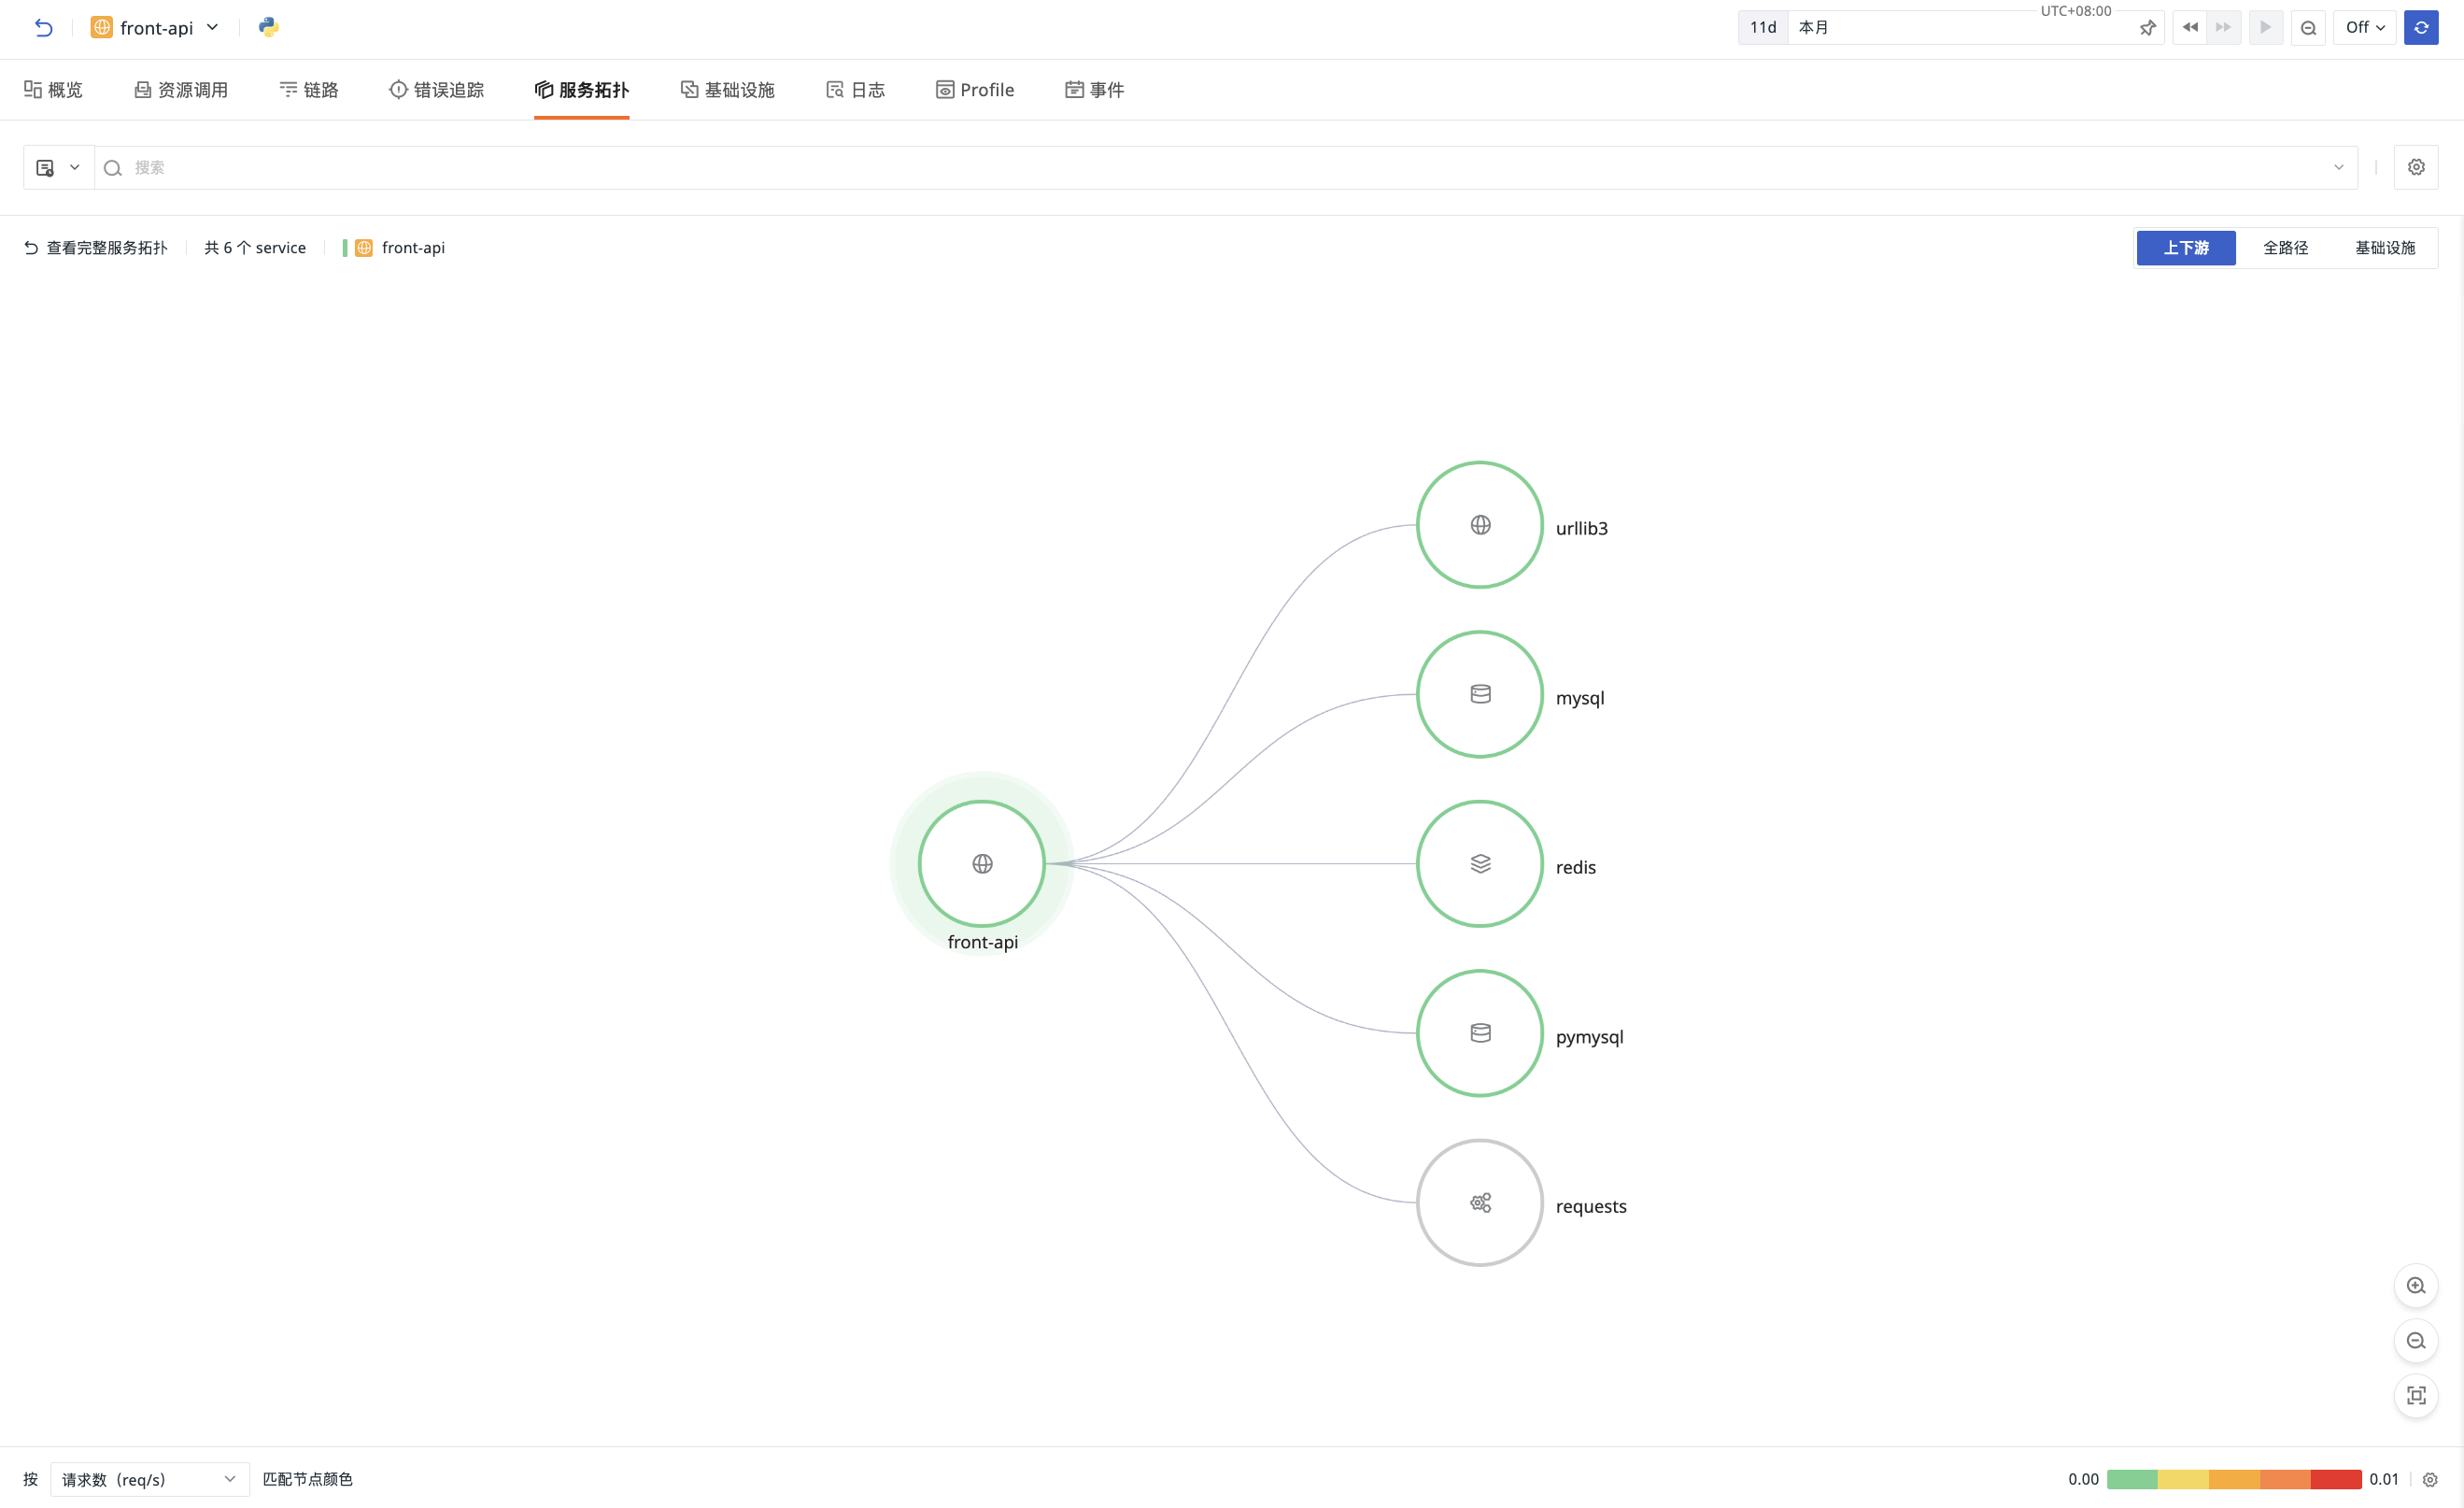
For more details, see Service Map.
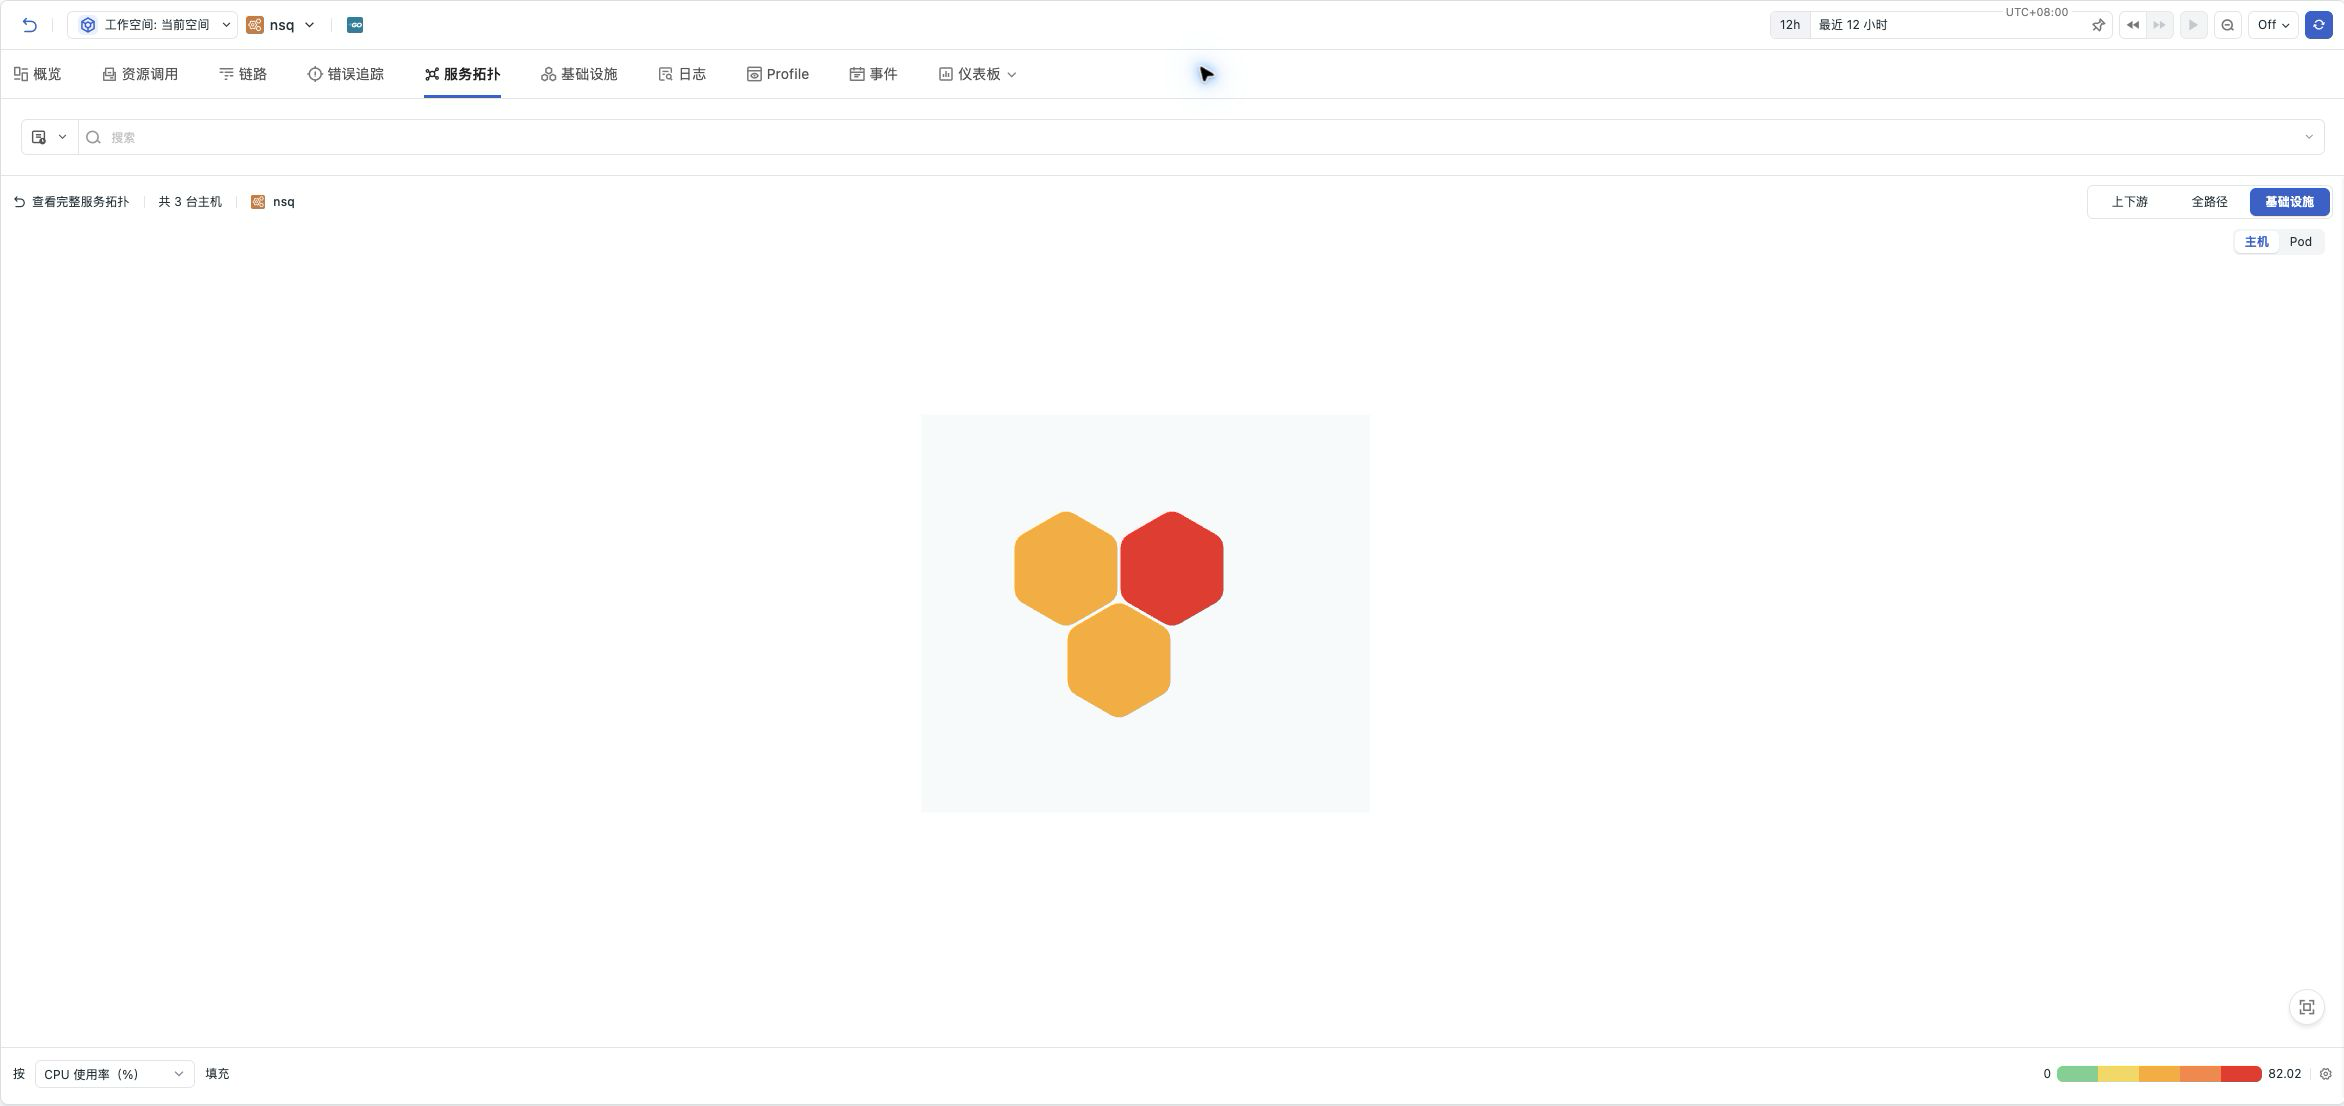
Infrastructure Honeycomb
In the Service Map, switch to "Infrastructure" to select Host or Pod and view resources associated with the current service. Each resource is displayed as an equal-sized honeycomb cell. The current service name is retained in the title bar, does not occupy a honeycomb cell, and no lines are drawn between the service and resources.
- Use "Fill by Metric" to select a metric and color the honeycomb cells by the corresponding metric value;
- Hover over a honeycomb cell to view the resource name and metrics; click to open the details of the corresponding host or Pod;
- Use the scroll wheel to zoom, drag the canvas, and click "Full View" to restore the initial view;
- Infrastructure mode does not provide service topology configurations such as node size, associated highlight range, and grouping. After switching back to the upstream/downstream or full-path view, the corresponding settings entries are restored.
The honeycomb chart only adjusts the display form of resources; associated resources, metric statistics, and query scope follow the original rules. The separate "Infrastructure" tab on the page is still used to view the metrics and lists described below.
Infrastructure
Based on the current service, displays key metric data of associated infrastructure dependencies:
- Host: CPU usage, system load, number of processes, disk I/O time, disk IOPS, etc.;
- Pod: CPU usage, memory usage, traffic, etc.
The corresponding list is displayed below the page. Click an item to expand the slide-out details page to view complete information.
Related Data
The system automatically filters logs, Profile, and event data associated with the current service.
Related Views
Displays the custom views bound to the current service.