Error List
Click "Error Center" in the left navigation bar to view the error list by default. The error list displays all error Issues collected and aggregated through Error Rules. The list is aggregated by issue_id, where each record represents a unique error problem (not a single error occurrence).
Core Capabilities
The error list has the following capabilities:
-
Aggregate errors with the same root cause into a single Issue and count the cumulative occurrences.
-
Each error is marked with a processing status (Triage → Assigned → Working → Resolved → Ignored), facilitating team collaboration and follow-up.
-
The right side of the list displays the recent frequency change curve of the error, helping to identify abnormal fluctuations.
Top Statistics Bar
Displays the number of errors in each status within the current time range:
- All: Includes the total number of all error Issues, useful for tracking overall trends.
- Triage: Awaiting timely claim and assessment.
- Assigned: Assigned to a responsible person, stakeholders can track the progress.
- Working: Focus on the progress of the fix.
- Resolved: Can be reviewed periodically for recurrence.
- Ignored: Temporarily considered not to be errors requiring resolution, can be reviewed periodically for potential misjudgment.
Click on a status card to quickly filter errors under that status.
Special Scenarios for Status Changes
When an error Issue that is already in the "Resolved" state reoccurs with the same error, the system will automatically reset its status from "Resolved" to (Triage) and restart the entire processing workflow (including automatic notification to the responsible person).
If an error is in the (Ignored) state, even if the same error occurs again, it will not be reopened but will remain in the (Ignored) state.
Filtering and Searching
Filter by Error Source
In the left filter panel, you can quickly switch between errors from different data sources:
- All: Display errors from all sources.
- LOG: Display only errors collected by LOG rules.
- APM: Display only errors collected by APM rules.
- RUM: Display only errors collected by RUM rules.
Quick Filters
Use the left quick filters to find target errors based on conditions like application name (app_name), service (service), source (resource), version (version), and environment (env).
Search Bar
Perform full-text search on error entries based on app_name, version, env, service, and error_type.
Filter by Assignee
In the upper right corner of the page, use the assignee dropdown list to quickly filter errors assigned to a specific member.
Error Card Details
Each error Issue is displayed as a card containing the following information:
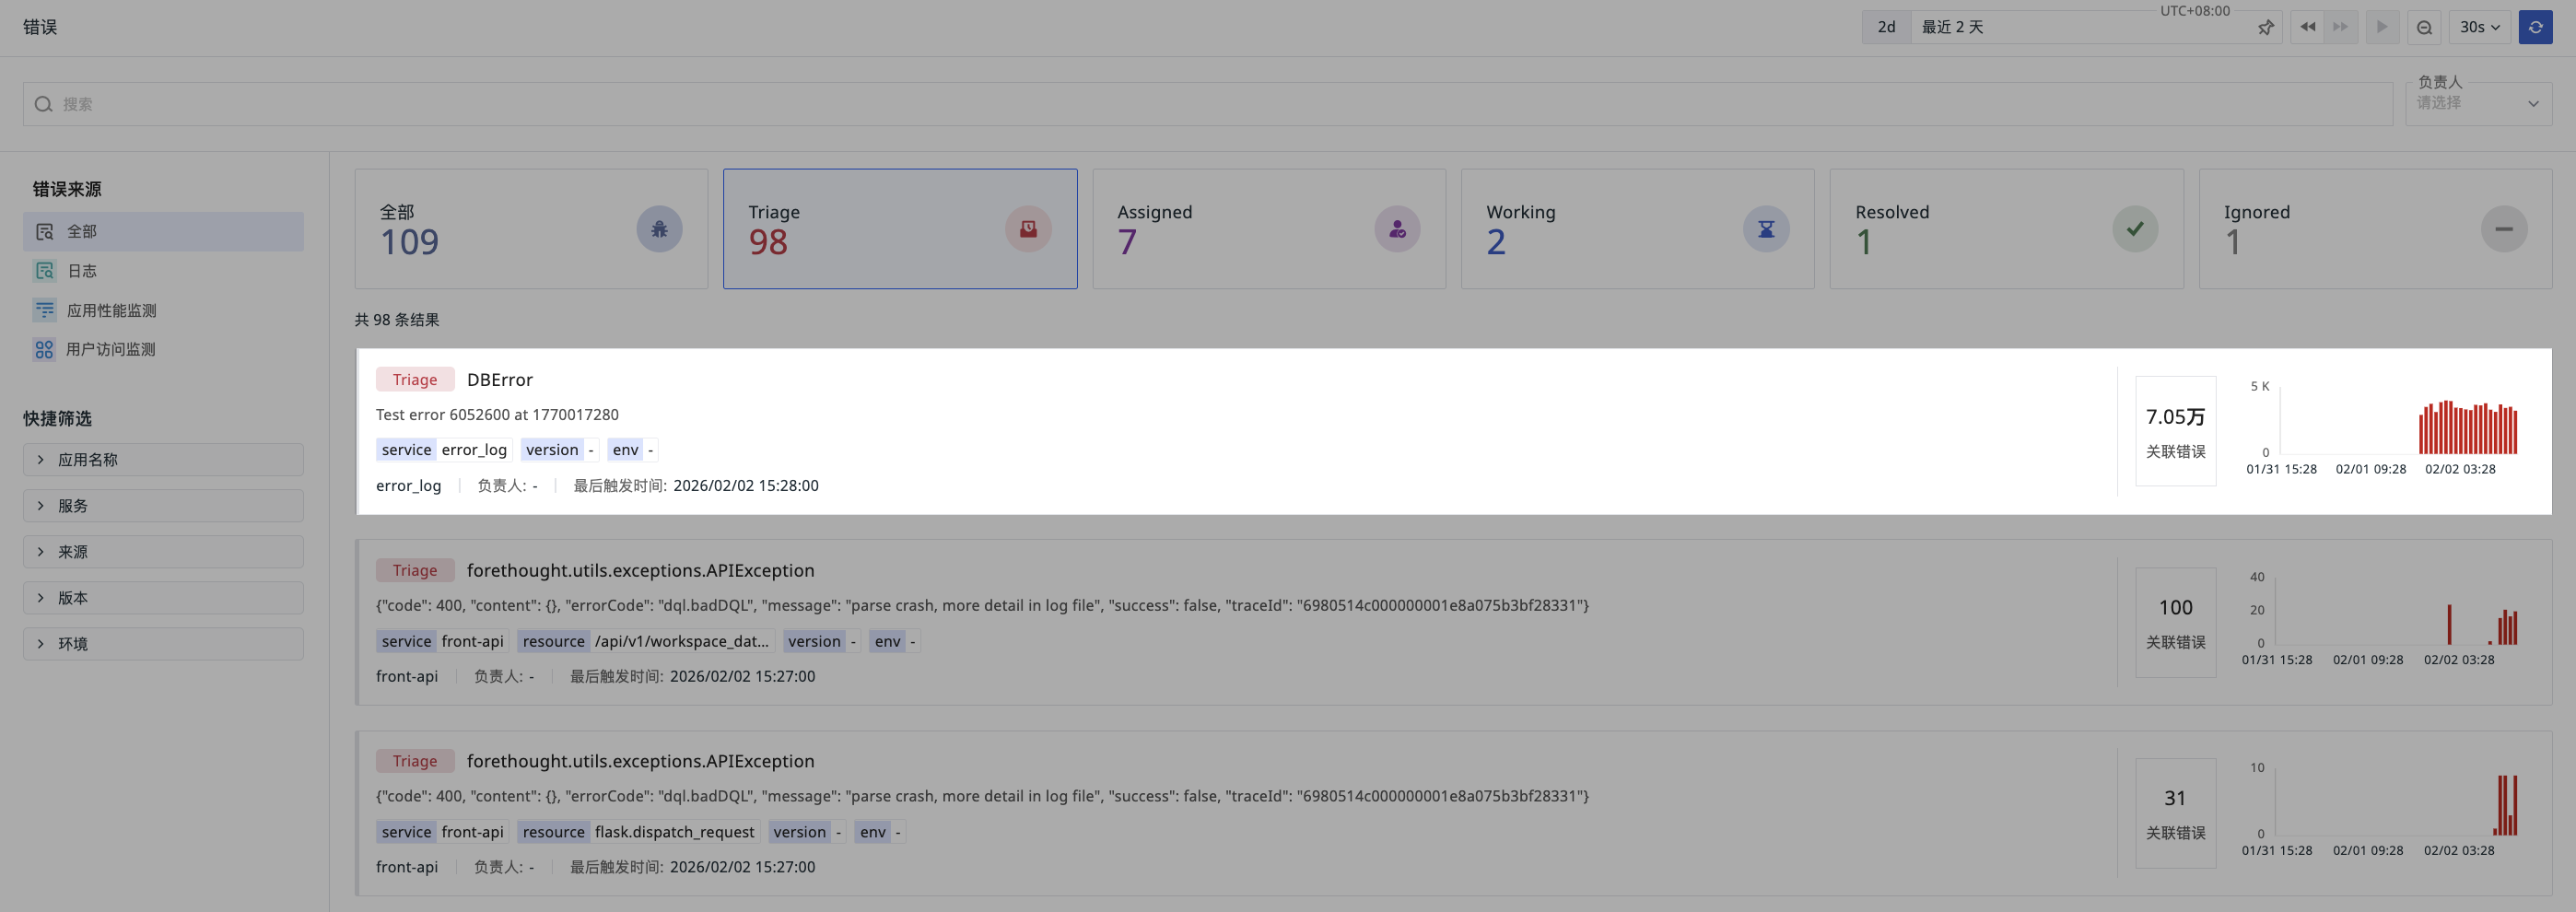
- Error Status.
- Error Title: The
error_typeof the most recent error occurrence. - Error Description: The
error_messageof the most recent error occurrence. - Dimensions: Display dimension information such as service, version, and environment from the most recent error occurrence.
- Bottom Bar: Display the current error's application/service, assignee, and last trigger time.
- Cumulative Count: The cumulative number of times the error has been detected.
- Trend Chart: Display the frequency distribution of error occurrences within the time range, synchronized with the Time Widget.
Further Reading
You might also be interested in: