How to Report Custom Advanced Functions from Local Func
If you want to use configured local functions in Time Series Chart > Advanced Functions, you need to create a Guance Connector, then create a local function script in Local Func. After publishing, the custom advanced functions will be available.
Steps
Step 1: Create a Guance Connector
Step 2: Write the Advanced Function
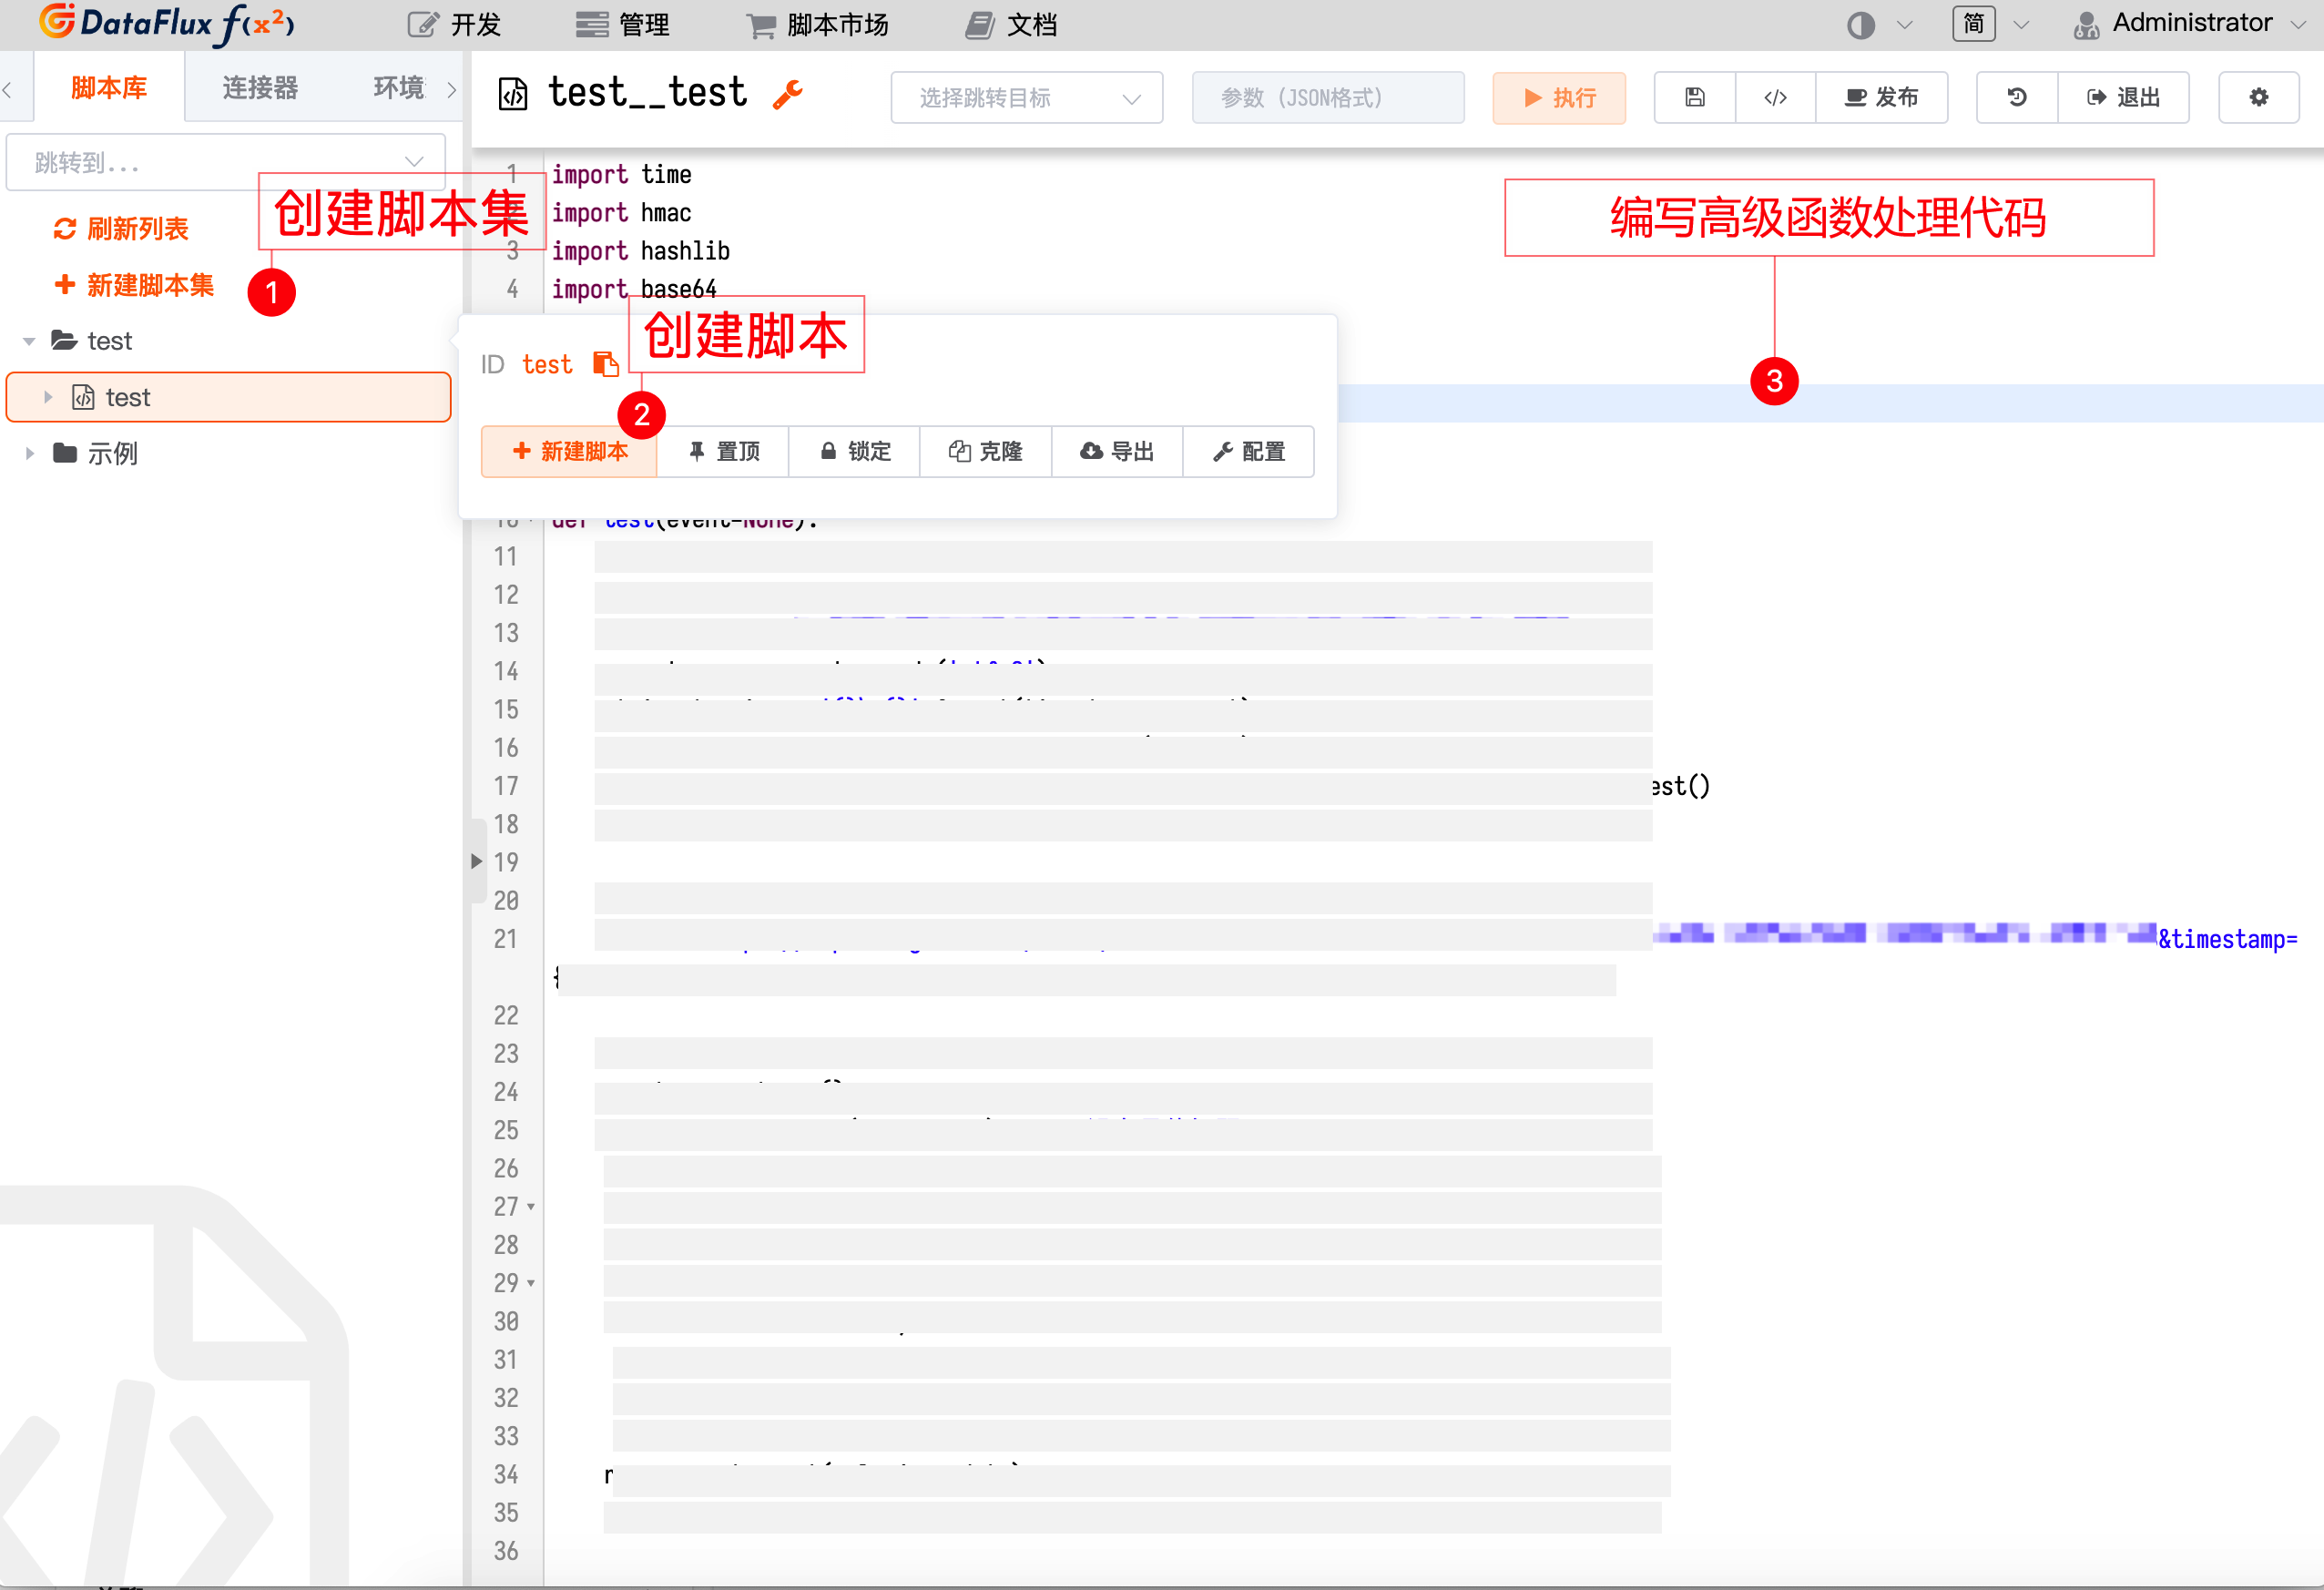
Create a new local function script in Func. Example algorithm:
'''
Advanced function example algorithm

The processing content is as follows:
1. Ingest data into DQL query
2. Return the algorithm-processed result

Note:
    The entry function of the detection algorithm is fixed as `AlgorithmScriptName(data,**kwargs)`
    `data` is the structure of 'series' returned by the DQL query. Example structure:
        [
            {
              'name': 'cpu',
              'tags': {'image': 'nginx'},
              'columns': ['usage_total', 'last'],
              'values': [[1681200000000, 8],[1681202880000, 23],......]
              }
              ...
           ]
    `**kwargs` are optional algorithm parameters

Entry function: DBSCAN(data,eps)
Output example:
    [
        {
            'status'        : "abnormal_series",
                            # Marks whether this time series is normal or an outlier. Outlier status = "abnormal_series", normal status = "normal_series"
            'name'          : 'cpu',
            "tags"          : {'image': 'nginx'},
            'colums'        : ['usage_total', 'last'],
            "values"        : [[1681274880000,8],[1681277760000,20],……],
        },
        ...
    ]
'''
After writing the function, add the category type. The category format is as follows:
Warning
After writing the code, do not forget to publish!
Step 3: Use the Local Function
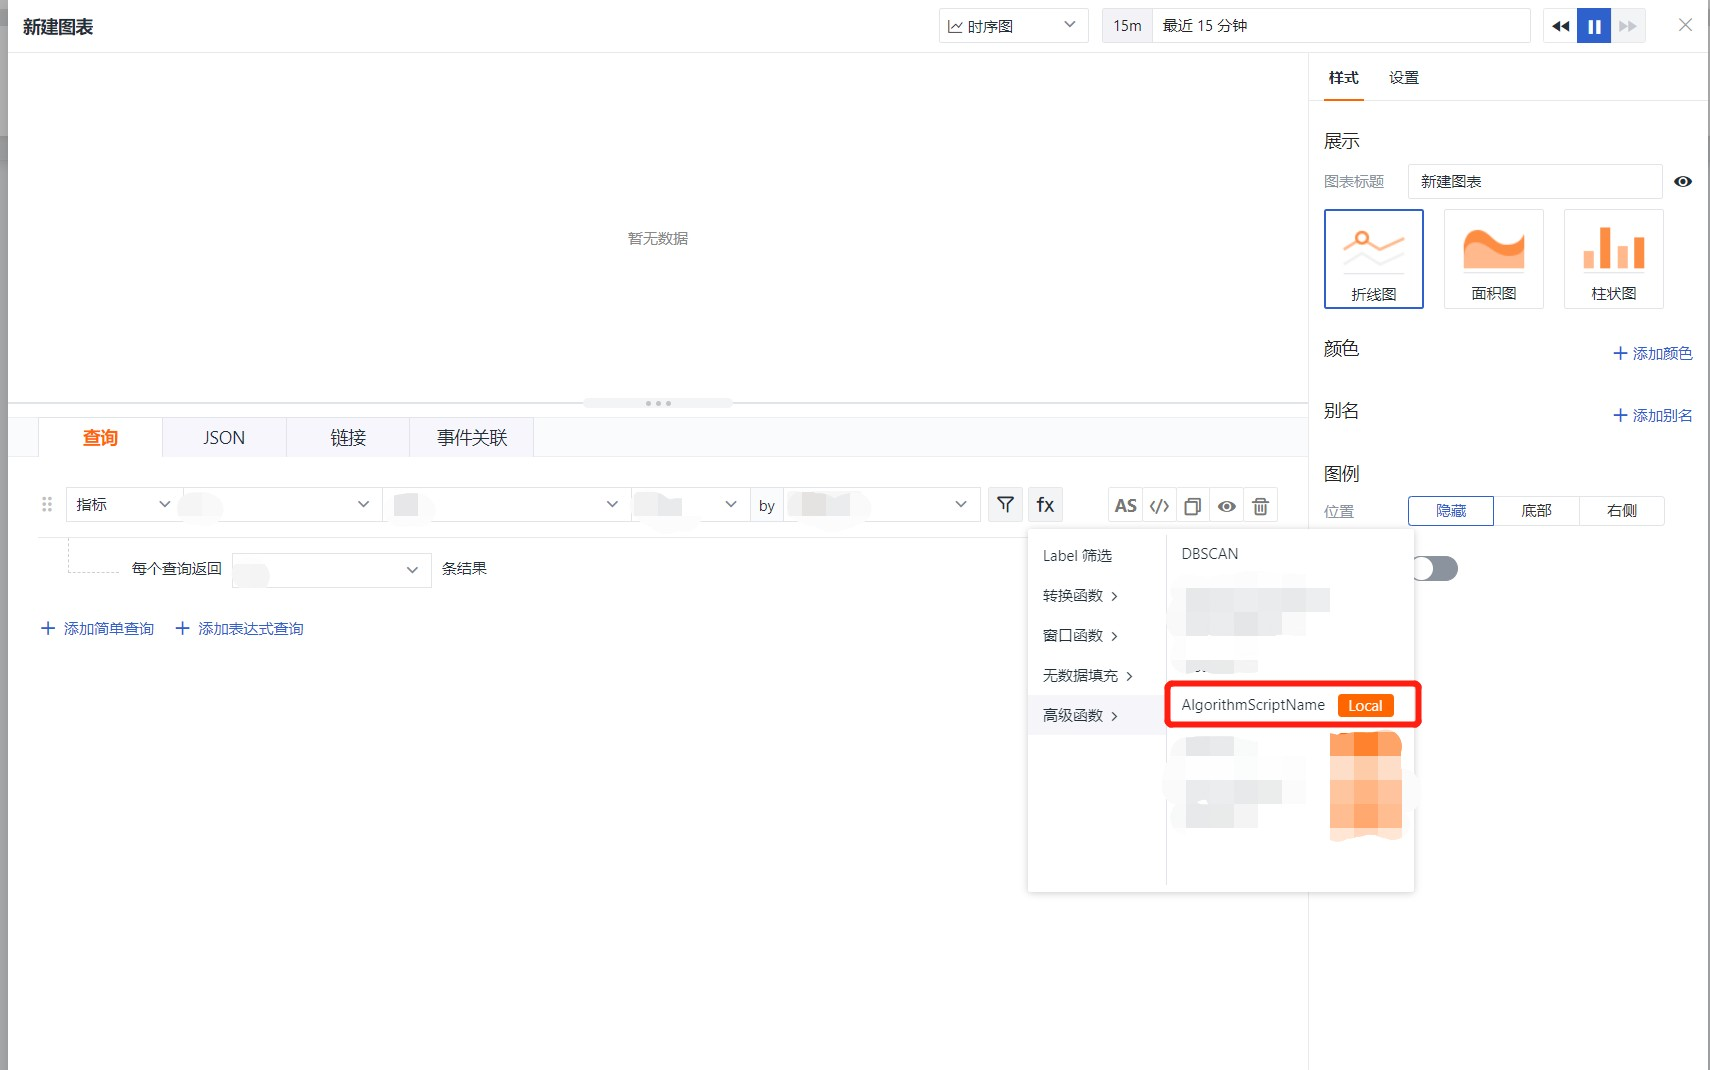
After completing the steps above, the custom advanced function is added to the Guance workspace. In Guance Scenarios, Create Dashboard, add a Time Series Chart, and the local function will be visible under Advanced Functions, as shown:
Step 4: Display Style
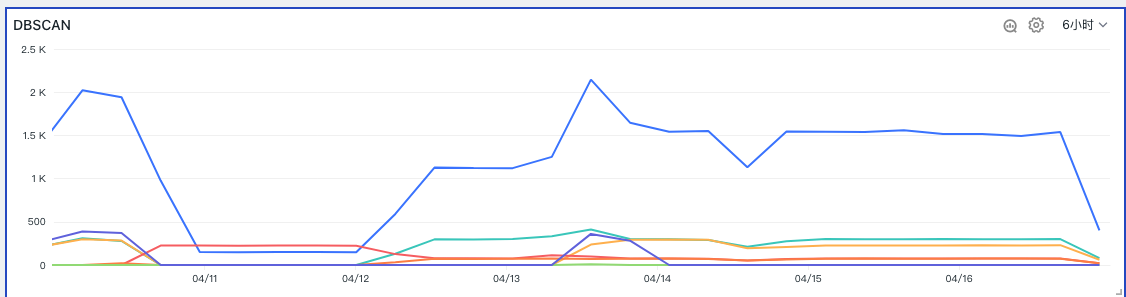
- Effect after configuration with outliers:
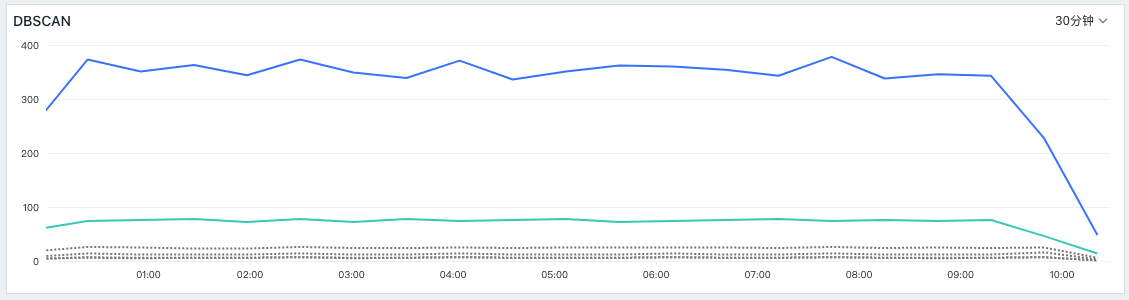
- If there are no outliers, the original data is displayed on the frontend: