Container Types
In the Container Explorer, by integrating technologies such as Kubernetes, and using a real-time dynamically updated visual analysis mode, it comprehensively presents key metric data like health status, runtime, CPU usage rate, etc., for the following container types, thereby efficiently grasping the full picture of container operation.
Data Display
The Container Explorer provides various professional analysis views based on lists and charts.
Displays data of various container objects in the current workspace collected in the last two days, categorized by object type to show specific metric data.
-
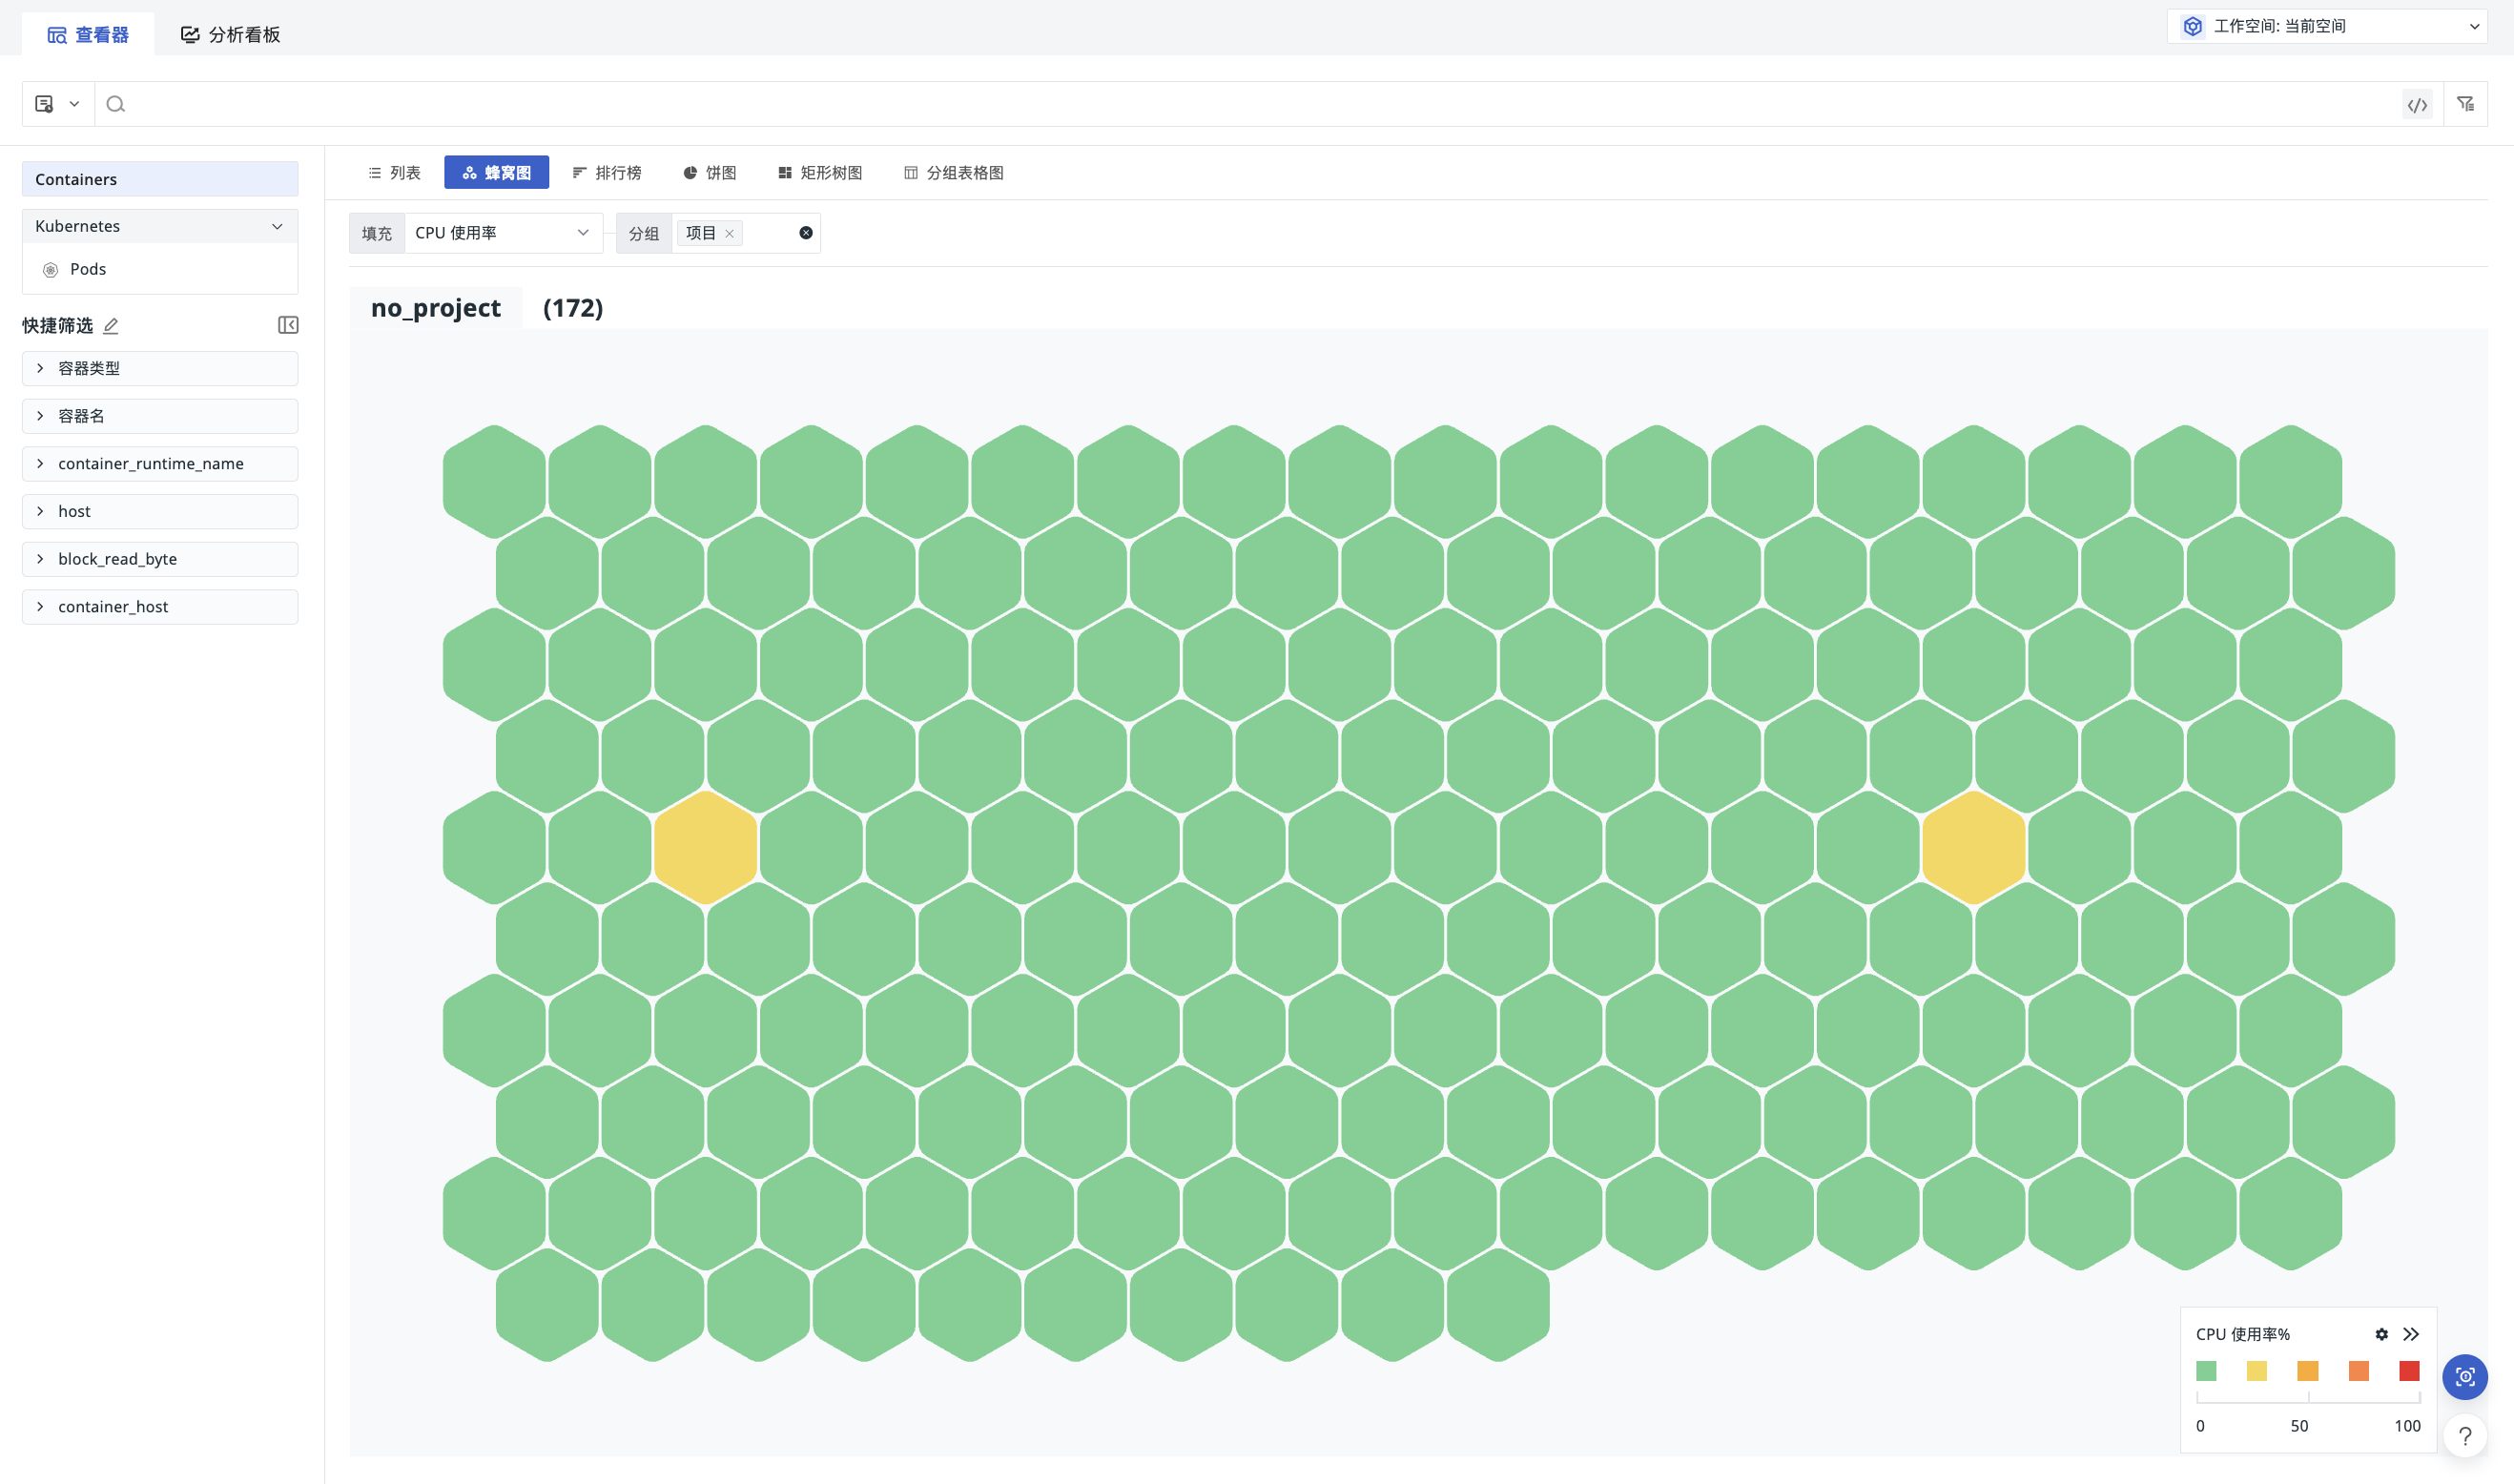
Honeycomb Chart: Switch to the Container Honeycomb Chart to view data for Containers and Kubernetes > Pods in the workspace.
- Containers: Quickly view container CPU usage, MEM usage, CPU usage (normalized), MEM usage (normalized), and analyze the performance status of containers under different projects, services, hosts, and images.
- Pods: Quickly view Pod restart counts, and analyze the performance status of Pods under different projects, services, hosts, Node names, and namespaces.
- Other Charts: Use chart forms like Top Lists, pie charts, treemaps, and grouped table charts, based on operation modes like
count,last,first,count_distinct, to filter data underbyconditions.
Container List
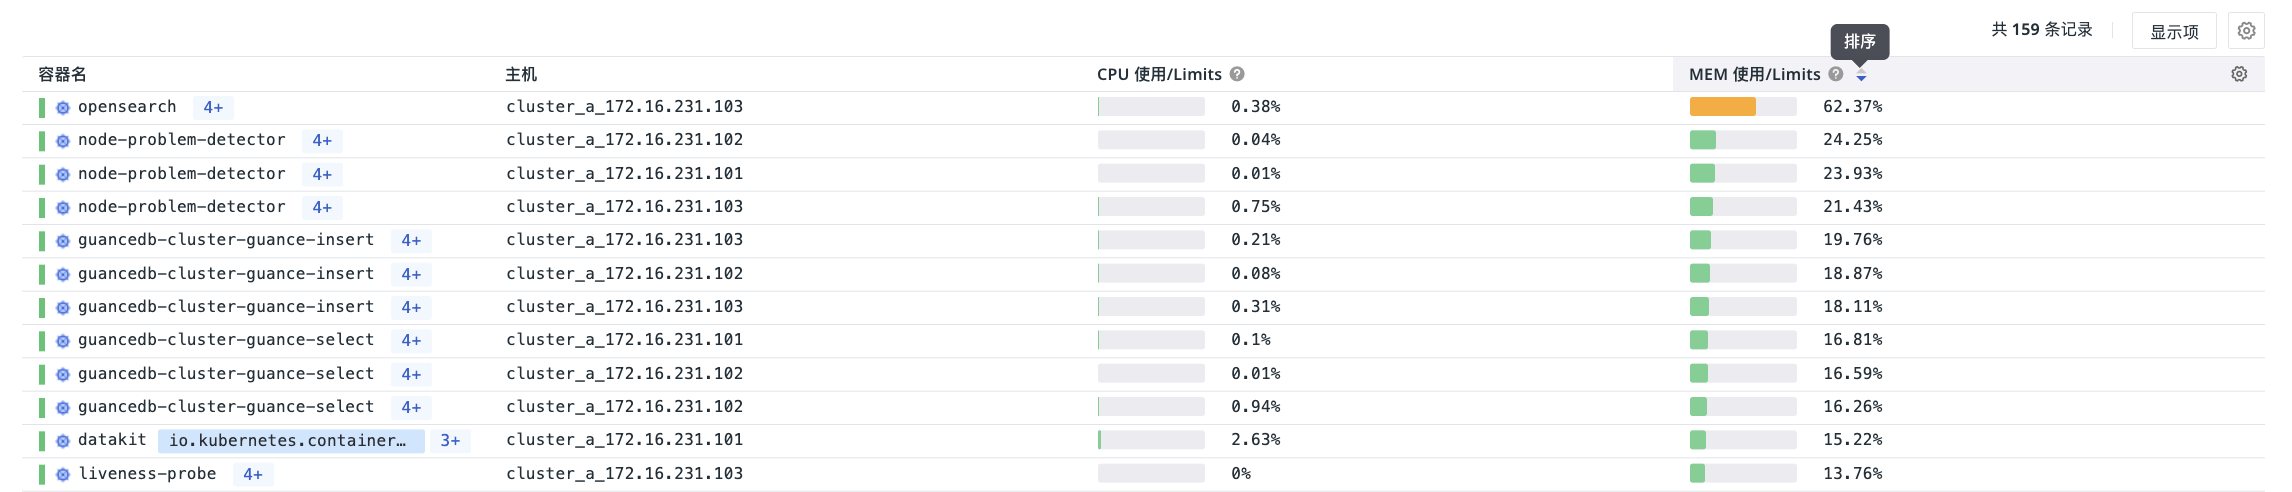
Data Sorting
In the container object list, you can sort based on key metrics such as resource usage rate, CPU usage rate, etc., helping to focus on the highest priority containers and promptly understand their latest status and performance.
Container Details
Click on a container name in the Container Explorer to slide out the corresponding details page.
The details page aggregates and allows viewing of scattered data such as basic attributes, YAML, Pod, metrics, logs, and views for the container, avoiding the need for repeated jumps and queries. Additionally, you can directly locate faults by associating the dependency relationships between containers and hosts/services.
Change Events
Based on data from five object types: Deployments, Daemonsets, Services, Cron Jobs, and Statefulsets, view Change Events on the details page.
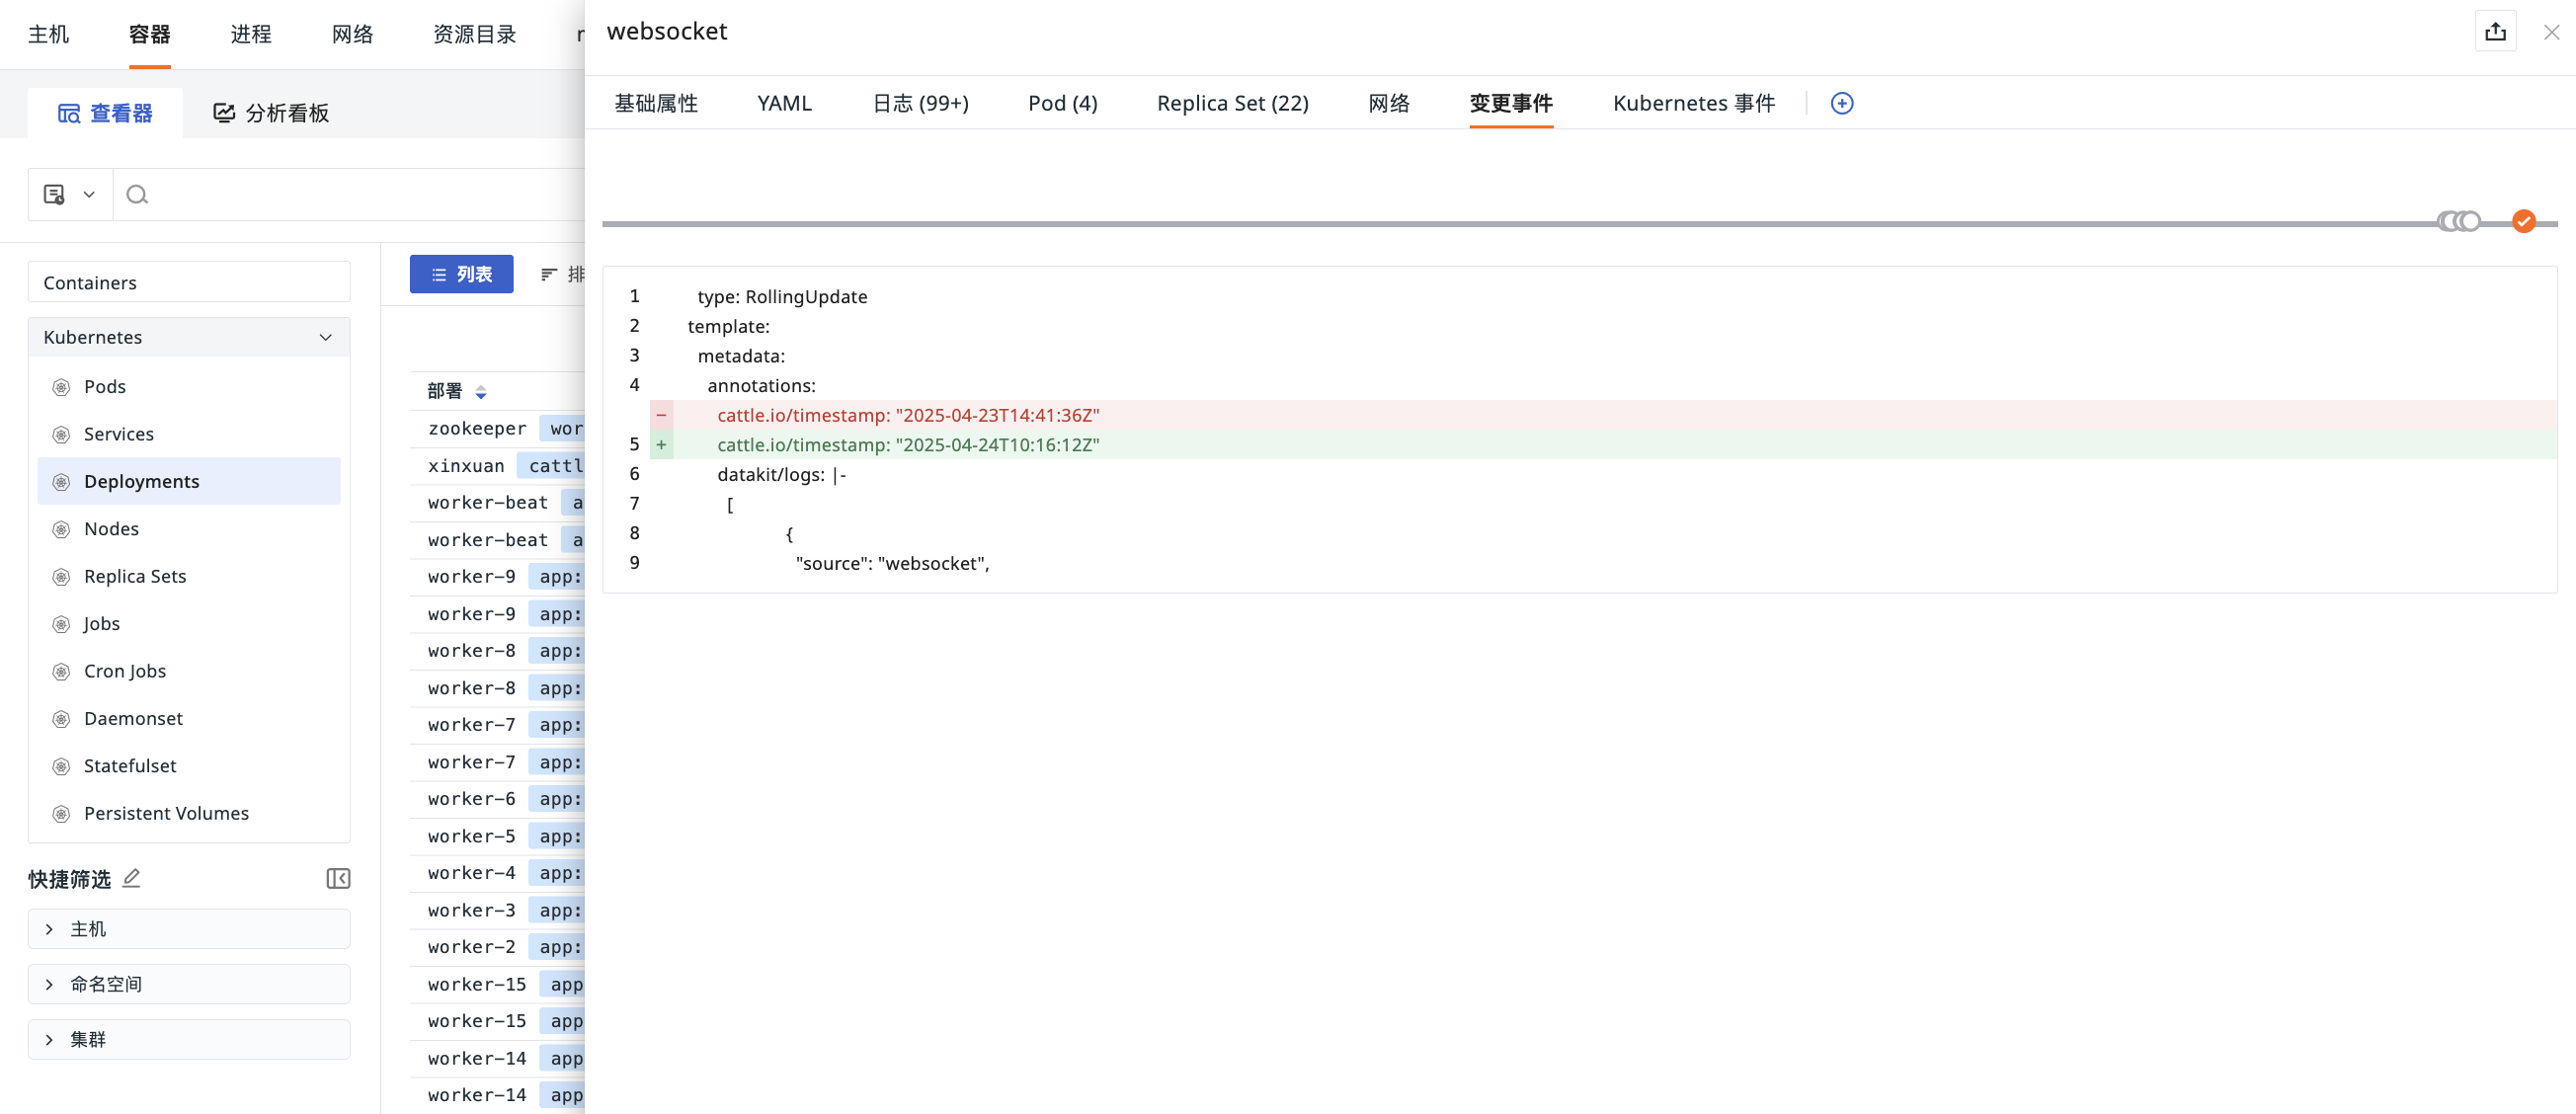
For more details, refer to Change Event Details.
Cross-Workspace Authorization
In addition to the above configurations and functions, if the current workspace has configured Data Authorization and the authorized data types include "Infrastructure", you can switch to the authorized workspace in the upper left corner of the Container Explorer page to view relevant container data.