Log List
Global Configuration
Note
This feature entry is only visible to members with administrative privileges.
On the Global Configuration page, you can centrally manage the following three core features at the workspace level:
- Quick Filter Configuration: Customize the universal quick filter panel within the Explorer;
- Top Field Configuration: Configure the fields displayed at the top of each log in stack mode. Indexes without individual configurations will use the global default settings;
- Index Key Field Configuration: Define the default priority display fields for each index in the data list;
- Query Acceleration Configuration: Enable acceleration for fields under an index to significantly improve query performance.
Quick Filter
The quick filter items configured here will be applied to the quick filter panel on the left side of all Explorers within the workspace and will be visible to all members.
All filter fields added here will automatically have Query Acceleration enabled for their respective indexes to ensure filtering performance. This association is a mandatory default behavior and cannot be disabled.
You can configure two types of fields:
-
Filter Fields (currently active fields)
- You can edit or delete individual fields;
- Delete all filter fields with one click.
-
Optional Fields (including business fields, system fields, others)
- Add as filter fields
If there are many fields, you can search for fields directly. If the query results do not have an exact matching value, you can directly create and add it to the "Filter Fields".
Empty value (no data) entries in the quick filter are not displayed by default. You can enable this here. After enabling, a "No Data" option will appear at the bottom of each filter group, supporting filtering of data where the field value is empty. This configuration can only be operated by administrators and custom roles with "Global Configuration" permissions.
Global Quick Filter
Workspace administrators can uniformly configure global filter items in Manage > Quick Filter. After saving the configuration, all members can refresh or re-enter the Log Explorer to synchronize the latest global filter items.
Global filter items and personal custom filter items are saved independently and do not overwrite each other:
- Administrators adding, editing, adjusting the order, or disabling global filter items will not affect members' existing personal filter items;
- In the quick filter bar, global filter items are displayed by default before personal filter items;
- If a global filter item has the same name as a personal filter item, both will be displayed simultaneously, and they can be distinguished by the field identifier.
When the global configuration changes, after you refresh the page, the system will prompt "Quick filter has been automatically updated following the global configuration". This prompt appears only once per Explorer, per version.
Top Field Configuration
Configure the fields displayed at the top of each log in Stack Mode. Indexes without individual configurations will use the global default settings.
Global Default Top Fields
When an index does not have dedicated top fields configured, the global default fields will be used. Click "Edit" to adjust the globally default displayed fields.
Default included fields: source, host, service, pod_name, container_name, duration.
Index Top Field Configuration
Configure dedicated top fields for a specific index. This takes precedence over the global default configuration.
- Click "+ Add Index Configuration", select an index and configure its top fields (up to 8 can be selected);
- For top fields, you can select existing fields or manually enter field names. Press Enter to add custom fields;
- After saving, logs under this index will display the configured top fields in stack mode.
Added index configurations support editing and deletion operations.
Index Key Fields
Configure a set of "Key Fields" for different data indexes. After configuration, when viewing the data list corresponding to this index, the system will prioritize displaying these fields in this order, helping to quickly focus on core information.
- Left side: Index list;
- Right side: Select the optional fields under each index listed by the system as key fields.
For the current key field configuration, you can choose whether to synchronize all key fields to query acceleration.
Note
This configuration sets the default display template for the data list, optimizing the initial viewing experience. Members can still customize the list fields by adding or removing them via the "Display Items" function within the Explorer, which is not limited by this default configuration.
Query Acceleration Configuration
Enabling acceleration for fields that are frequently used for filtering, grouping, or sorting under an index can greatly improve the query response speed for these fields. This configuration is performed at the index level.
- Left side: Index list;
- Right side: Select the optional fields under each index listed by the system for acceleration. You can later view them in the "Accelerated Fields" list above.
After configuration changes, it takes approximately 5 minutes to take effect across the entire system. Once effective, fields will automatically be added to the "Accelerated Fields" list.
Accelerated Fields That Cannot Be Disabled
The following three types of fields will automatically appear in the "Accelerated Fields" list and are not allowed to have acceleration disabled:
- Official Default Accelerated Fields: System-preset key fields;
- Quick Filter Fields: Fields from the quick filter configuration;
- Synchronized Key Fields: When the synchronization switch in the key field configuration is turned on, all key fields will automatically have acceleration enabled.
Enabling acceleration for fields that are frequently used for filtering, grouping, or sorting under an index can greatly improve the query response speed for these fields. This configuration is performed at the index level.
Go to Log Explorer > Display Columns > Query Acceleration Configuration. The left side shows the index list, and the right side displays the accelerated fields list for the current index.
Add Acceleration Fields
Click "+ Add Acceleration Field". An addition row will appear above the accelerated fields list:
- Select a field via the dropdown, which supports fuzzy search; or directly enter the field name;
- Click "Add" to add the field to the accelerated fields list below;
- Click "Cancel" to exit the addition state without adding a field.
Delete Acceleration Fields
- Single deletion: Click "Delete" for the corresponding field in the accelerated fields list;
- Batch deletion: Click "Delete All Acceleration Fields" to clear all acceleration fields for the current index.
Accelerated Fields That Cannot Be Deleted
The following three types of fields will automatically appear in the "Accelerated Fields" list and are not allowed to be deleted:
- Official Default Accelerated Fields: System-preset key fields;
- Quick Filter Fields: Fields from the quick filter configuration;
- Synchronized Key Fields: When the synchronization switch in the key field configuration is turned on, all key fields will automatically have acceleration enabled.
Note
- Query acceleration is only supported for fields of string type;
- Each index supports a maximum of 200 query acceleration fields. When the limit is reached, the system will prevent further additions and prompt: The query acceleration field limit has been reached. Each index supports a maximum of 200 fields.
After configuration changes, it takes approximately 5 minutes to take effect across the entire system. Once effective, fields will automatically be added to the "Accelerated Fields" list.
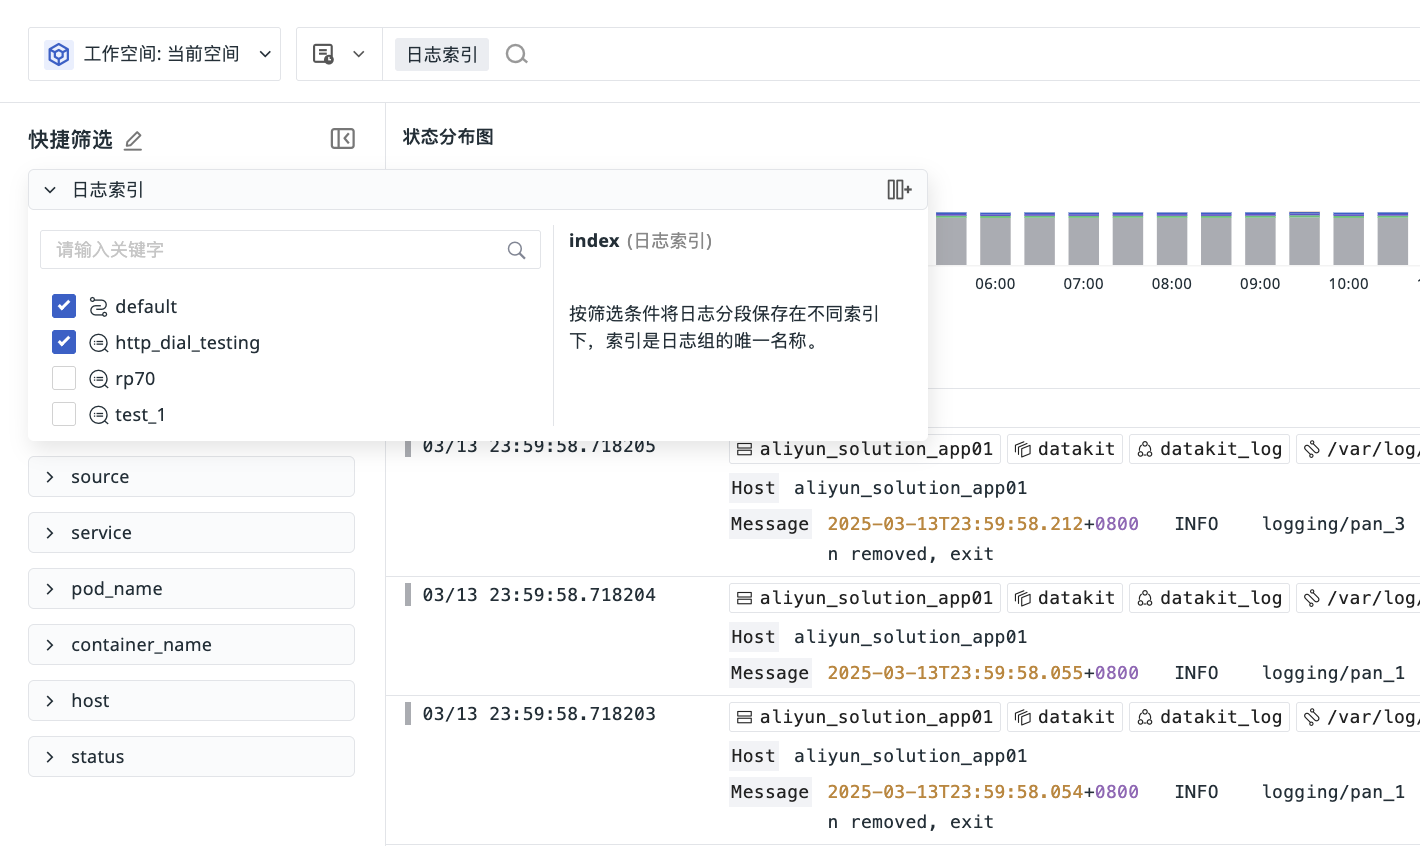
Index
By setting up Log Multi-Index, logs meeting specific conditions are stored in different indexes, and an appropriate data storage strategy is selected for each index, thereby effectively saving log data storage costs.
The index list uses a scrolling load mechanism. The first 50 indexes are displayed by default, and the next 50 are automatically loaded when scrolling to the bottom. This loading method also applies to fuzzy search result lists, facilitating continuous browsing.
You can perform the following operations:
- Select all indexes (❗️May cause slower queries due to large data volume);
- Select multiple indexes;
- Pin indexes to the top;
- Search and locate by index name;
- Set the index display area as small, medium, or large.
After configuration, you can switch between different indexes in the Explorer to view the corresponding log content.
Quick Filter
For more details, refer to Filter.
Display Items
On the Display Items page, two parts of fields are displayed overall:
- Display Fields: Fields displayed in the quick filter;
- Optional Fields: All fields cached for the current data type.
You can perform the following operations:
- Search for fields; if the query results do not have an exact matching value, you can directly create and add it to the "Filter Fields";
- Edit field aliases;
- Drag to adjust field order;
- Delete (all) fields;
- Reset to default fields;
- Set whether to display field aliases and the time column.
Reset to Default Fields
When performing the "Reset to Default Fields" operation, the system displays fields according to the following rules:
- If you have not configured key fields: After resetting, only the
timeandmessagefields are displayed (❗️Whether the time column is displayed is also controlled by another independent "Show Time Column" switch); - If you have configured key fields: After resetting, the display will exactly follow your custom field list, and the
messagefield will not be automatically added; - The
messagefield can be manually removed when displayed.
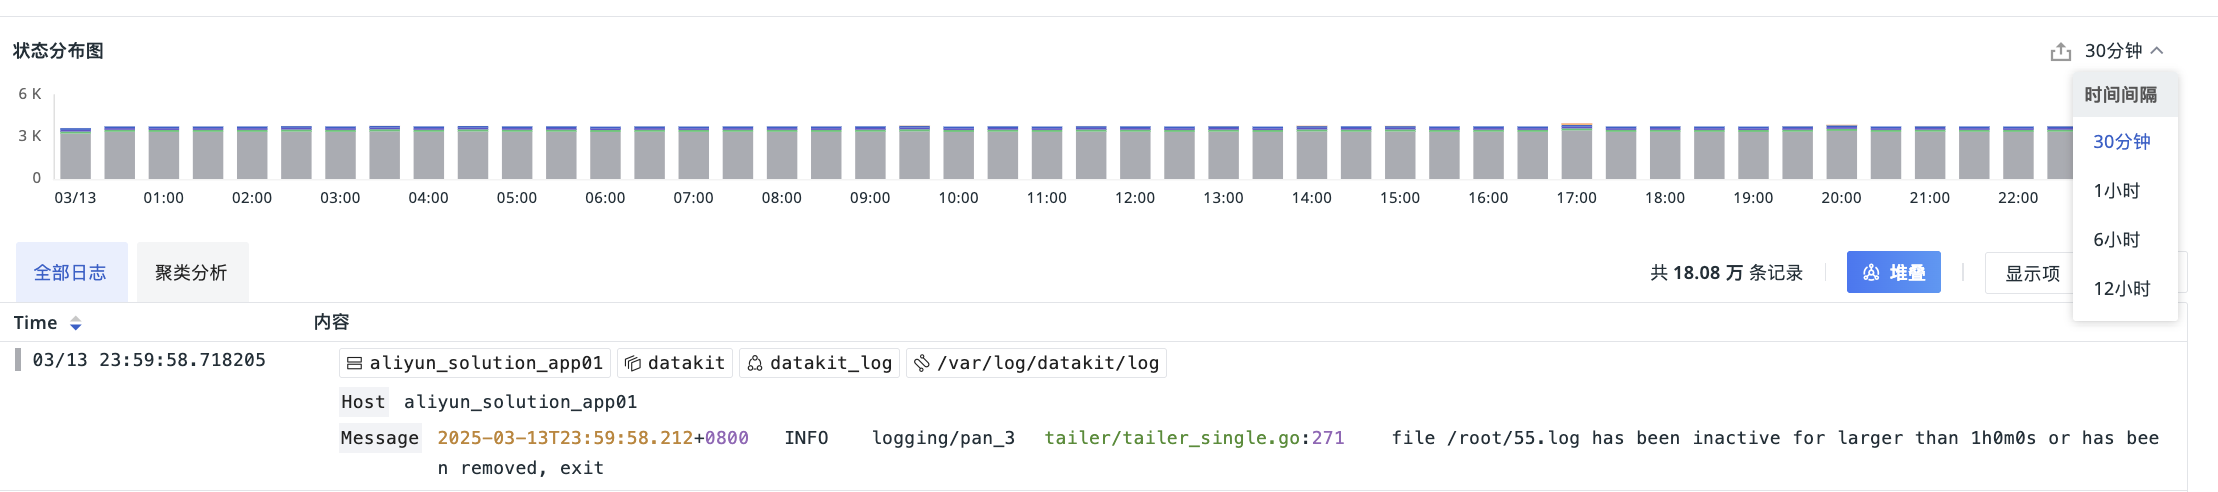
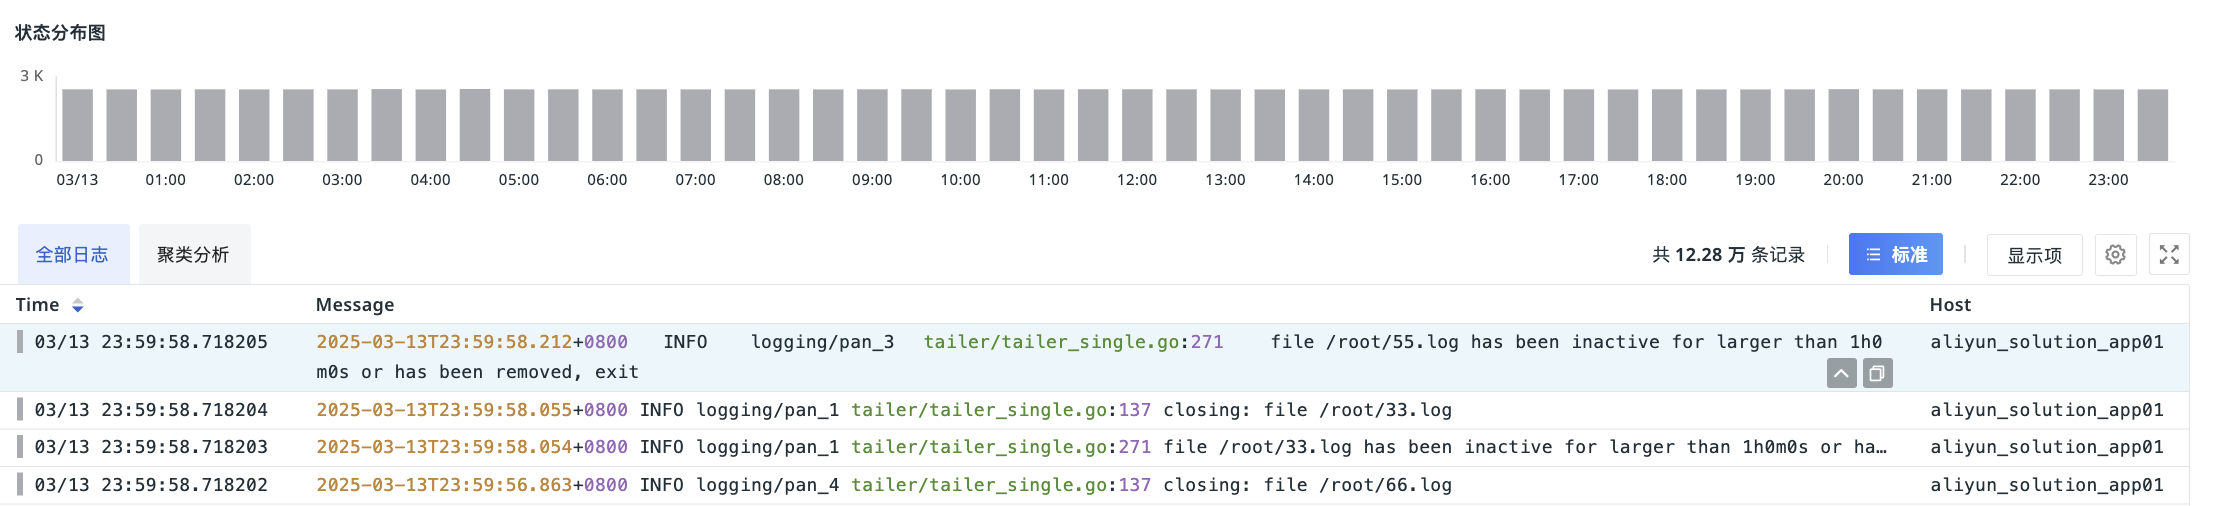
Status Distribution Chart
Based on the selected time range, the system automatically divides multiple time points and displays the quantity of different log statuses in a stacked bar chart, aiding efficient statistical analysis.
When filtering logs, the bar chart will update in real-time to show the filtered results.
- You can hover and export the chart, ultimately exporting to a dashboard, notebook, or copying to clipboard;
- You can customize the time interval.
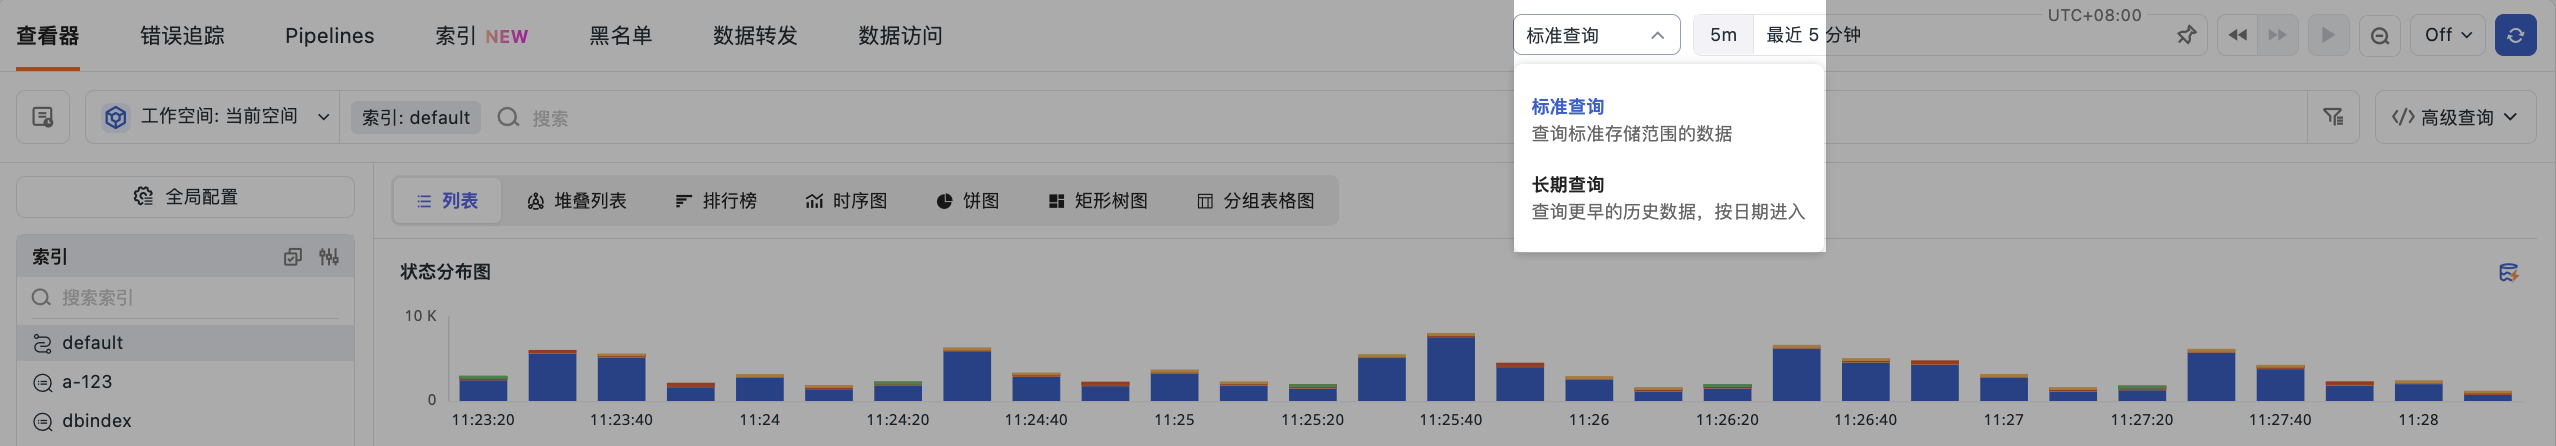
Query Mode
After the workspace enables Log Long-term Storage, a Standard Query and Long-term Query switch entry will appear in the upper right corner. This entry is used to switch queries between data at different storage levels. The specific usage depends on your data storage strategy configuration.
| Query Mode | Data Source | Use Cases | Query Limitations |
|---|---|---|---|
| Standard Query | Logs within the standard storage range | High-frequency analysis, real-time monitoring, retrieval across any time range | None |
| Long-term Query | Logs within the long-term storage range | Historical log backtracking, low-frequency auditing | Single query time range up to 24 hours maximum, status distribution chart not displayed |
If the workspace has not enabled log long-term storage, the Explorer does not display this switch entry.
Click to view More Explanation on Log Query Mode.
Usage Instructions
-
By default, entering the Explorer is in Standard Query mode, supporting queries across any time range and real-time response.
-
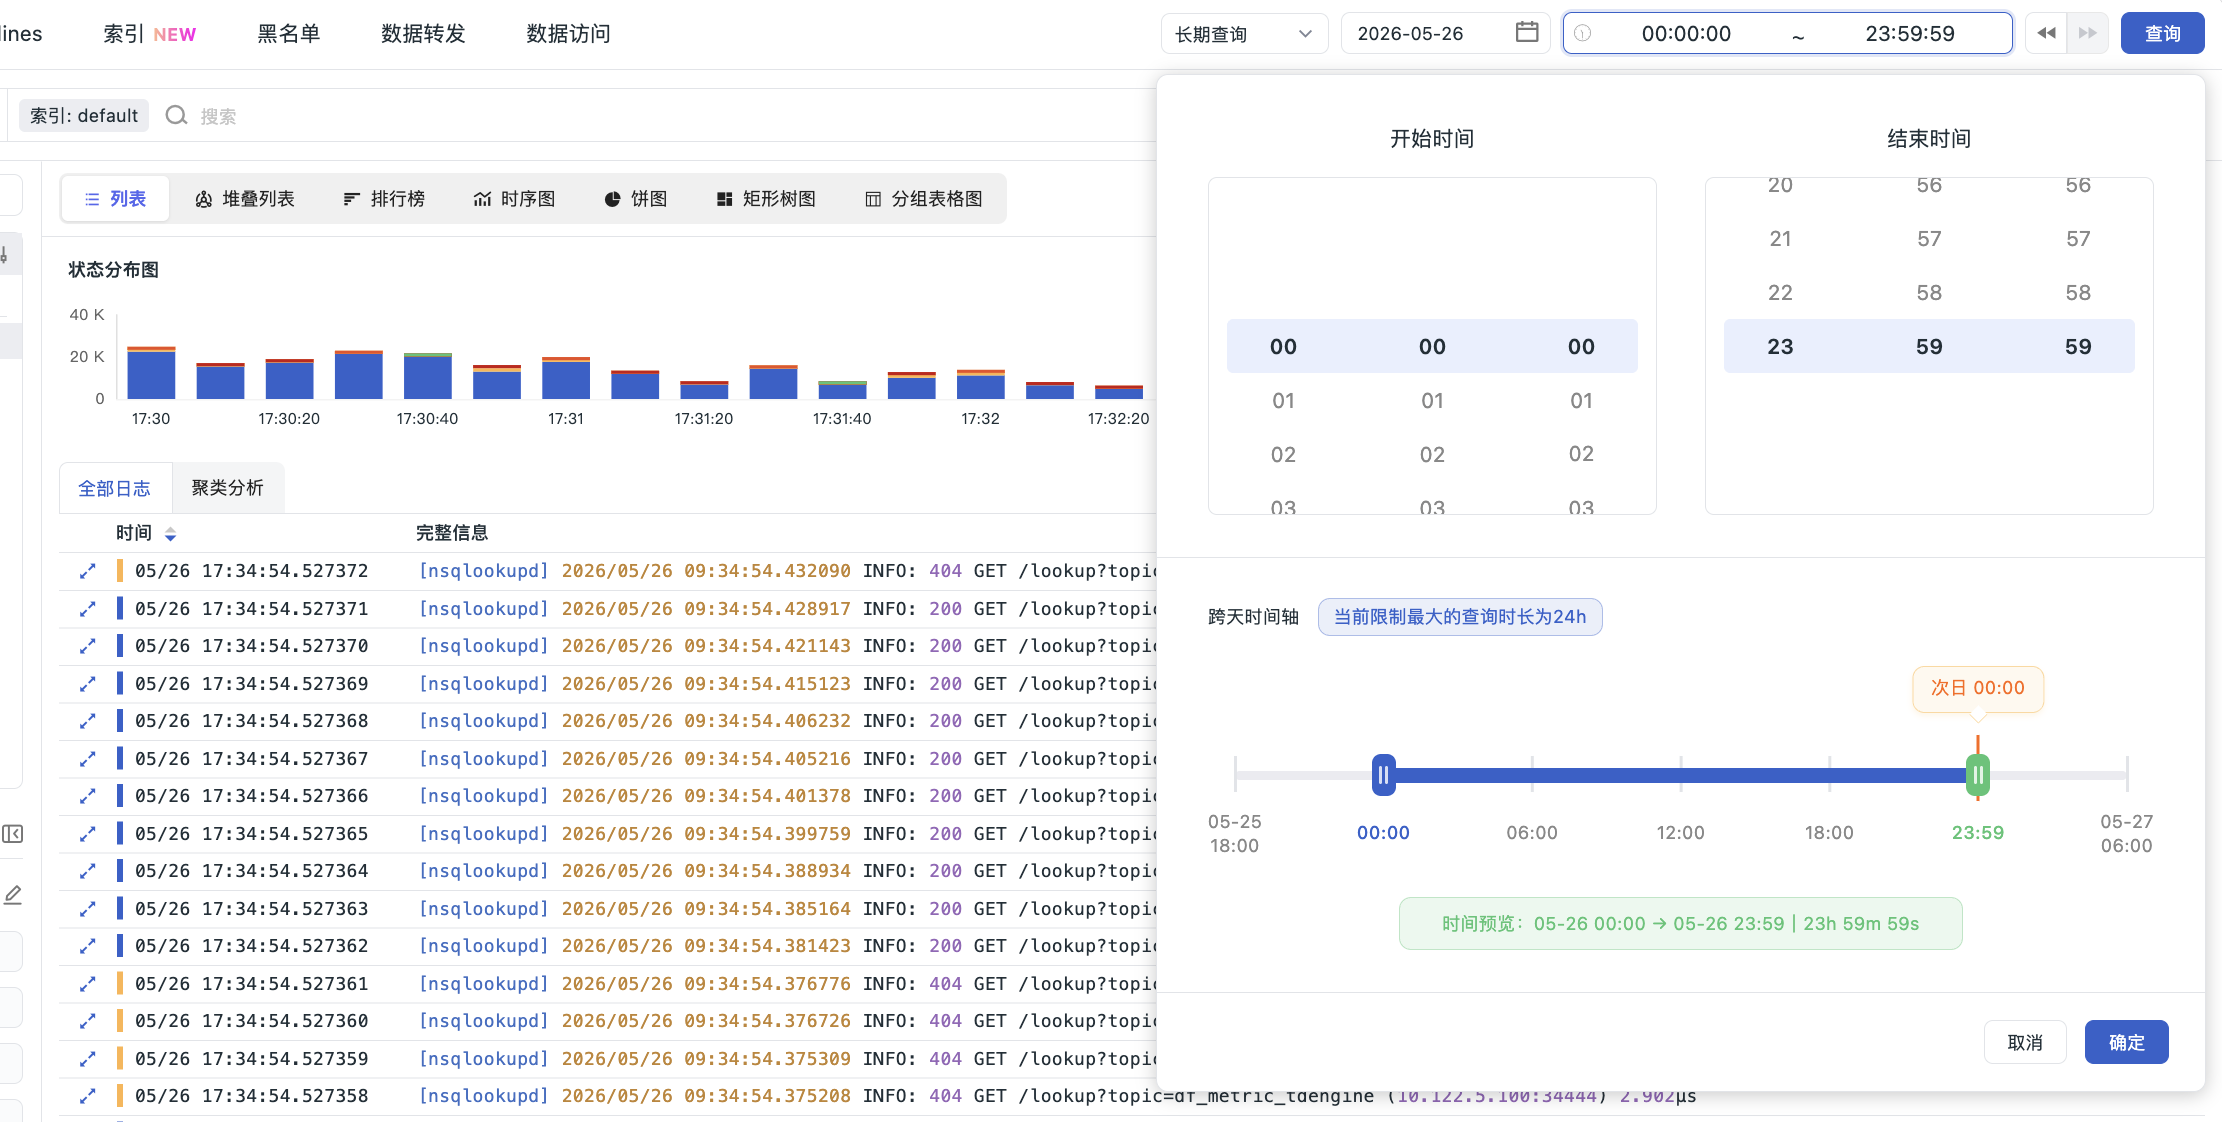
After switching to Long-term Query, click the time input box to open the time selection panel:
-
Select Date: Choose the start date on the left;
- Set Start and End Time: Select the start time and end time respectively in the right scroll wheel. If the end time is earlier than the start time, the system automatically recognizes it as the next day, and the input box will display as
2026-05-19 23:00:00 ~ Next Day 05:00:00; -
You can also directly drag the blue interval on the time axis to move it as a whole, or drag the left and right endpoints to fine-tune the start and end times. Dragging allows crossing midnight of the same day, and the cross-day boundary is marked with "Next Day 00:00".
-
The currently selected query interval and total duration are displayed in real-time below the time axis. After confirmation, click "Query" to trigger the search.
Search Bar
In the Log Explorer search bar, multiple search and filter methods are supported.
After entering search or filter conditions, you can preview the effect and copy the condition to apply to charts or query tools.
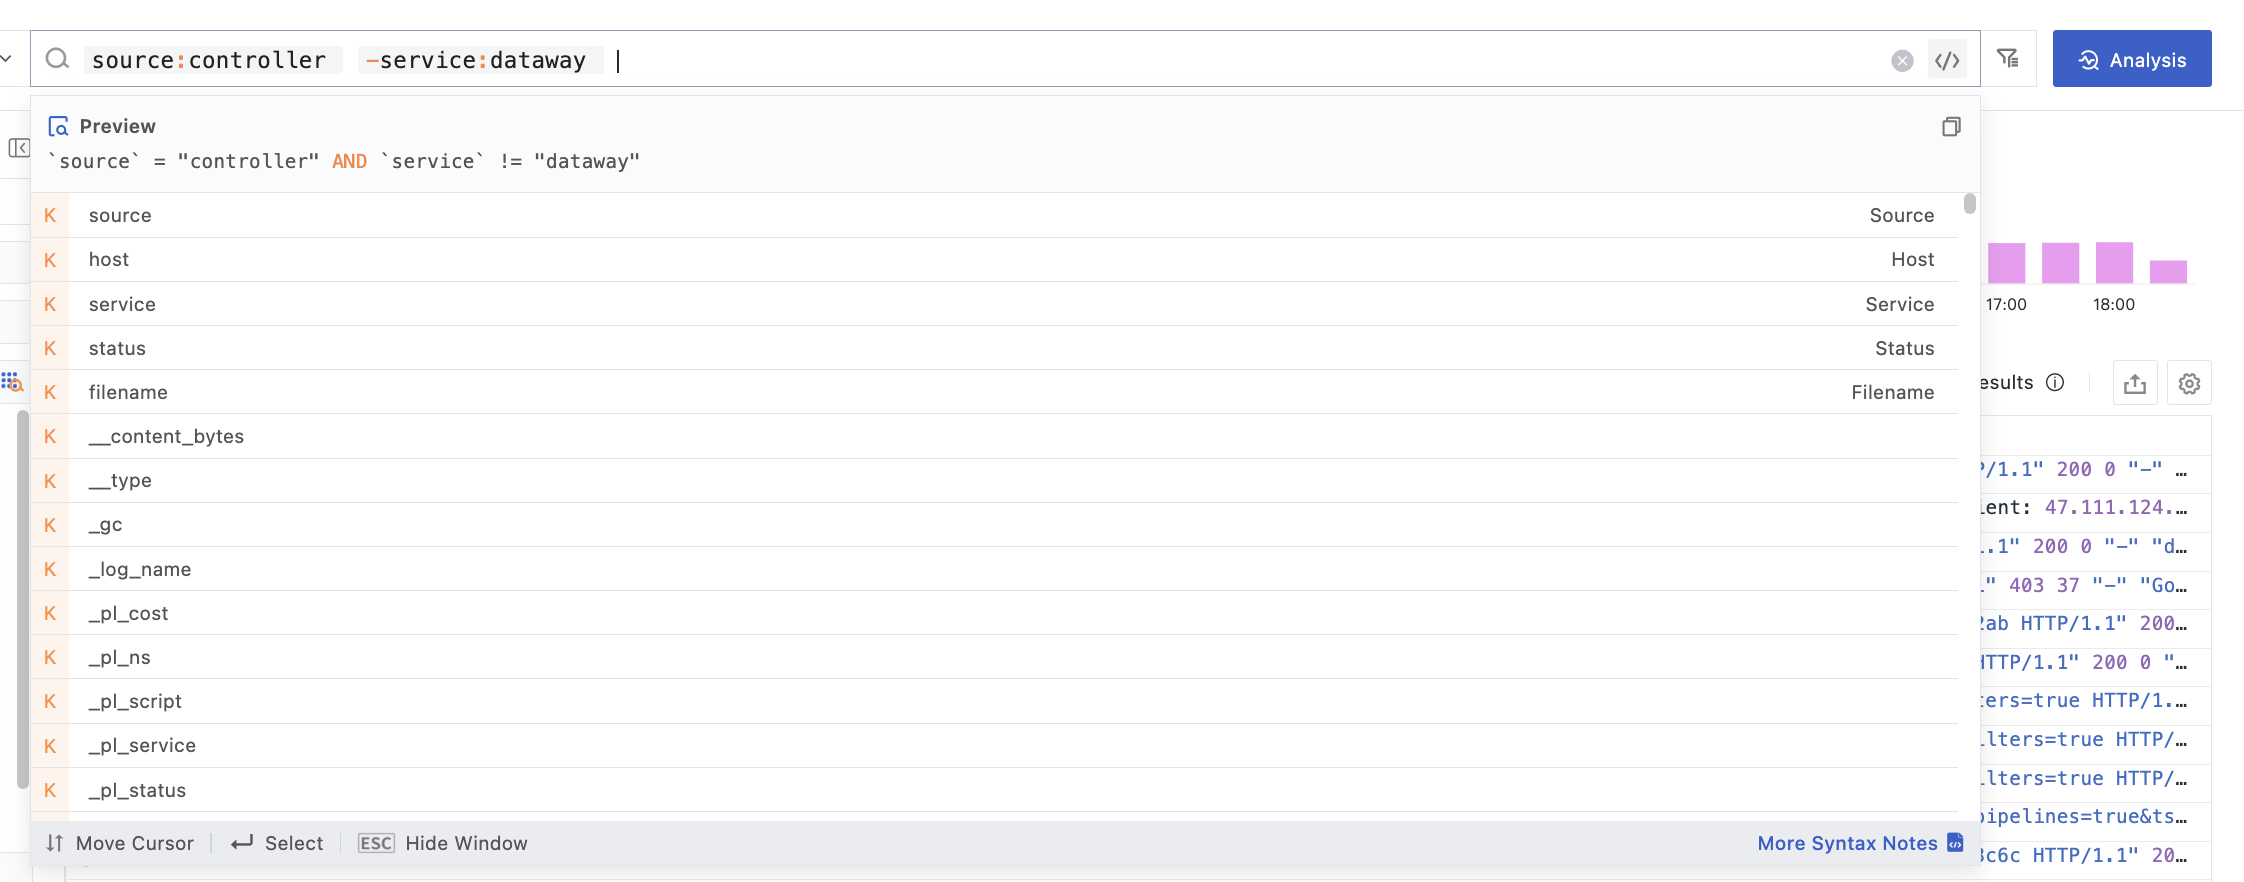
Manual Configuration
Click the toggle button on the right side of the search box to enter the manual input query mode.
JSON Field Return
Note
This feature is only available for user roles with DQL query permissions.
DQL queries support extracting nested values from JSON fields in log data. You just need to add a field path with the @ symbol in the DQL query statement. The system will automatically recognize this configuration and display the extracted value as an independent field in the query results. For example:
- Normal query:
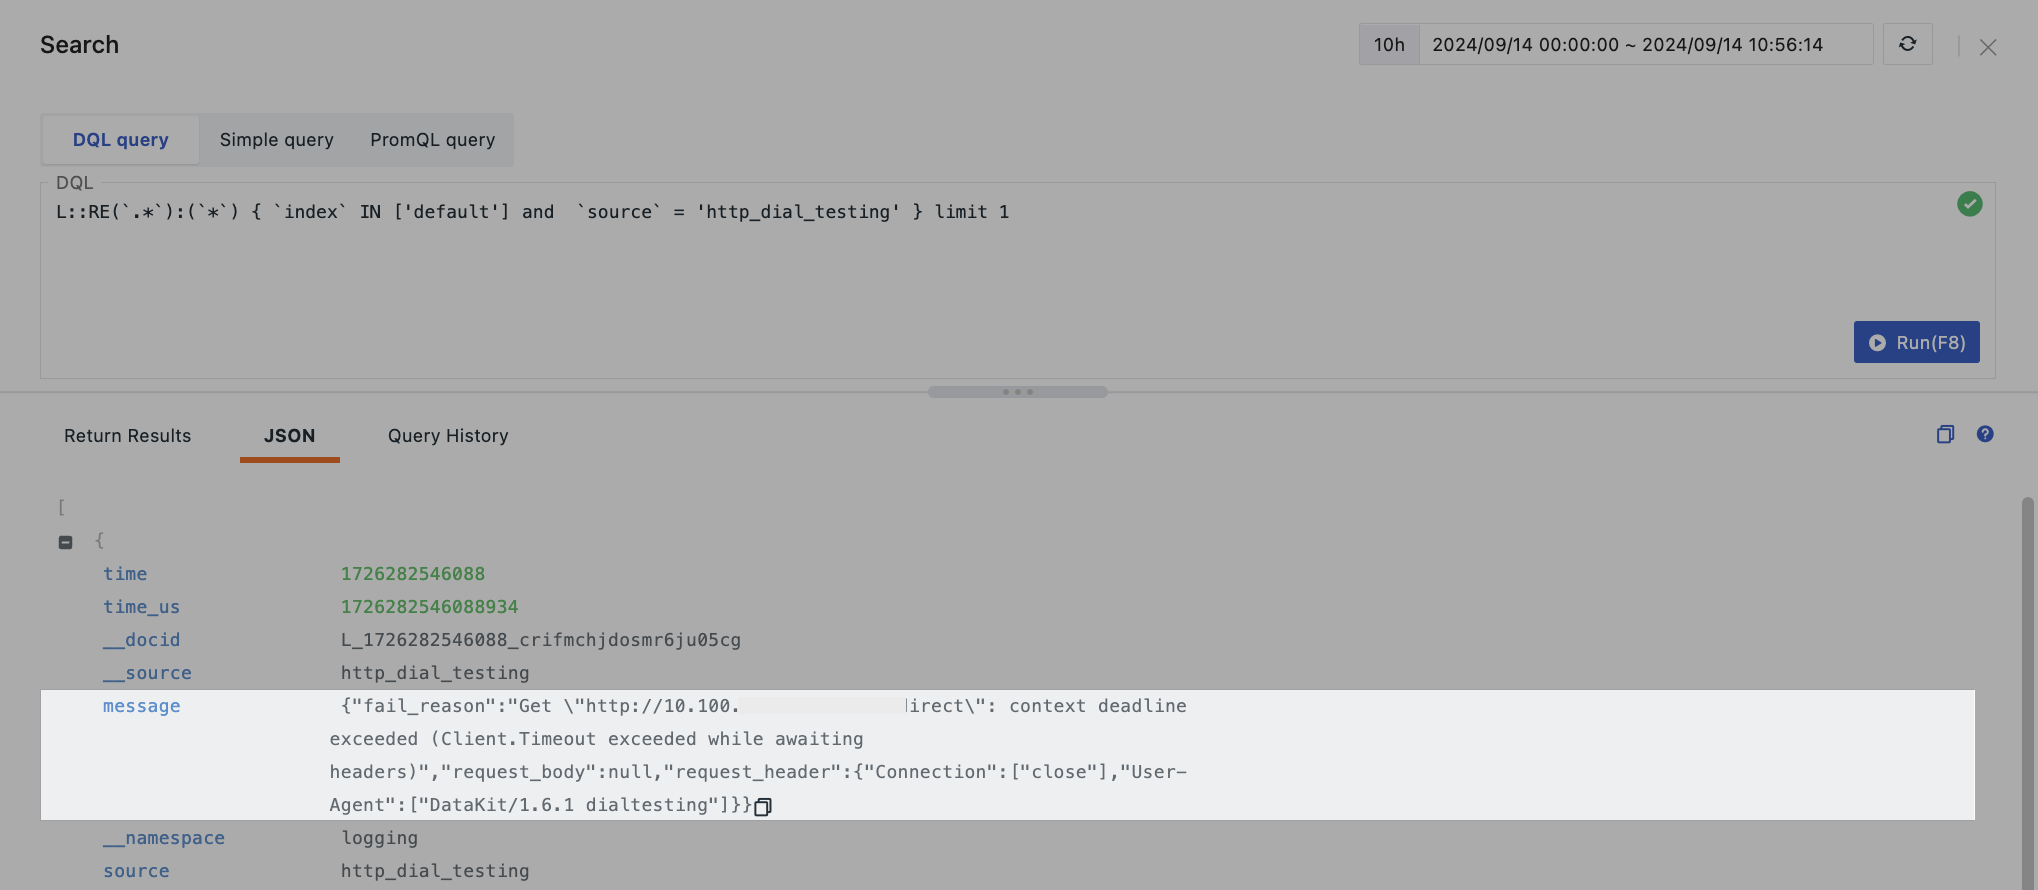
- Expected query after extracting embedded fields:
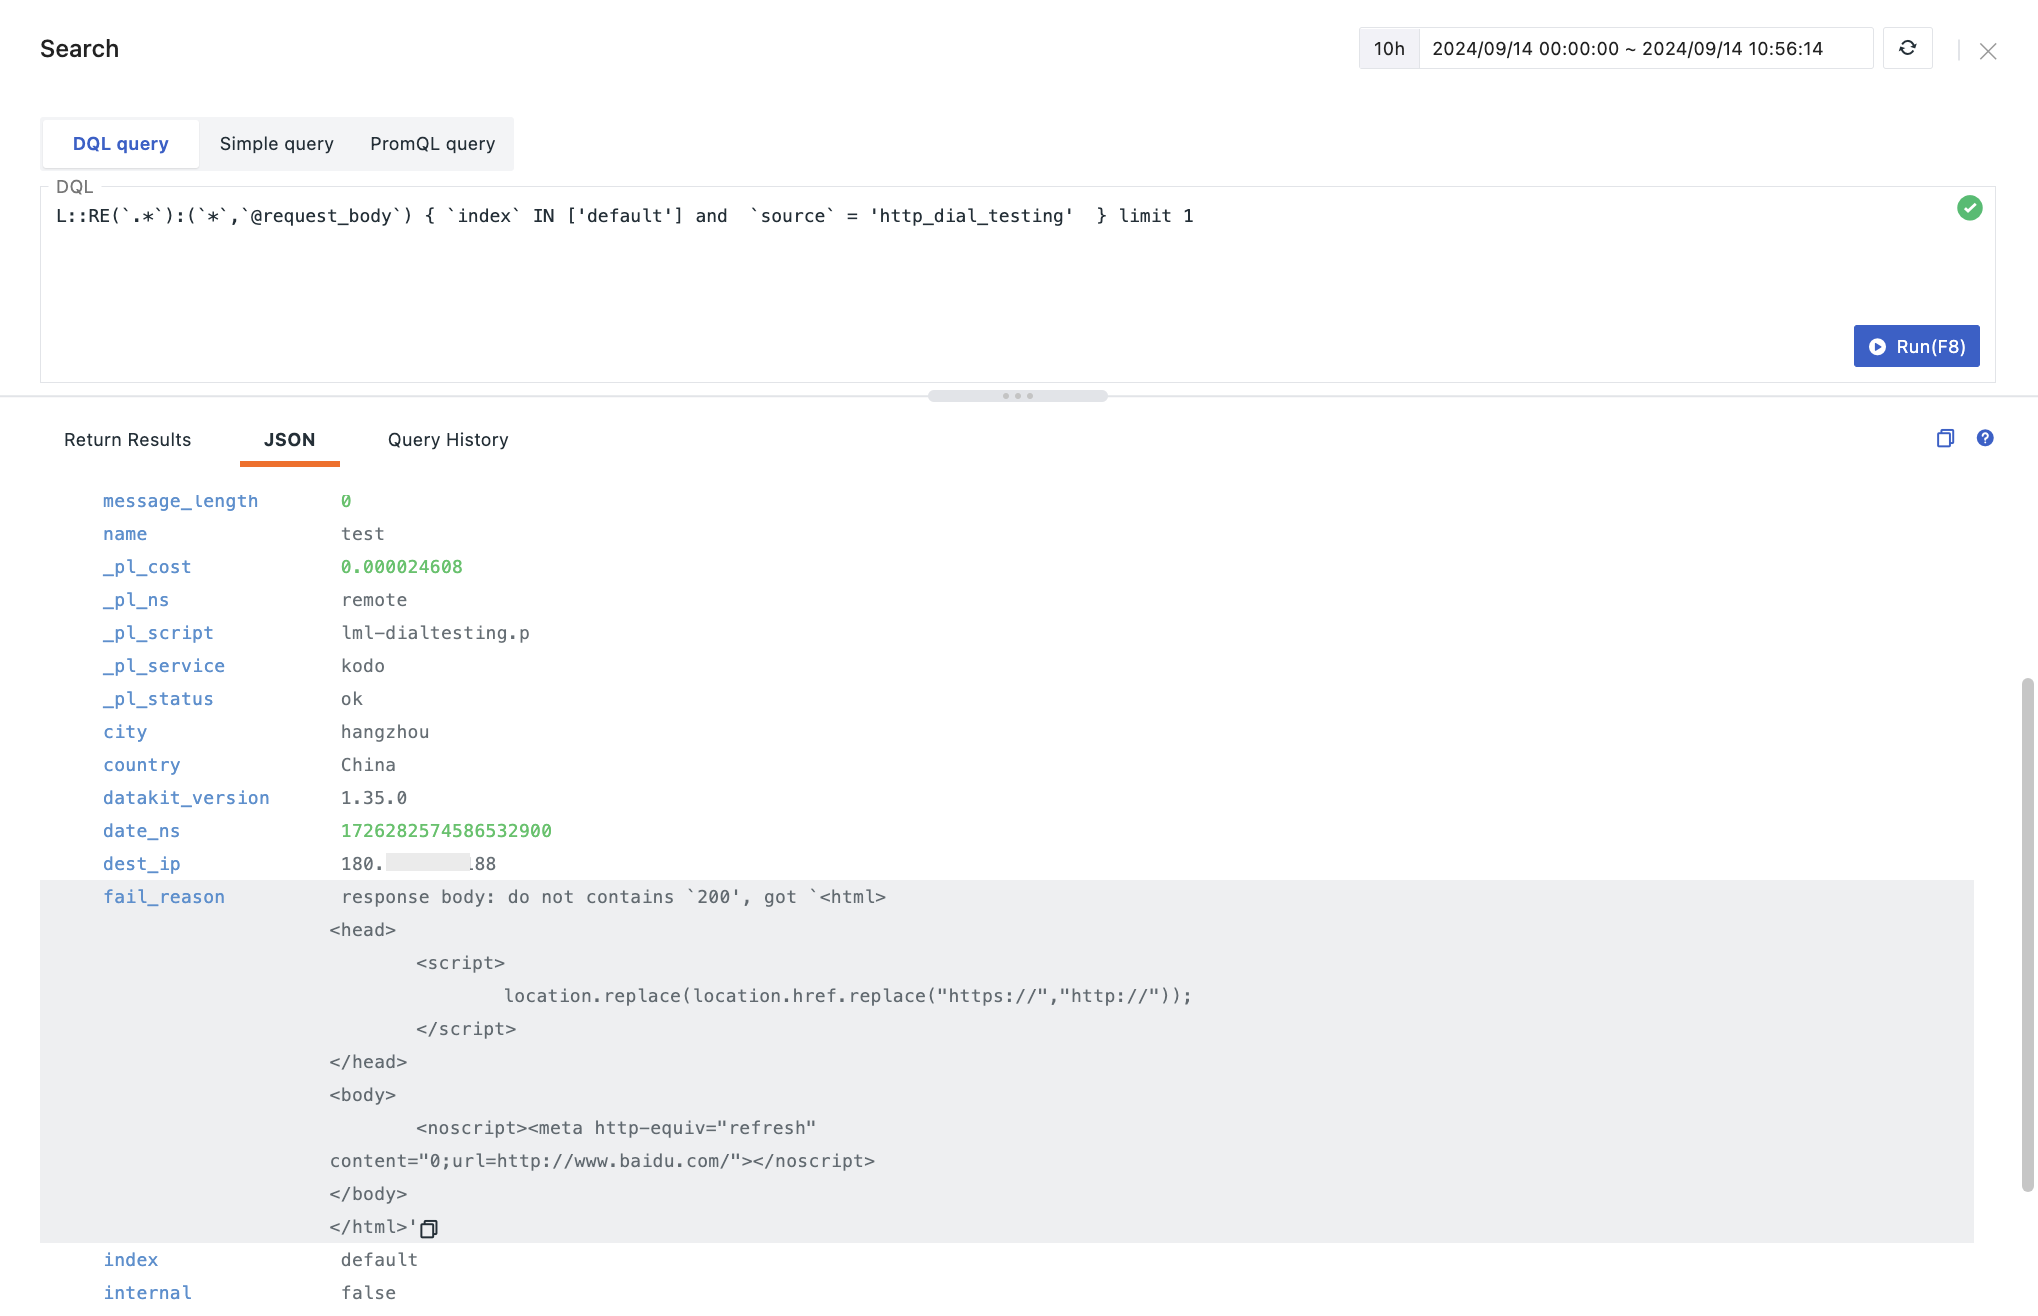
In the Log Explorer, if you want to directly specify viewing values extracted from the JSON text of each log's message in the data list, add a field in the format @target_fieldname in the display columns. As shown below, we add @fail_reason, which is already configured in the DQL query statement, to the display columns:
Log Color Highlighting
To help quickly locate key information in logs, the system uses color highlighting to display log content. When entering keywords in the search bar, only the matched keywords will be highlighted.
Log Single Line Expand and Copy
- Click the button in a log entry to view the complete content of that log. If the log supports JSON format, it will be displayed in JSON format; otherwise, the content will be displayed normally;
- Click the button to copy the entire log content to the clipboard.
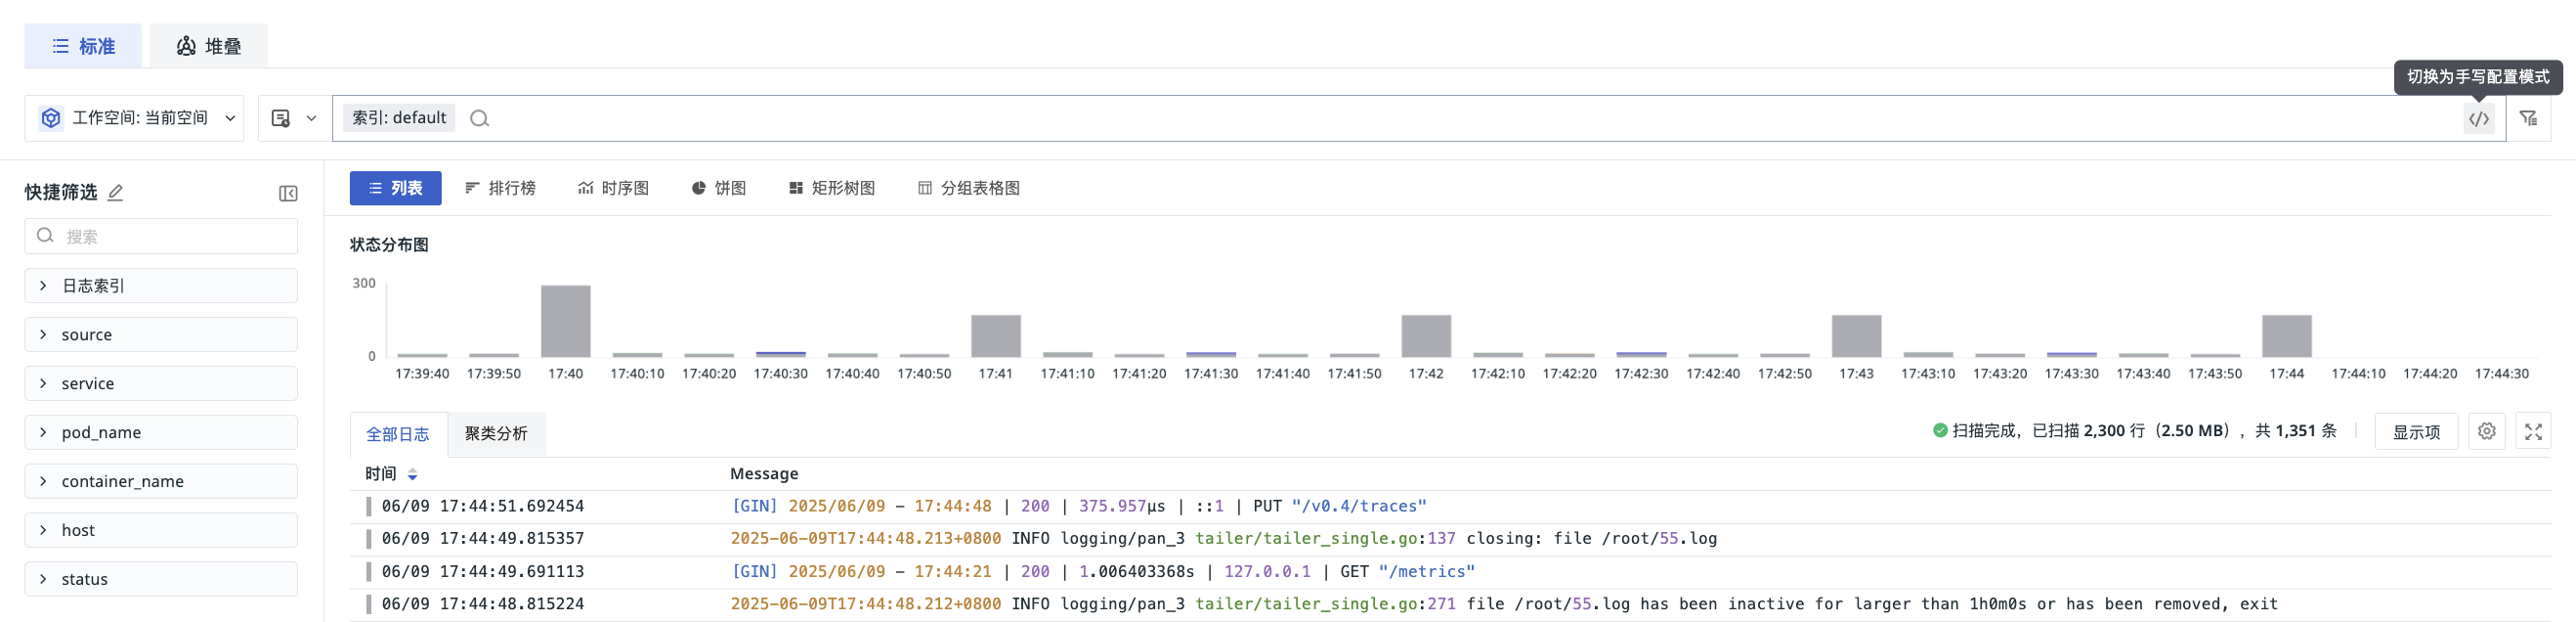
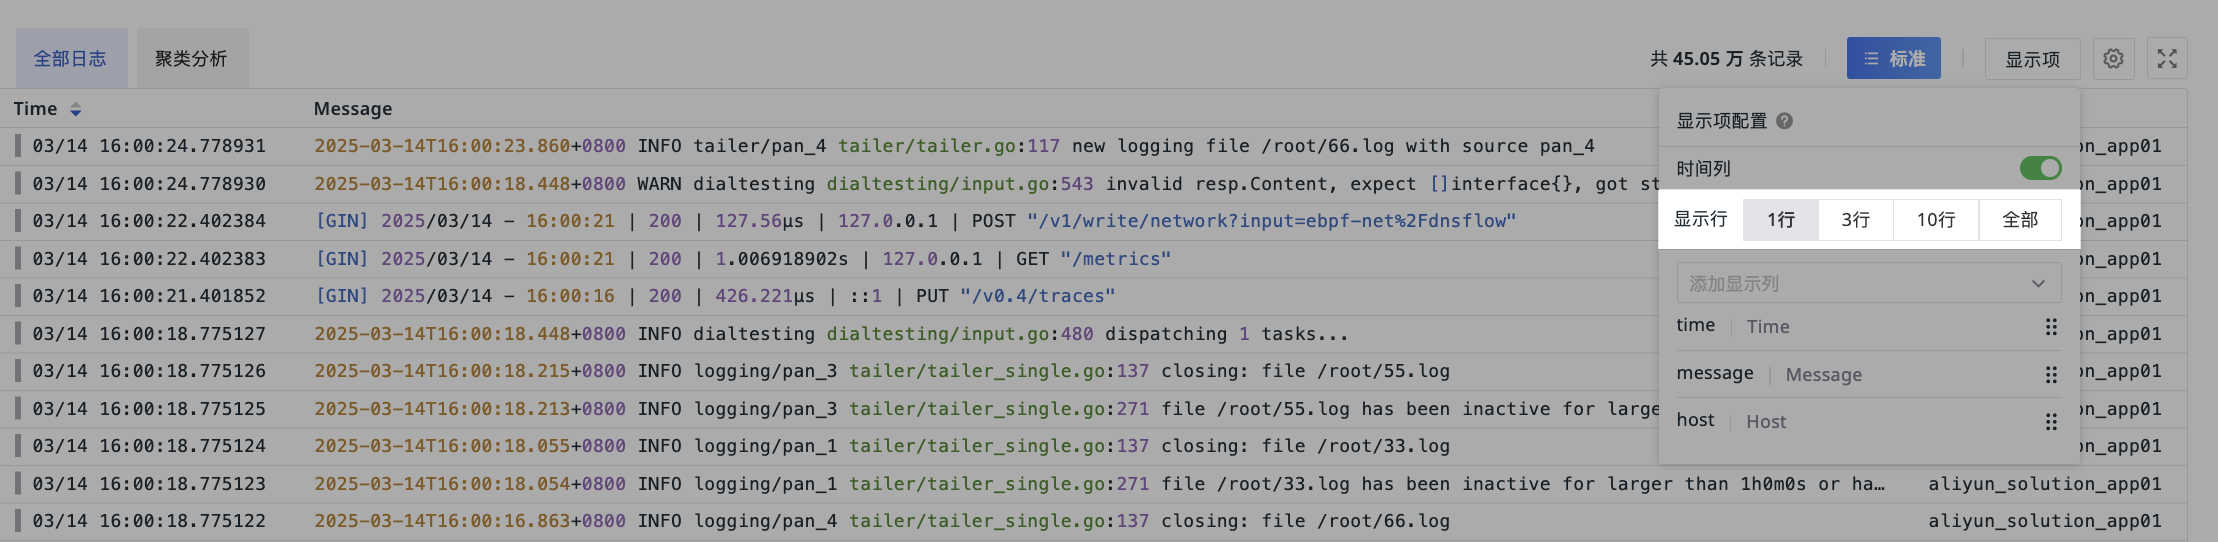
Display Lines
In the log data list, the trigger time and content of each log are displayed by default. You can use the "Display Lines" option to choose to display "1 line", "3 lines", "10 lines", or "All content" to view complete log information.
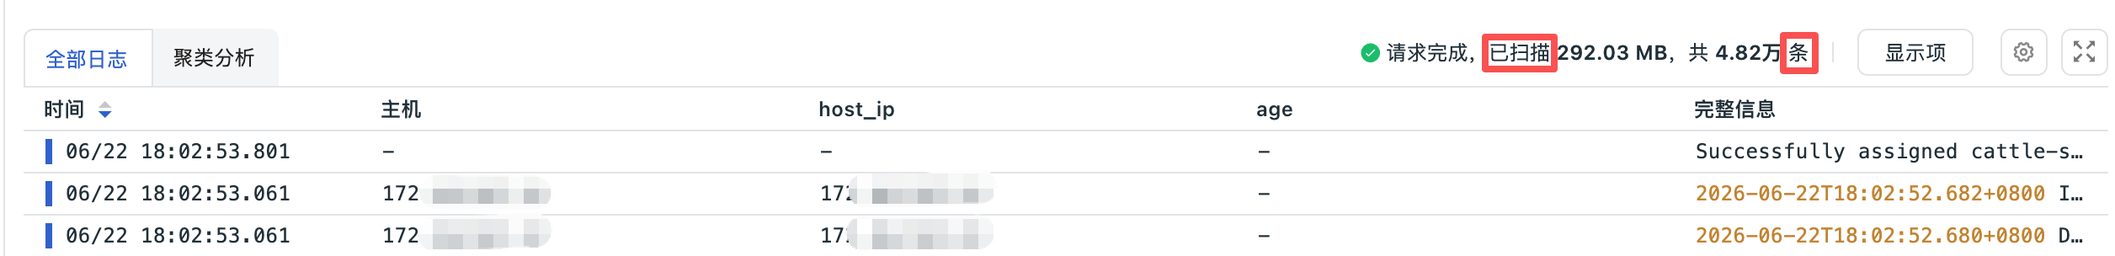
Explanation of "Scanned Volume" and "Count" Text
- Scanned Volume: Indicates the amount of data actually scanned during the execution of this query, used to measure query consumption. A larger scanned volume indicates that the query needs to retrieve and process a larger range of data.
- Count: Indicates the final number of results returned by this query, used to measure the scale of query results. The count only represents the number of matched results and is not equivalent to the amount of data scanned during the query process.
It is important to note that there is no fixed conversion relationship between scanned volume and count. Since the size of a single log is not fixed, and a query might scan a large amount of data but only match a small number of results, you cannot directly calculate the scanned volume from the count, nor can you deduce the returned count from the scanned volume.
Settings
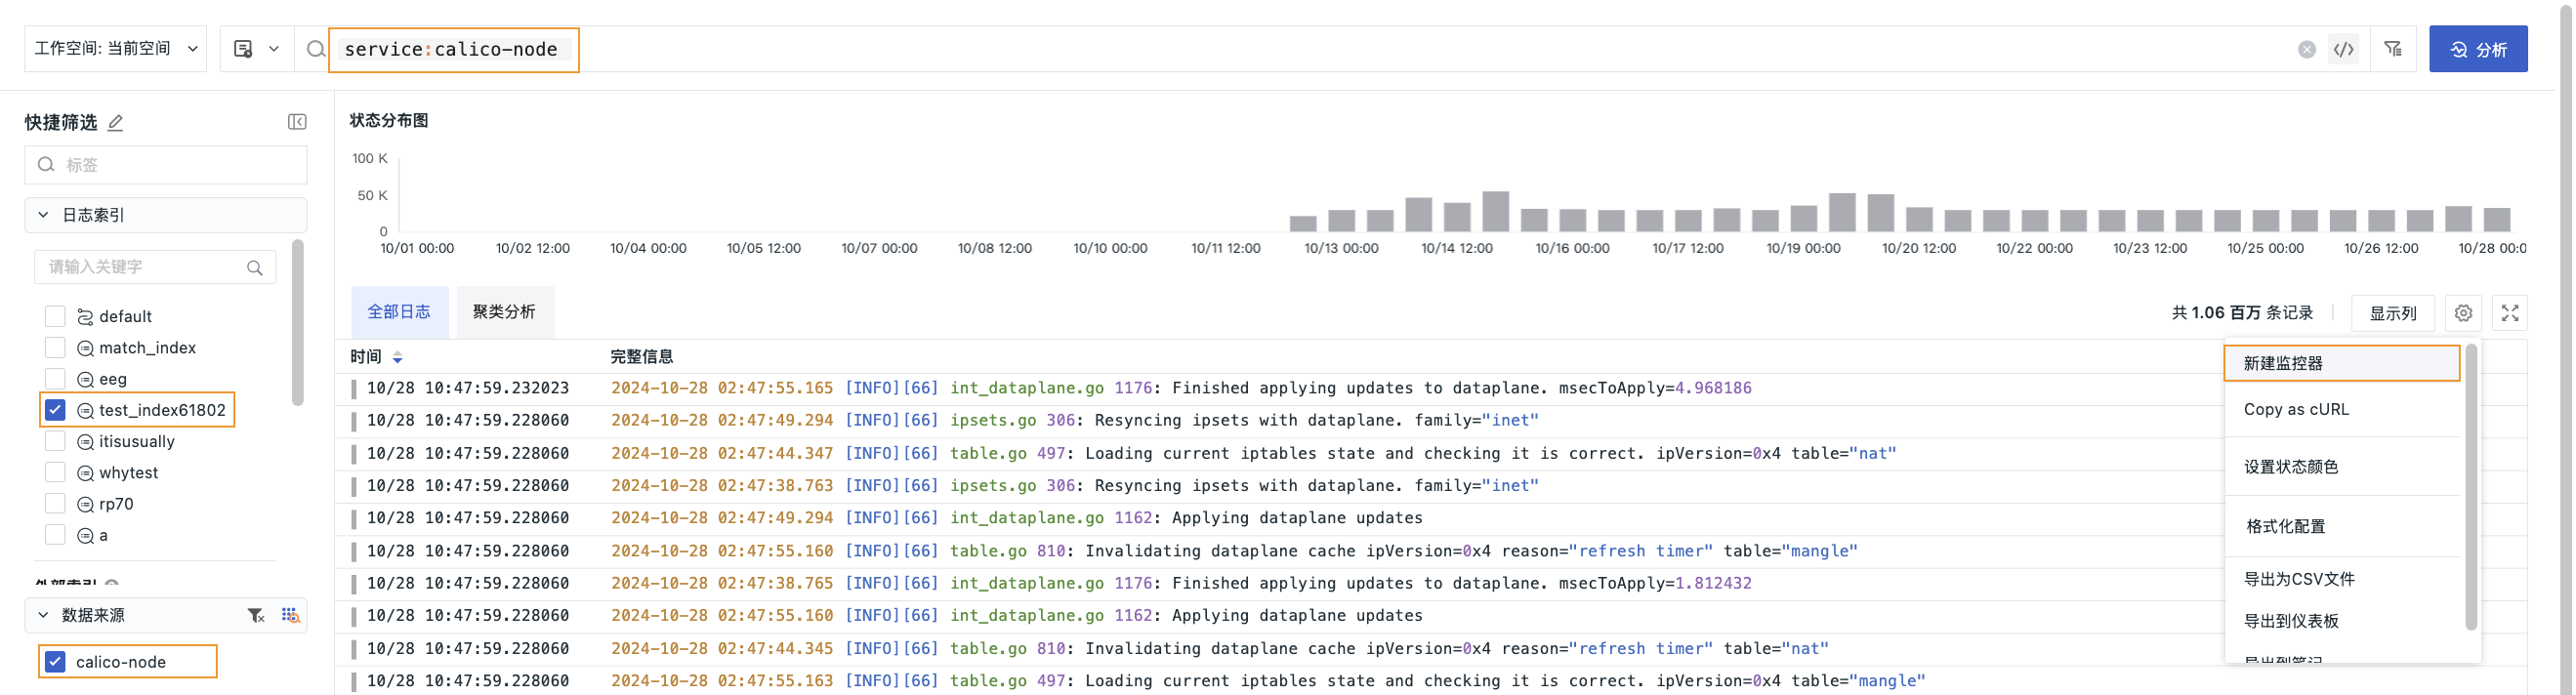
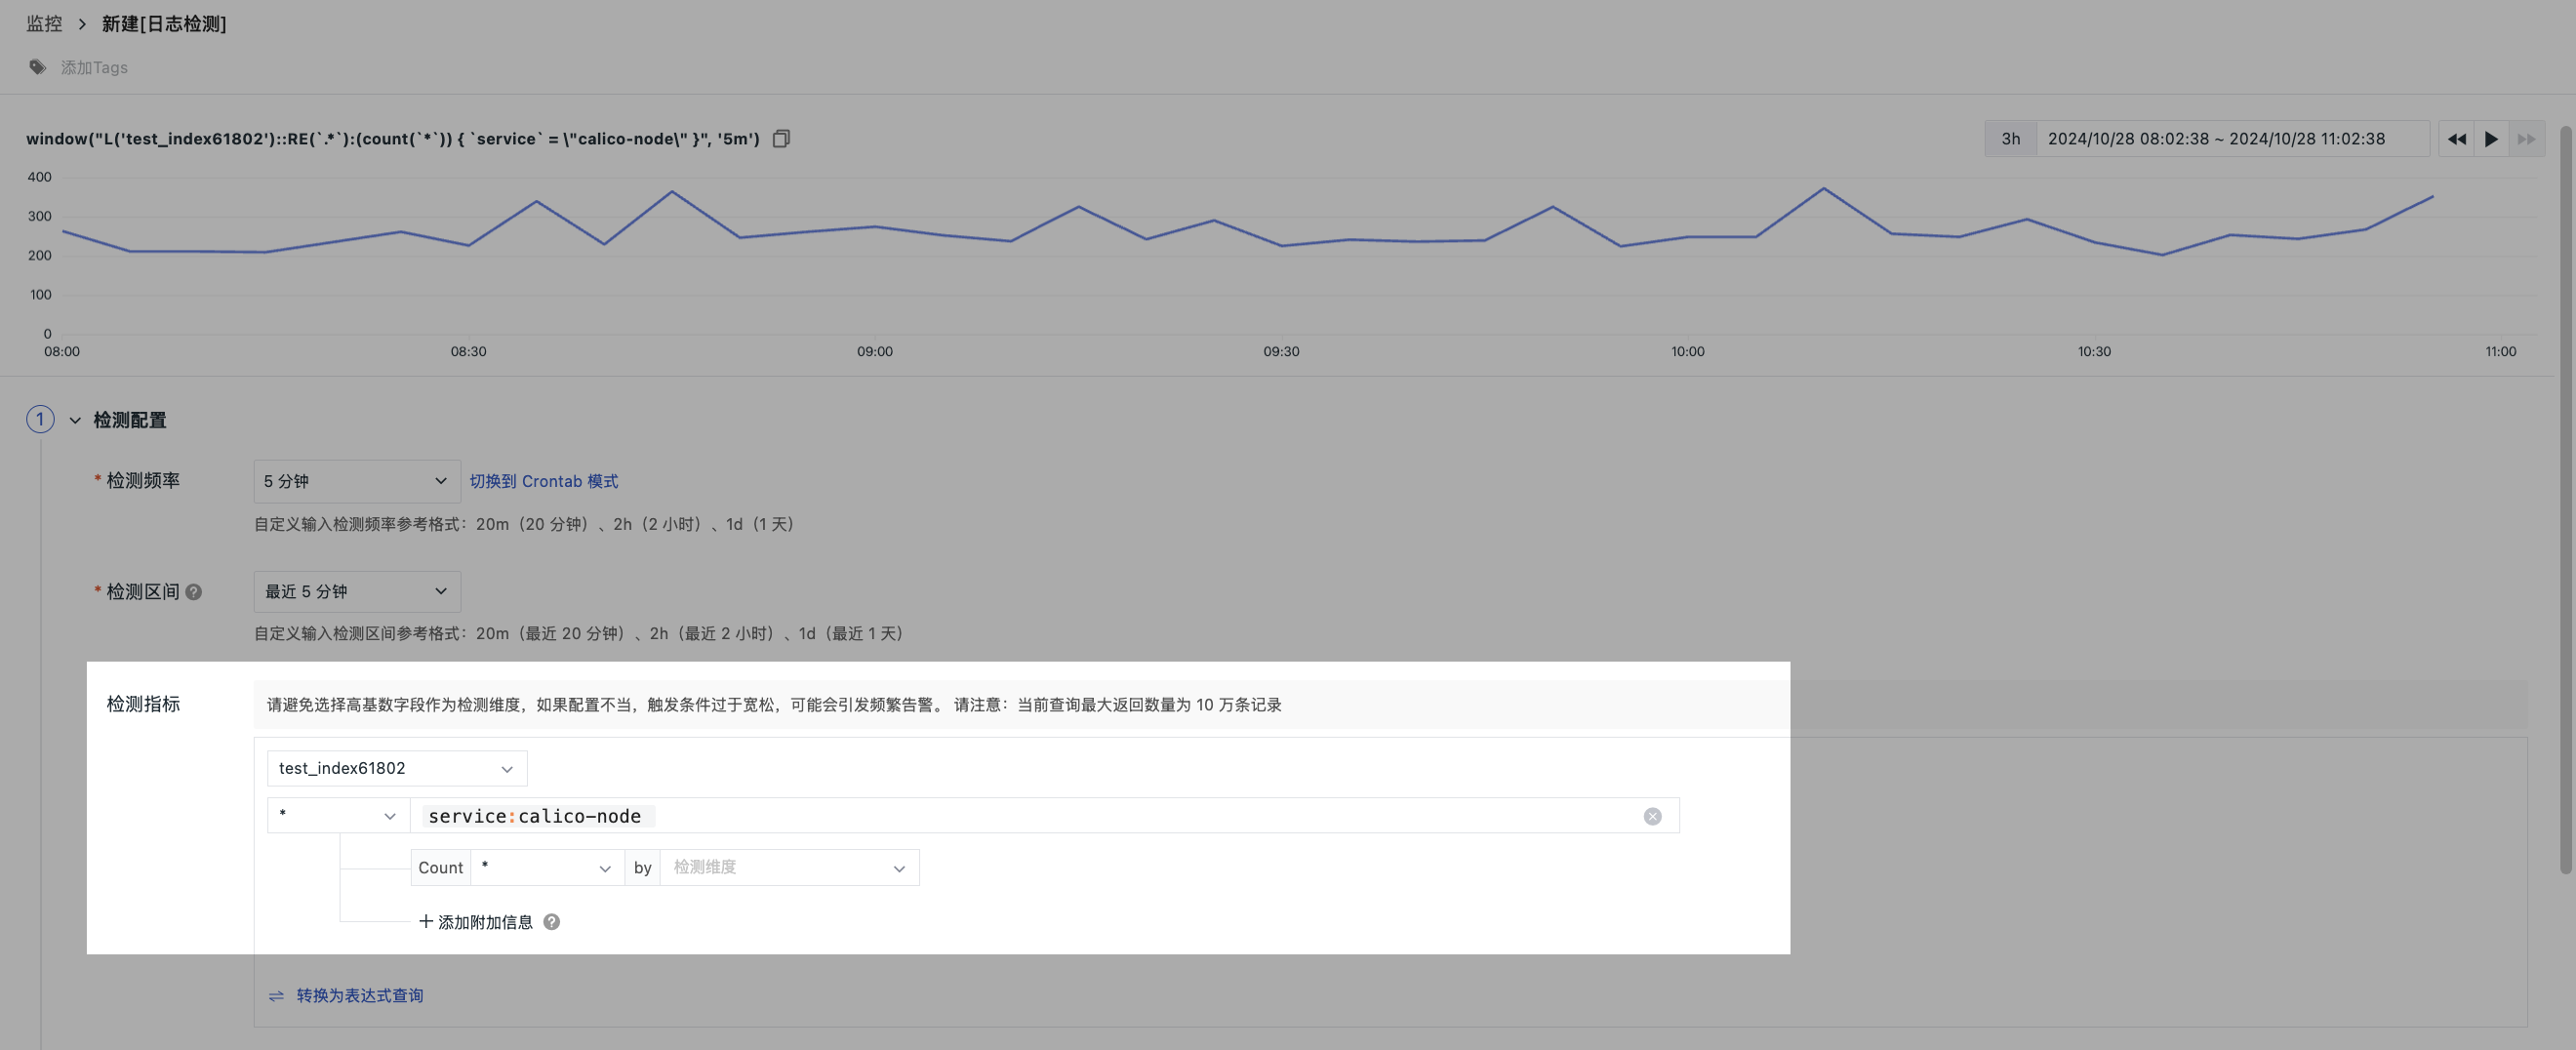
Create Monitor
When filtering log data, if you need to perform further alert monitoring on the filtered results, you can achieve this by creating a monitor with one click. The system will automatically apply the index, data source, and search conditions you selected, thereby simplifying the configuration process.
Note
- If you select another workspace in the upper left corner of the Log Explorer, the search conditions will not be synchronized to the monitor configuration page, and the monitor configuration page will be empty by default;
- In the standard Commercial Plan, site-level
left*query functionality is enabled by default. You only need to enable workspace-levelleft*query to supportleft*queries in monitors. For the Deployment Plan, you can independently enable or disable site-levelleft*query. Only when both site-level and workspace-levelleft*queries are enabled can monitors performleft*queries. Otherwise, if the Log Explorer is configured withleft*query, jumping to the monitor may result in query errors.
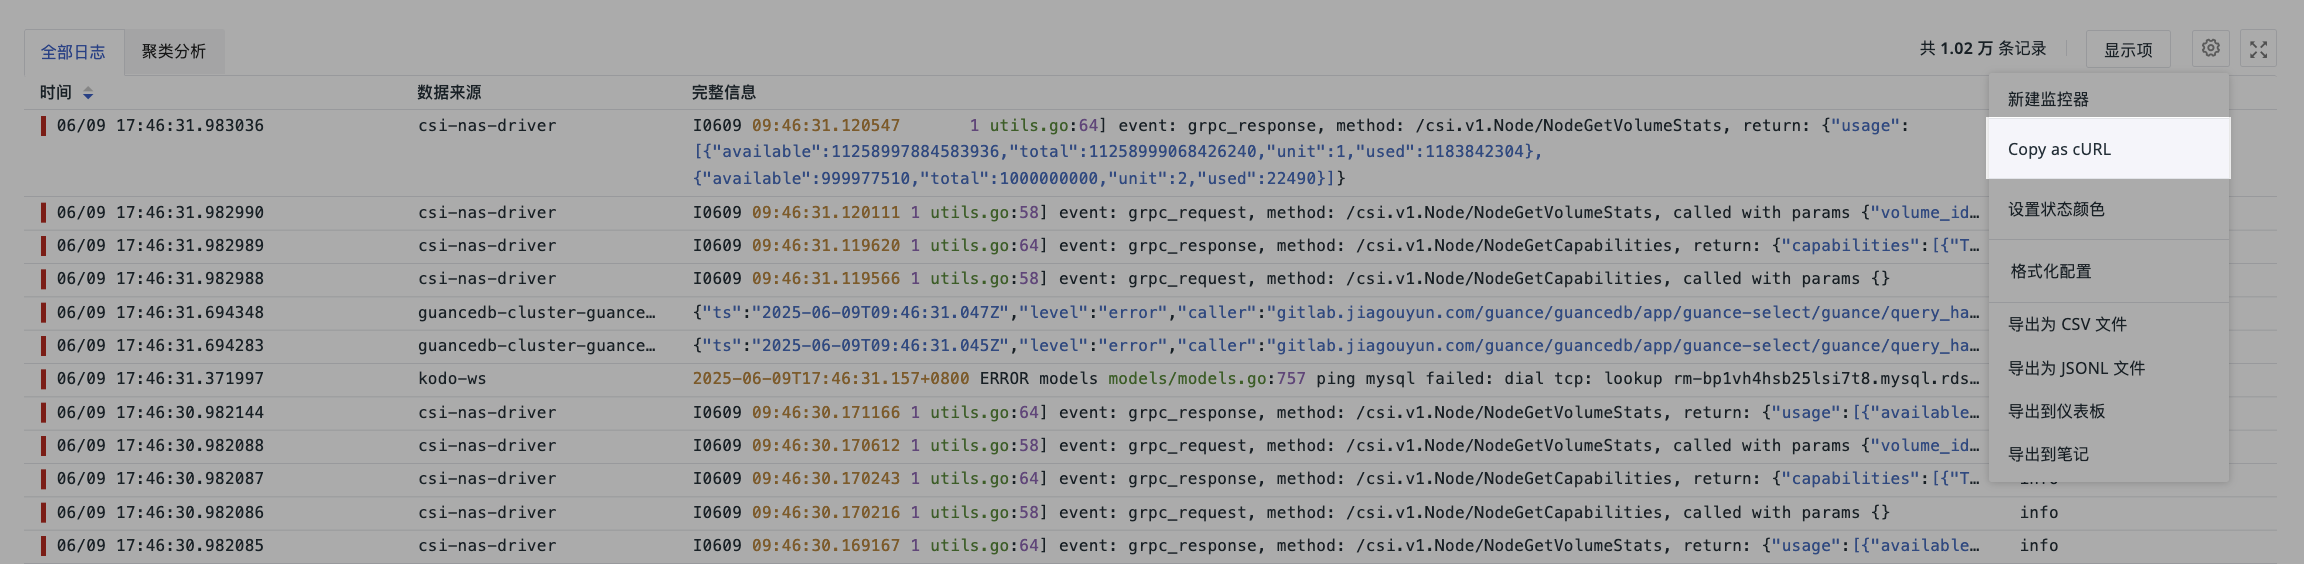
Copy as cURL
In the Log Explorer, you can obtain log data in command-line form. In the Settings on the right side of the log data list, click the Copy as cURL button to copy the corresponding cURL command. Paste this command into the host terminal and execute it to obtain log data within the current time period that meets the filter and search conditions.
Example
After copying the cURL command line, it looks like the figure below: where <Endpoint> needs to be replaced with the domain name, and <DF-API-KEY> needs to be replaced with the Key ID from API Management.
For more parameter descriptions, refer to DQL Data Query.
For more information about API, refer to Open API.
curl '<Endpoint>/api/v1/df/query_data?search_after=\[1680226330509,8572,"L_1680226330509_cgj4hqbrhi85kl1m6os0"\]&queries_body=%7B%22queries%22:\[%7B%22uuid%22:%222eb41760-cf6e-11ed-a983-7d559044c3fc%22,%22qtype%22:%22dql%22,%22query%22:%7B%22q%22:%22L::re(%60.*%60):(%60*%60)%7B+%60index%60+IN+\[%27default%27\]+%7D%22,%22highlight%22:true,%22limit%22:50,%22orderby%22:\[%7B%22time%22:%22desc%22%7D\],%22_funcList%22:\[\],%22funcList%22:\[\],%22disableMultipleField%22:false,%22disable_slimit%22:false,%22is_optimized%22:true,%22offset%22:0,%22search_after%22:\[1680226330509,8572,%22L_1680226330509_cgj4hqbrhi85kl1m6os0%22\],%22timeRange%22:\[1680187562081,1680230762081\],%22tz%22:%22Asia%2FShanghai%22%7D%7D\]%7D' \
- H 'DF-API-KEY: <DF-API-KEY>' \
- -compressed \
- -insecure
Note
Only Standard Members and above can perform the copy command line operation.
Besides this export path, you can also use other log data export methods.
Set Status Colors
The system has preset default colors for status values. If you need to customize the colors displayed for different statuses in the Explorer, you can click Set Status Colors to modify them.

Formatting Configuration
Note
Only administrators and above can perform Explorer formatting configuration.
Through formatting configuration, you can hide sensitive log content, highlight important log content, or achieve quick filtering by replacing log content.
- Click Settings in the upper right corner of the Explorer list;
- Click Formatting Configuration;
- Add mapping rules, enter the following content and save:
- Field: Specify the log field (e.g.,
content); - Matching Method: Select the matching method (currently supports =, !=, match, not match);
- Matching Content: Enter the content to be matched (e.g., DEBUG);
- Display As Content: Enter the replacement display content (e.g., **).
- Field: Specify the log field (e.g.,
Log Data Export
In logs, you can first filter the required data and then export it as CSV, JSONL files, or export to dashboards or notebooks.
If you need to export a specific log, open the detail page of that log and click the in the upper right corner.
Advanced Linkage Configuration
For more details, refer to Advanced Linkage Configuration.