Getting Started with Monitors
Monitors are user-configured automated detection tools that collect various types of data such as infrastructure, application performance, or logs in real-time. They trigger alerts and generate detailed event records when preset rules are met.
Guance provides a comprehensive anomaly monitoring system with over 700 out-of-the-box monitoring templates and supports more than ten detection rule types. By flexibly setting detection rules and associating alert notifications, it helps you quickly achieve a closed-loop process from problem discovery and localization to resolution.
Getting Started
Official Templates: Designed based on industry best practices and common scenarios, Guance includes a series of professional pre-built monitor templates covering key performance indicators and recommended thresholds for common technology stacks and business components. These templates help you quickly establish a monitoring system suitable for your business scenarios, effectively reducing initial configuration complexity.
Custom Detection Rules: By configuring over ten detection rule types such as threshold detection, anomaly detection, and range detection, you can customize the trigger conditions for monitors and receive alerts for abnormal events after enabling them. Suitable for personalized monitoring scenarios not covered by official templates.
Custom Template Library: For team collaboration scenarios, Guance supports reusing existing monitor configurations within the workspace. You can select an existing monitor as a template, adjust necessary parameters such as detection rules and alert conditions, and quickly generate a new monitor with a consistent structure, reducing repetitive configuration work.
For more details, refer to Monitors.
Quick Creation
Example 1: Using Official Templates (Recommended for Beginners)
The following example demonstrates creating a host CPU monitor using an official template:
- Go to Monitoring > Create Monitor > Official Template Library.
- Filter the detection library on the left to select Host Detection Library.
- From the filtered list, select
Host {{ host }} CPU Average Load Too High. - Save.
The system will automatically create the monitor and associate it with the corresponding alert strategy. When the host CPU average load exceeds the preset threshold, an event will be generated and an alert will be triggered.
Example 2: Custom Detection Rules
- Go to Monitoring > Monitors > Create Monitor.
- Select a detection rule (select Threshold Monitoring here) and go to the Configuration Page.
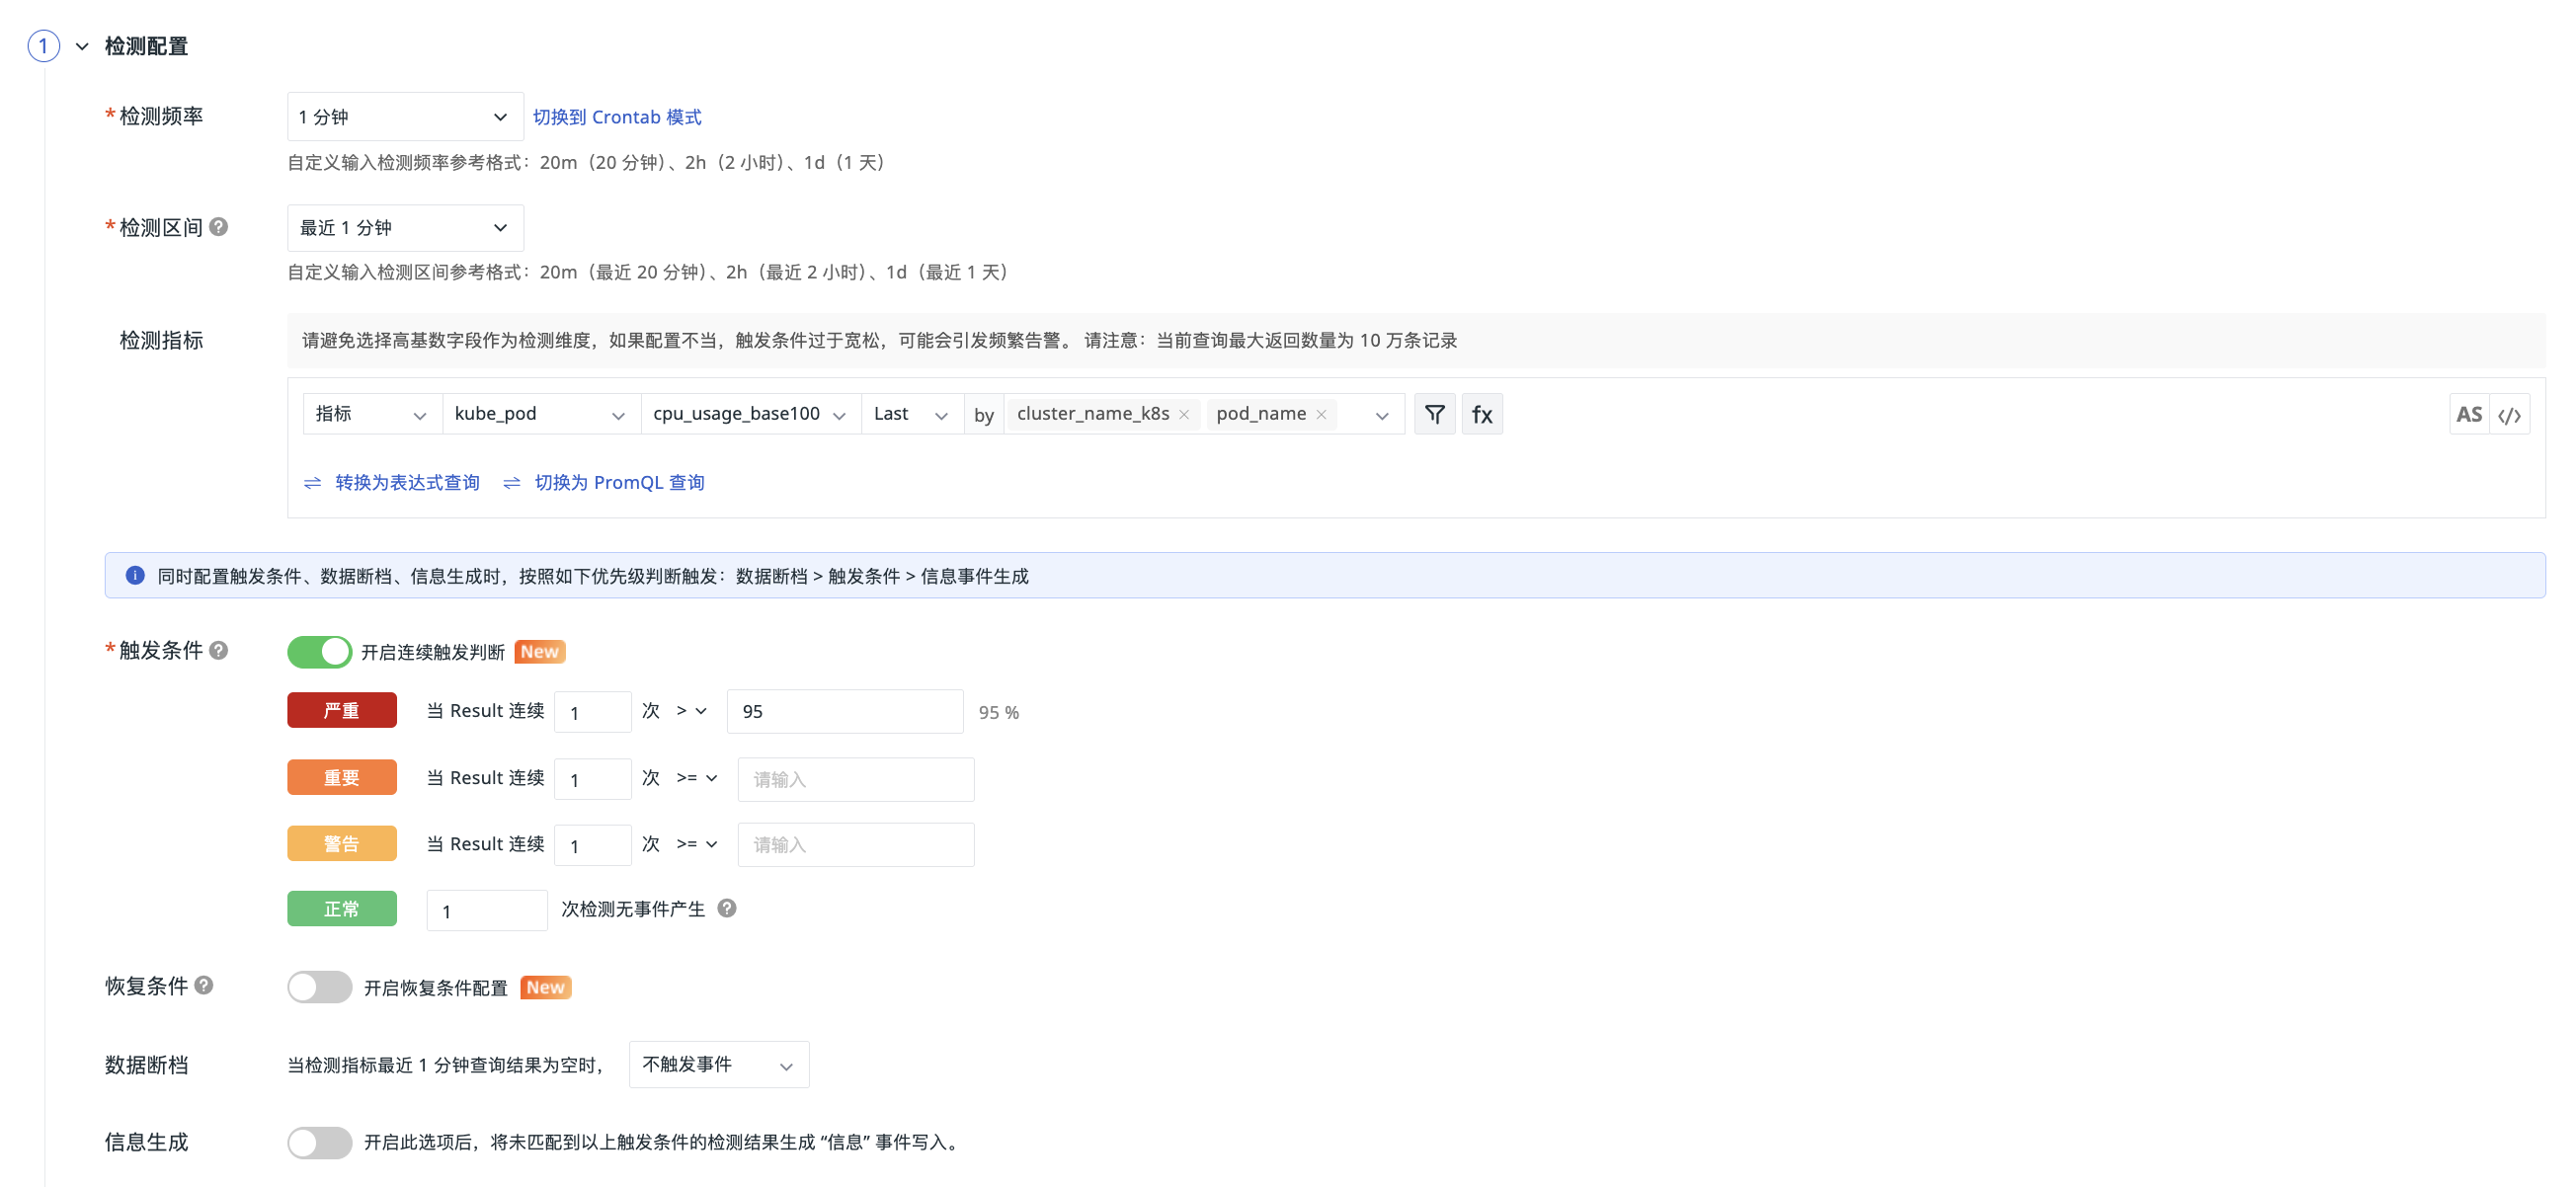
Detection Configuration
- Set the detection frequency to "1 minute".
- Select the detection interval as "Last 1 minute".
- Select the detection metric. Here, set the query condition as:
- Set the trigger condition: When the query result is greater than 95%, an event with the "Critical" severity level is triggered.
Note
When configuring trigger conditions, data gaps, and information generation simultaneously, the triggering priority is judged as follows: Data Gap > Trigger Condition > Information Event Generation.
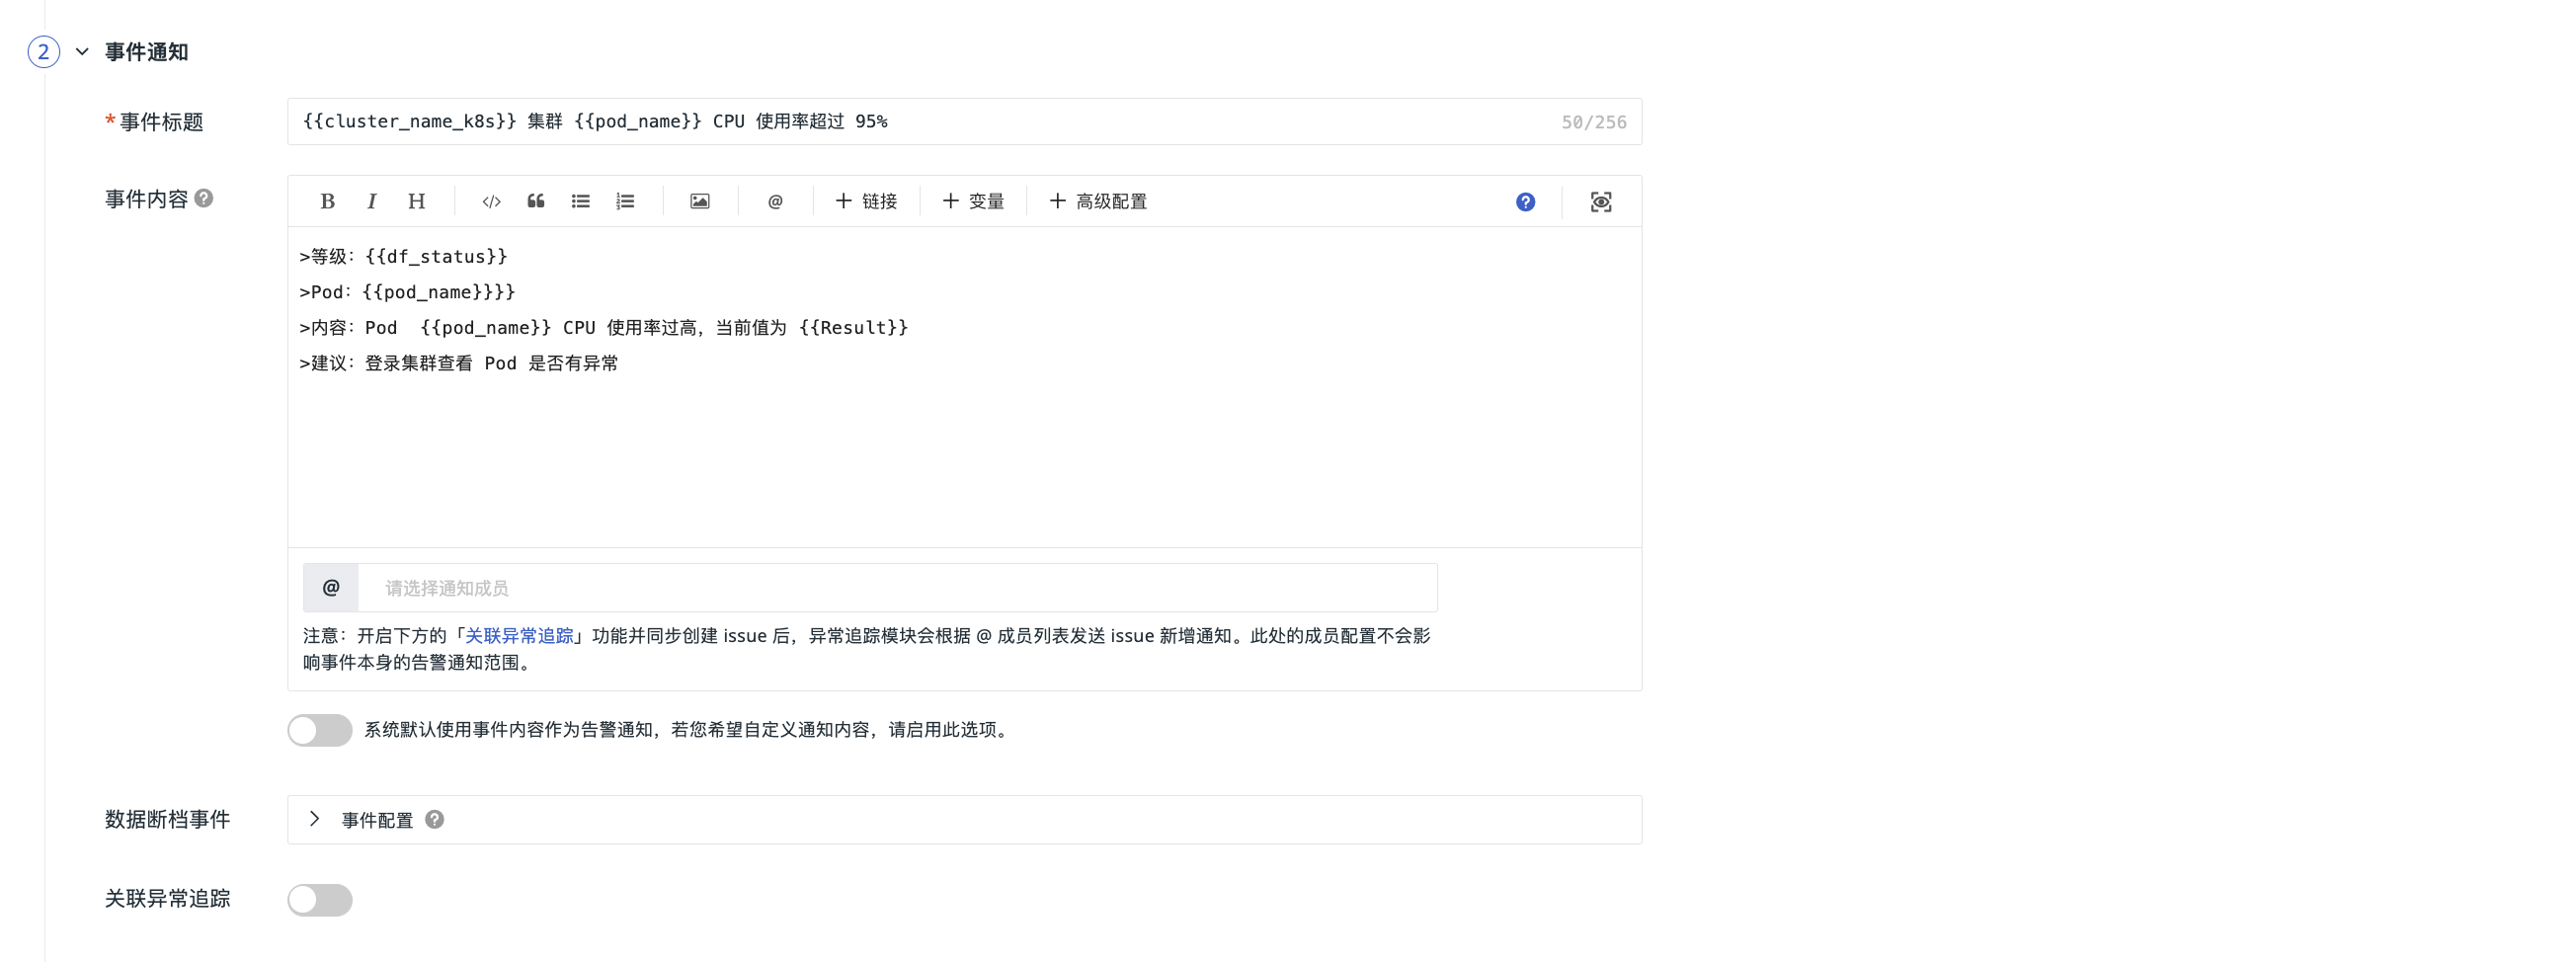
Event Notification
- Enter the event title.
- Define the event notification content.
Alert Configuration
Choose whether to associate an alert strategy. After the monitor meets the trigger conditions, it immediately sends alert messages to the specified notification targets.
In this example, no alert strategy is selected.
Association
Associate the monitor with a dashboard for quick navigation and visual data viewing.
In this example, no association is selected.
Permissions
Set the operational permissions for the monitor to ensure users perform operations according to their roles and permission levels.
In this example, no permissions are configured.
Viewing Monitors
After creating a detection rule, you can view it in the monitor list. Subsequently, all abnormal events triggered by this rule will be displayed in the Event Center.