Incident Details
The incident details page is a complete page for viewing and handling a single incident. You can view incident details, perform status operations, analyze related data, and collaborate with your team.
Warroom
You can create Lark group chats or Tencent Meetings in incident details to quickly organize relevant members for collaborative incident handling. After creation, you can view, join, or share the warroom from the current page; Lark warrooms also support syncing incident status and assignees, and claiming or closing incidents via in-group cards.
For complete instructions on connecting IM apps and creating and managing warrooms, see Warroom.
Manually Send Webhook
Members with Incident Management permission can click Send Webhook at the top of the incident details page to immediately send the latest information about the current incident to a third-party system. This operation applies to incidents in the Open, Working, Resolved, and Closed states.
- Select an enabled Webhook in the current workspace from Send To;
- Enter a sending description, 1 to 1000 characters, with line breaks supported;
- Click Send.
Manual sending is not affected by the Webhook auto-trigger event configuration or the aggregation window. Even if an enabled Webhook has no auto-trigger event selected, it can still be sent manually; disabled Webhooks cannot be selected. Only one Webhook can be selected at a time. Sending is not retried automatically, and both success and failure results can be viewed in the Webhook's Send History.
Note
- Members with view-only permission cannot manually send Webhooks;
- The same member cannot submit repeatedly for the same incident and the same Webhook within 5 seconds;
- Manual sending is not written to incident collaboration records or the activity timeline.
For Webhook configuration, the request protocol, and the manual-send Payload description, see Incident Webhook Push.
Top Overview
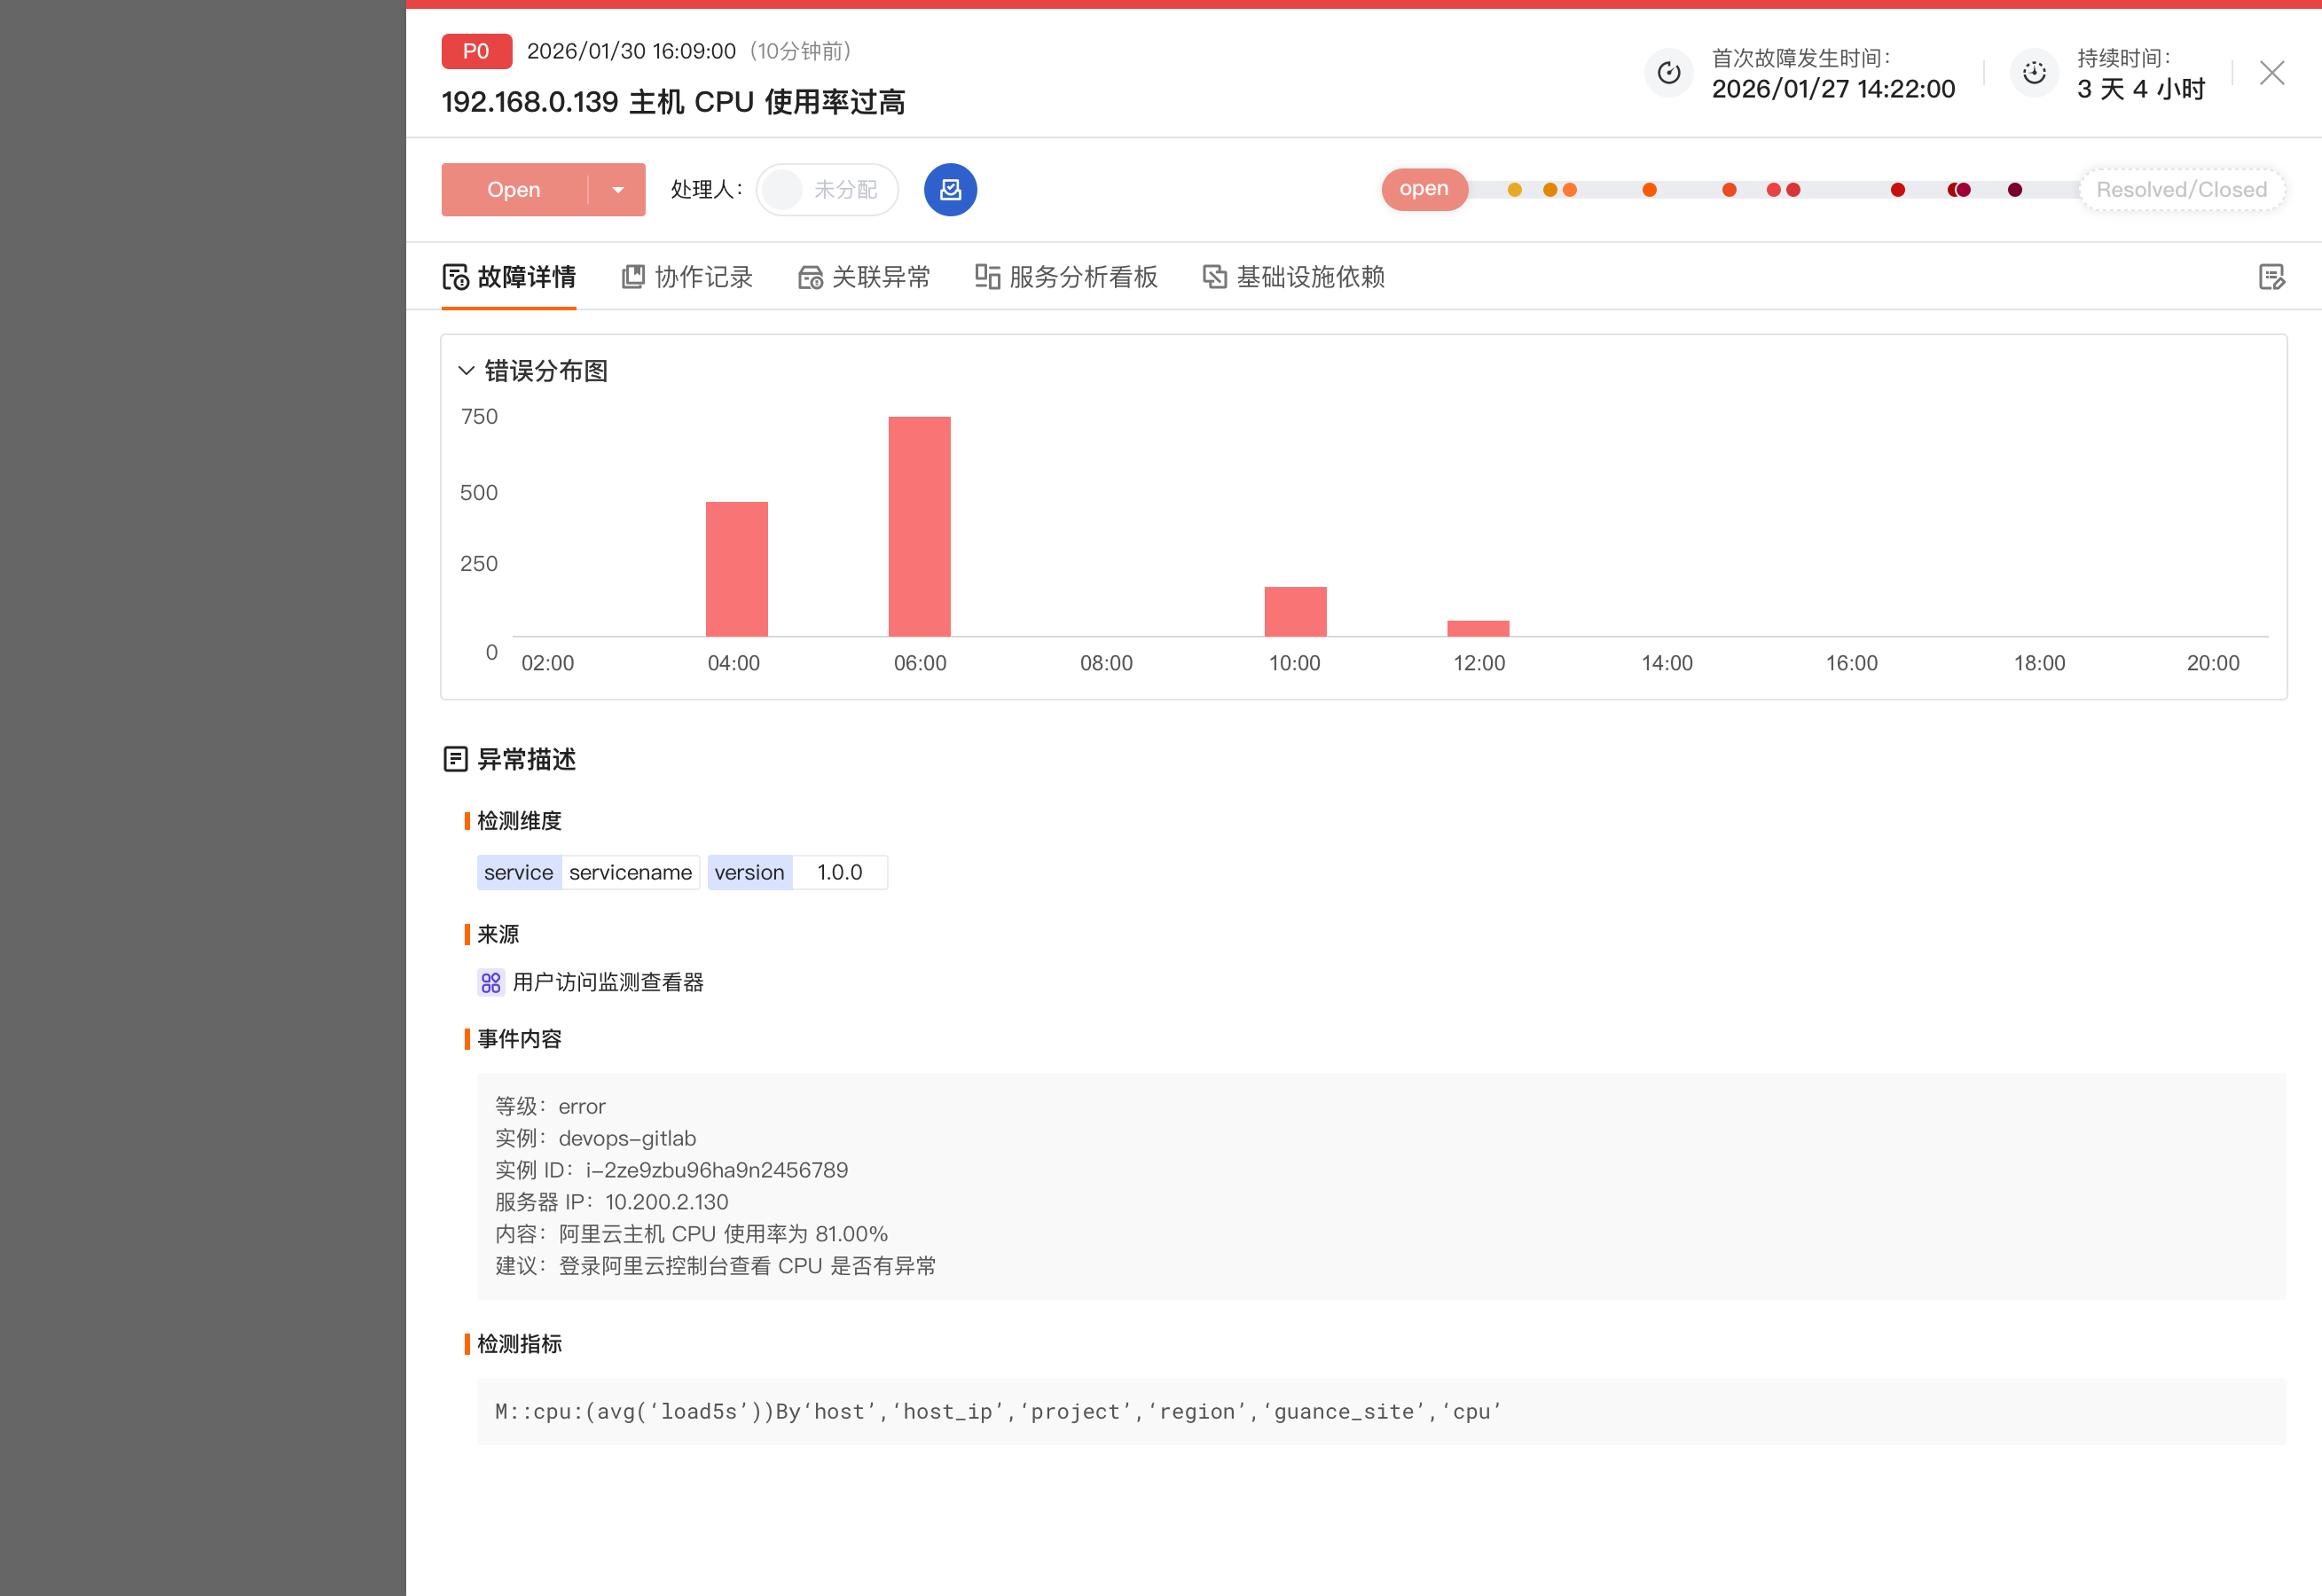
The top of the incident details page displays the core information of the incident, including:
- Incident severity: such as P0, P1, specified when the Monitor triggers and cannot be modified;
- Status and time: the current status (Open/Working/Resolved/Closed), its first trigger time, and the total incident duration.
- Title: a brief description of the incident;
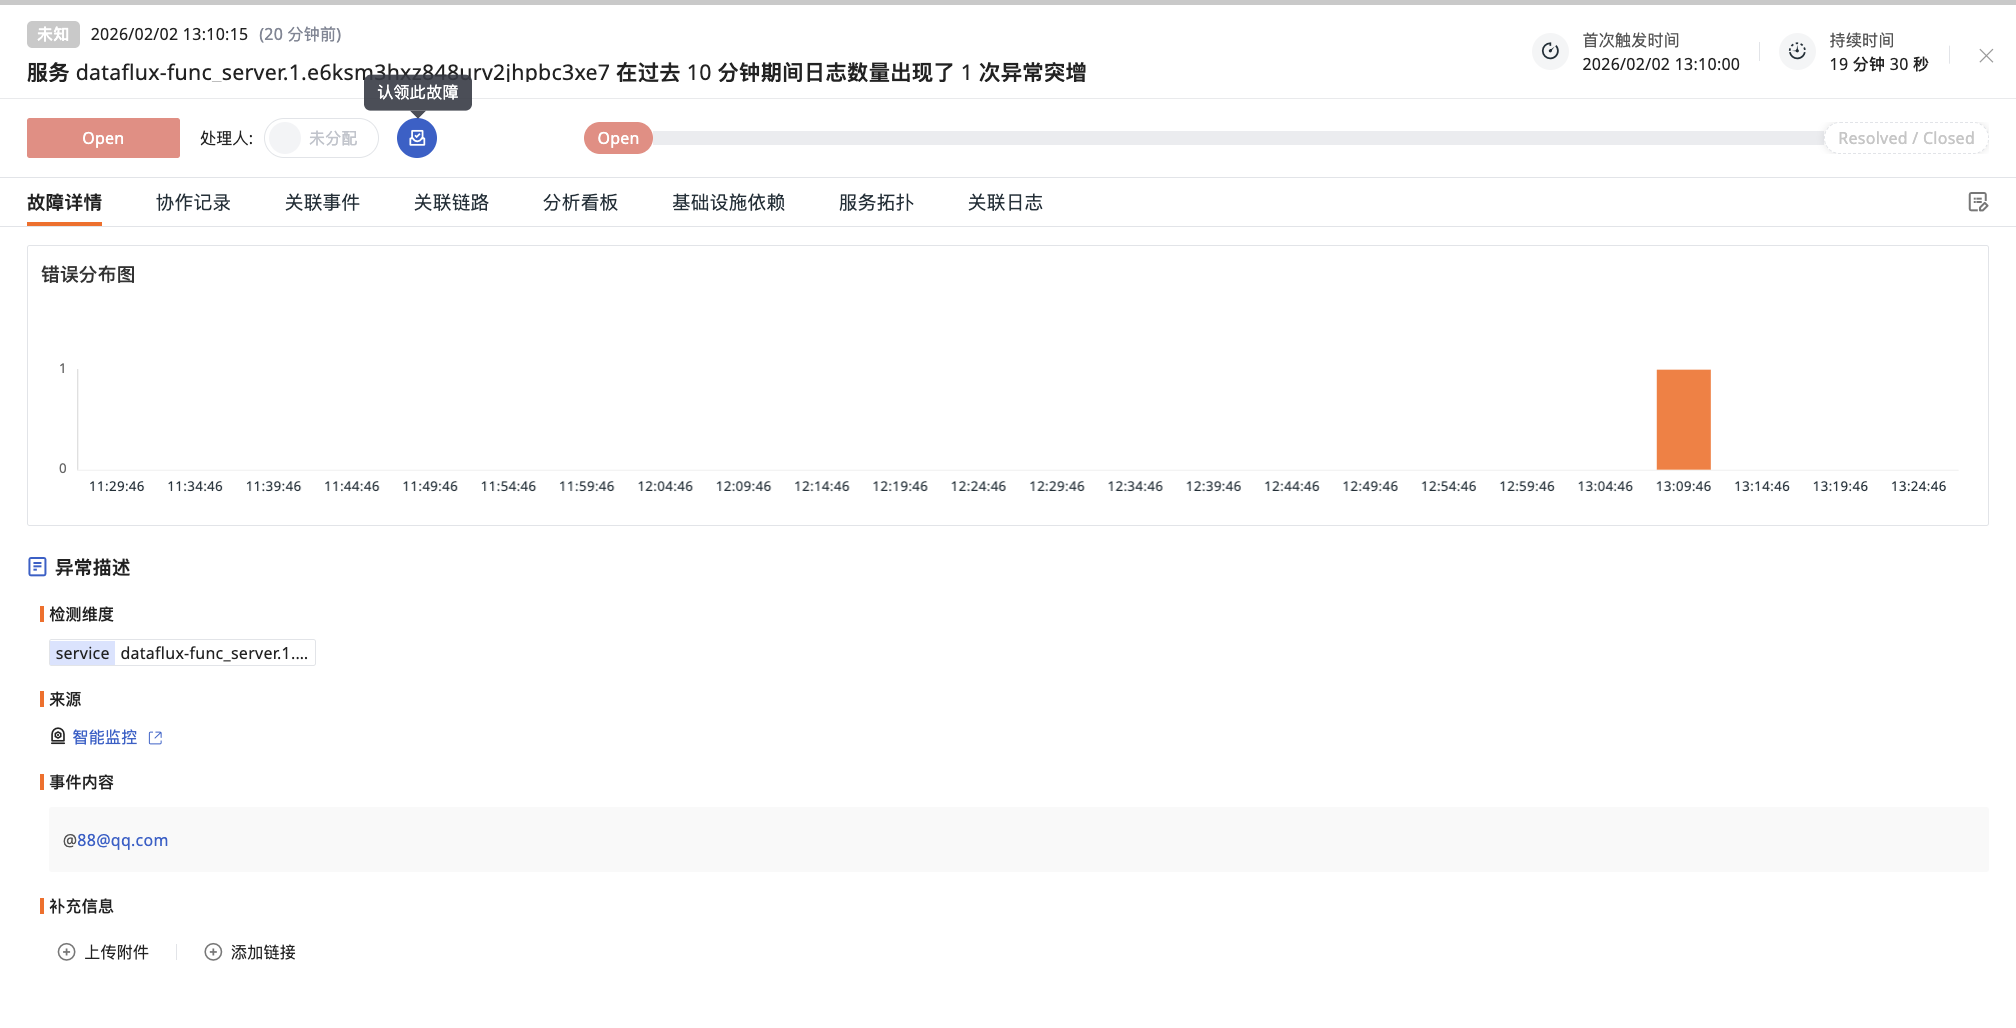
- Assignee: displays the current assignee. You can manually assign or change the assignee (member/team) here.
Status Transitions
-
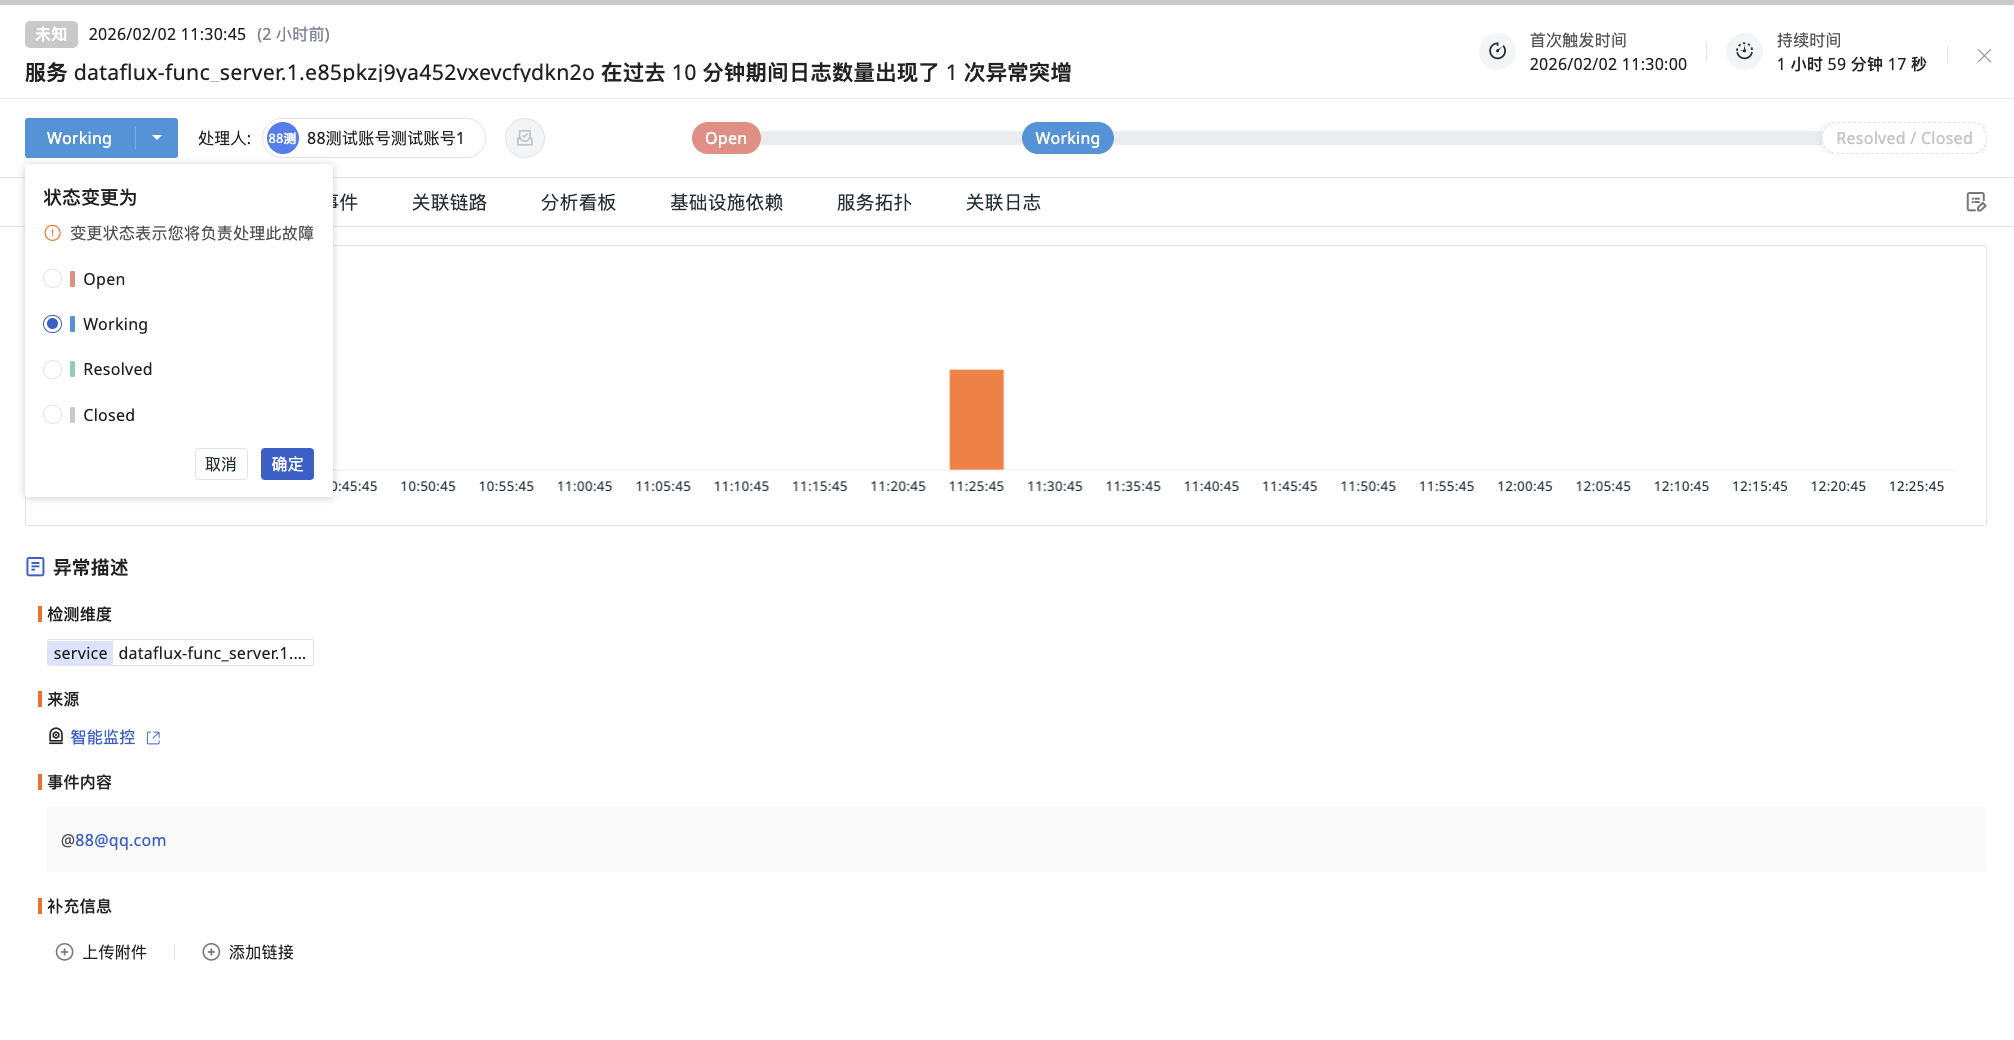
Status switching: Only the current assignee can select Change Incident Status from the dropdown. Status changes are updated in real time and recorded in the operations timeline;
-
Progress nodes: Key status change nodes are displayed in a timeline format on the right side or top of the page;
-
Rollback: The assignee can roll back an incident in the Working state to Open; after rollback, the assignee is cleared.
Leave Handling Mechanism
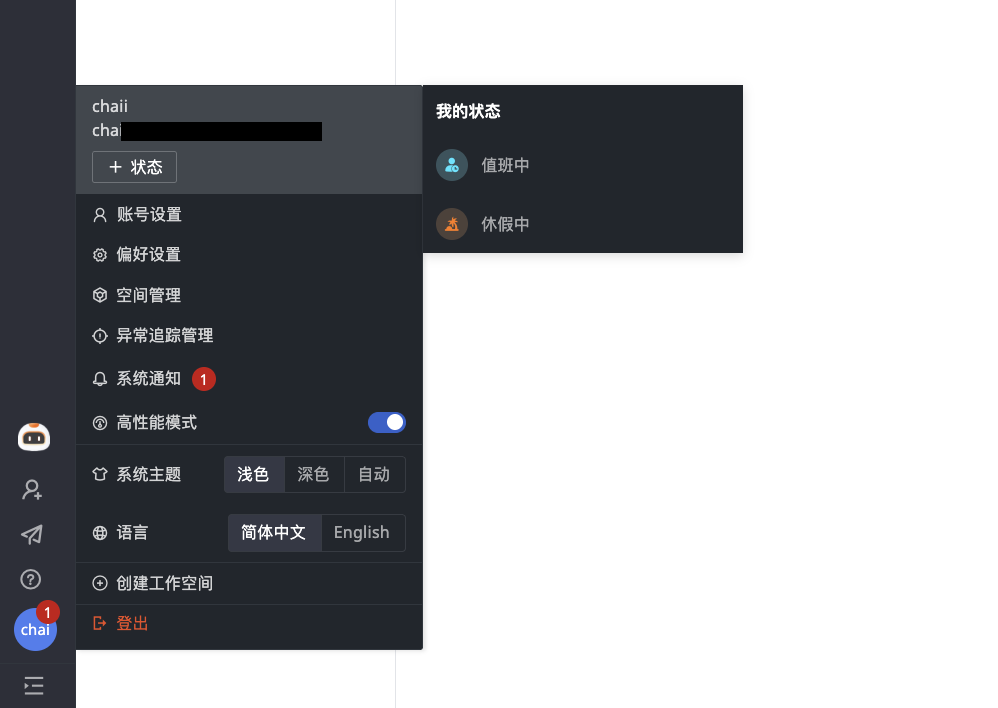
If you have claimed an incident but need to take leave:
- Go to Account Settings > Status > select "On Leave";
- The system will no longer send notifications for this incident to you;
- It is recommended to first hand off the incident to another user, or ensure that the escalation policy has a subsequent notifier configured.
Incident Details
When you enter the details page, the "Incident Details" tab is displayed by default.
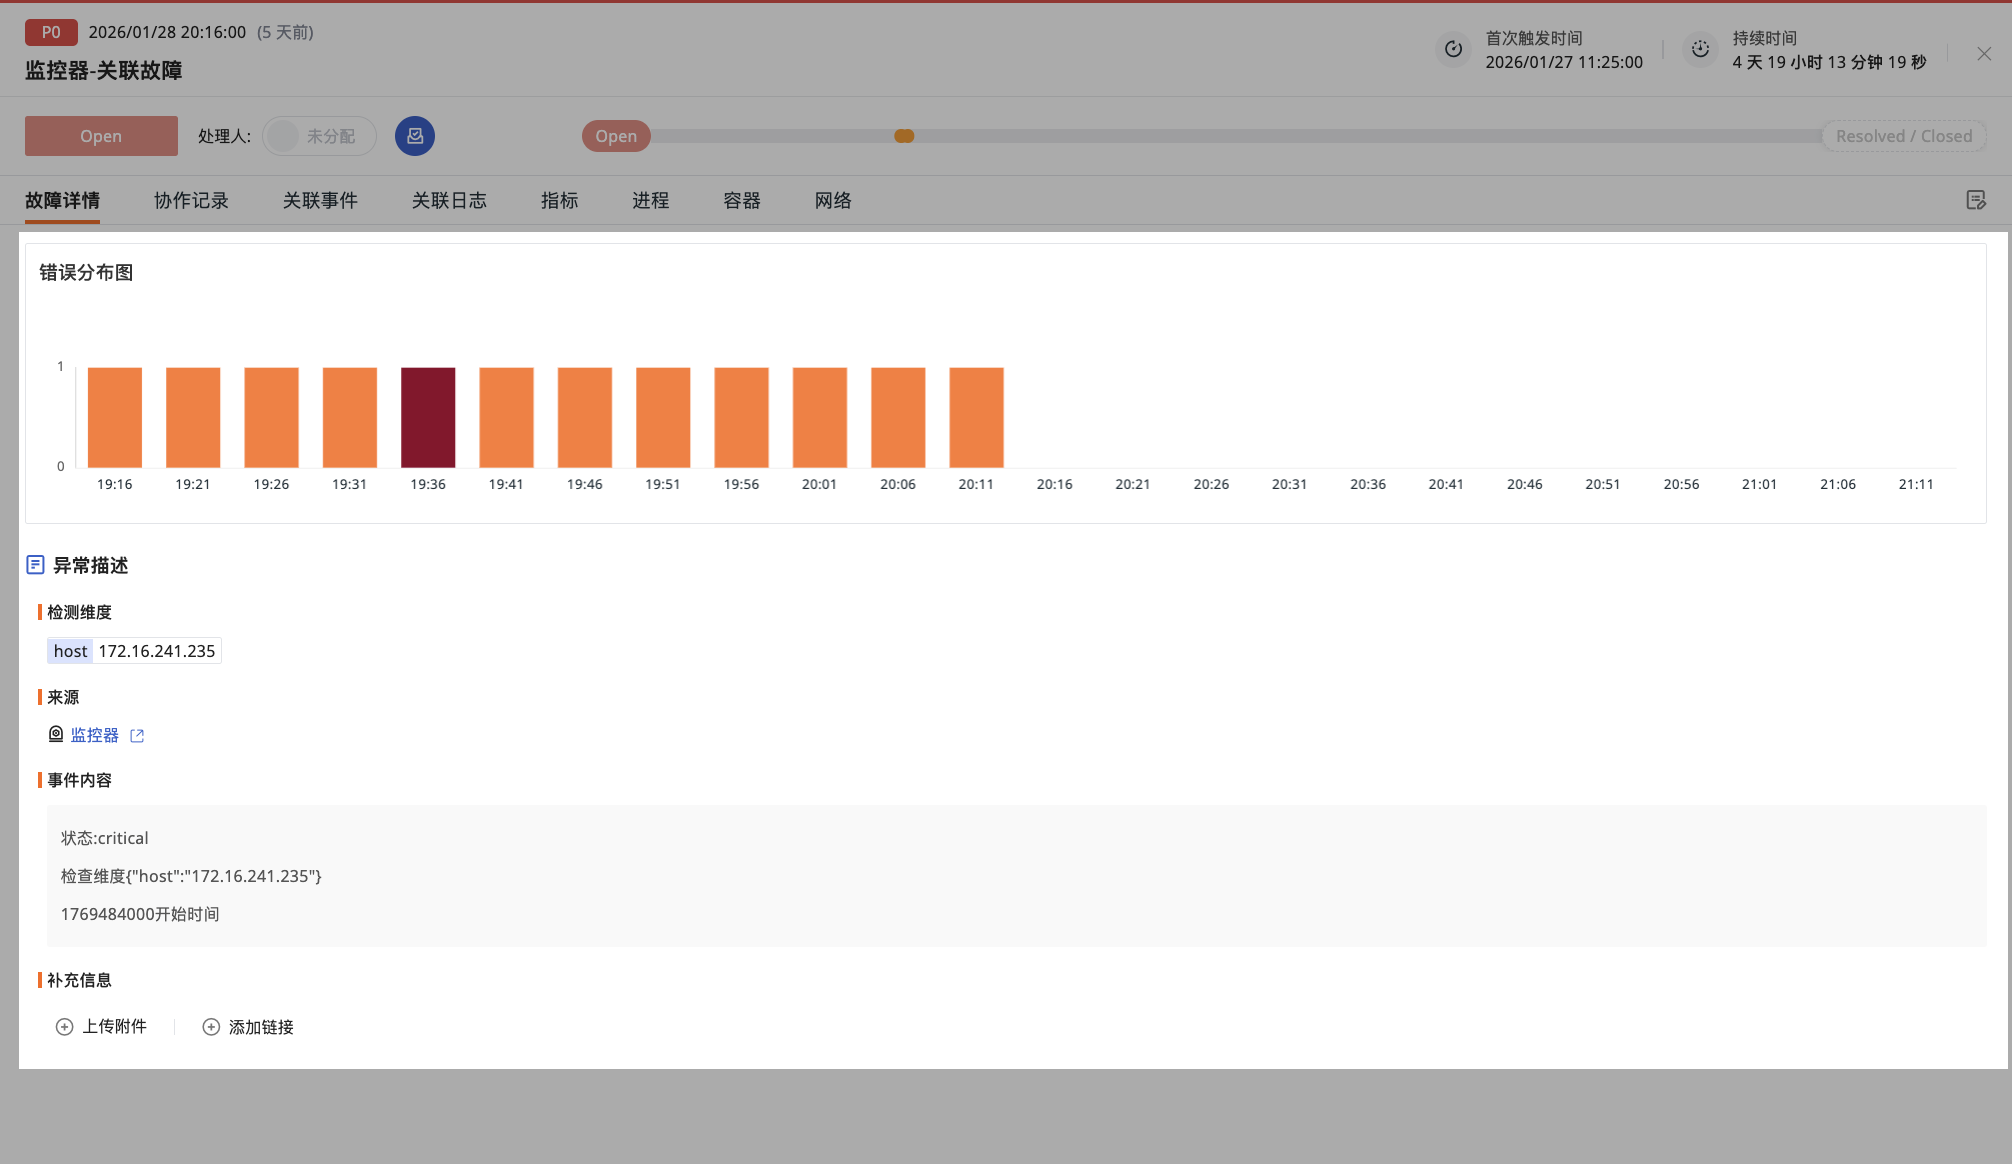
Error Distribution Chart
Displays a bar chart of error distribution for this incident dimension over the last 1 hour. Clicking a bar carries the current filter conditions to jump to the Log Explorer or Tracing Explorer for further analysis.
Anomaly Description
The anomaly description area consolidates the raw information generated by the incident:
-
Detection dimensions: Displays the detection dimensions associated with the incident, such as host:192.168.1.1 or service:auth, to quickly locate affected objects;
-
Source: Indicates the specific Monitor or Smart Monitoring rule that triggered this incident, making it easy to trace the alert source;
-
Event content: Displays the original alert content, usually the specific information recorded when the Monitor detects an anomaly, such as raw log text or metric values;
-
Detection metrics: Displays the DQL query statement for the trigger condition, which you can reference directly to understand the detection logic;
-
Description: You can manually enter text here to add supplementary notes about the incident for team understanding;
-
Additional information: Extra context added by the system or users, such as associated change records, ticket links, and so on.
Operation Records
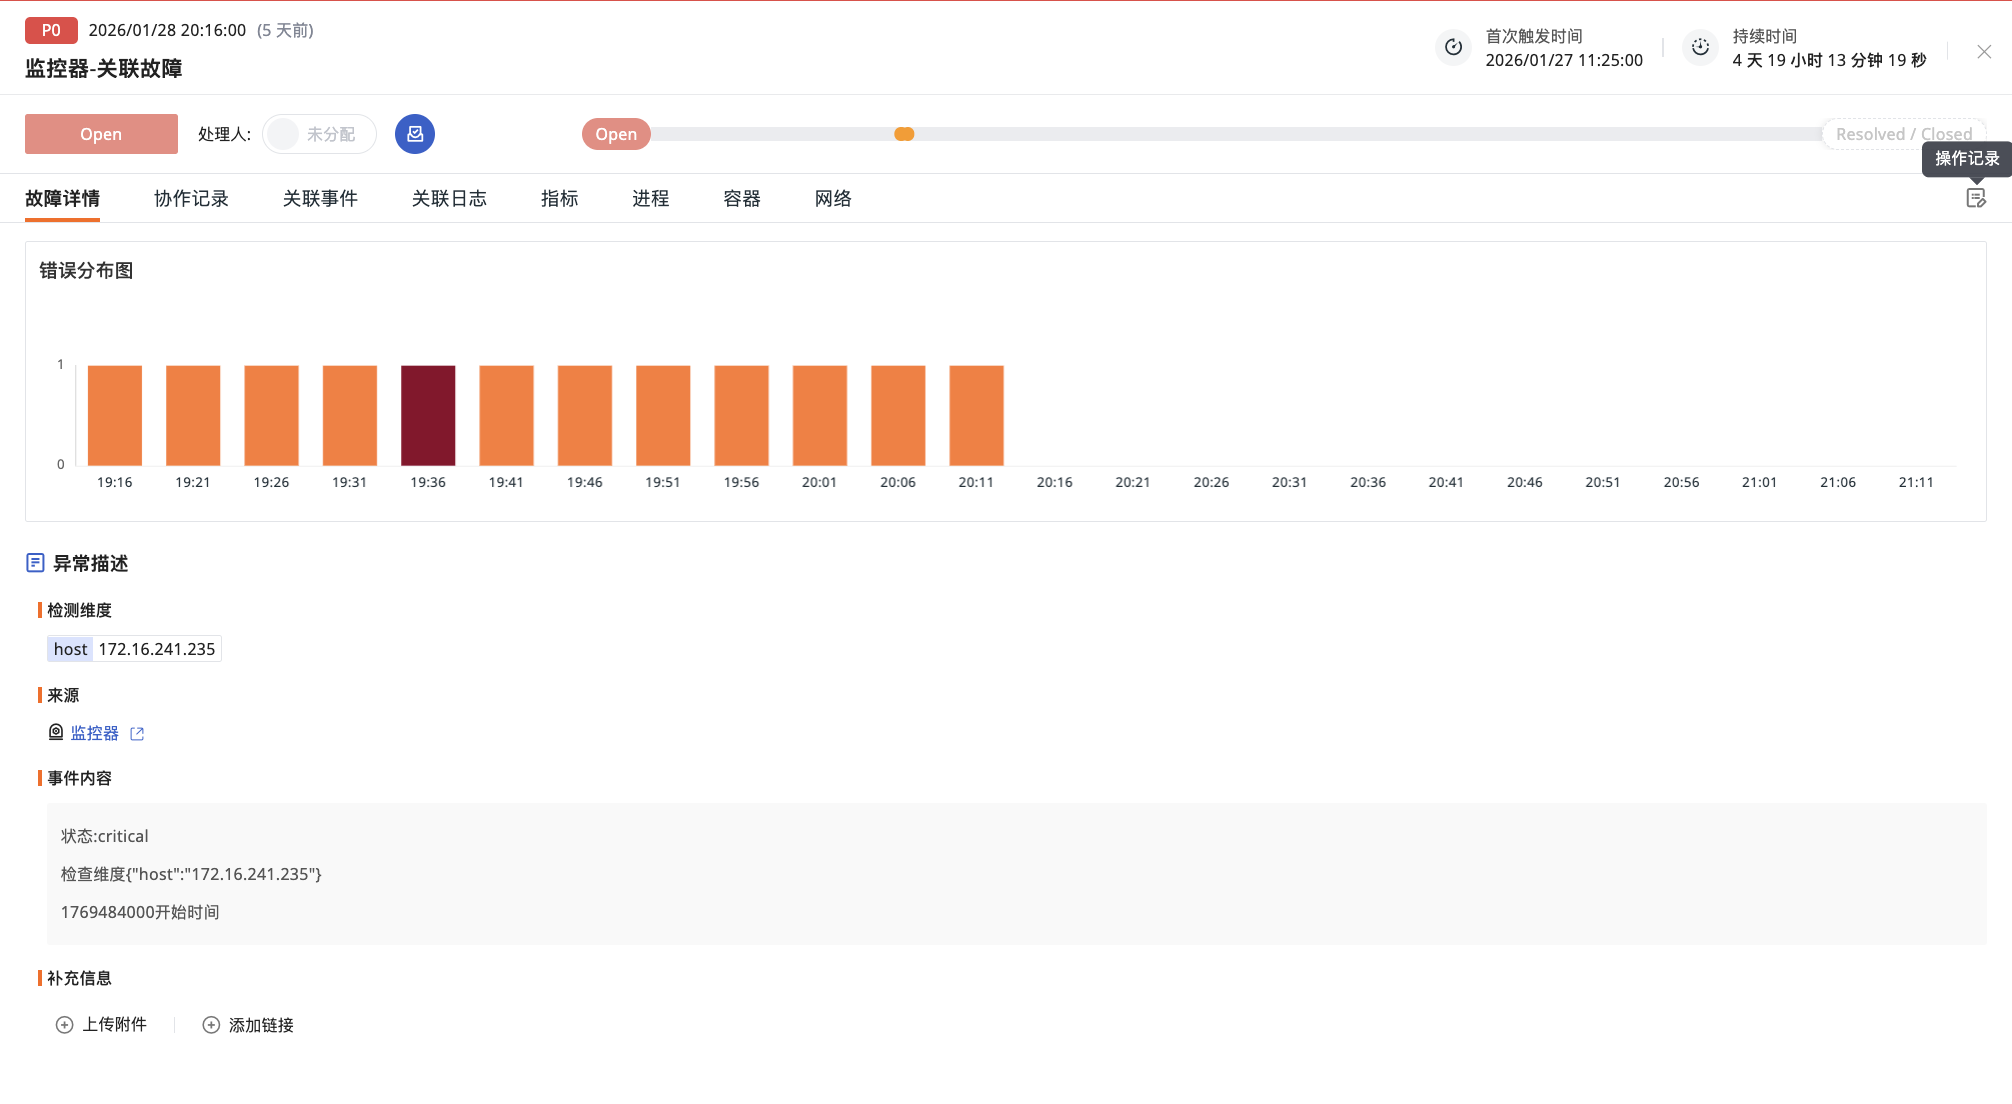
In the "Operation Records" entry, you can view the complete handling trail of the incident. The system displays all key operations in reverse chronological order, including incident triggering, status changes, severity adjustments, assignee handoffs, and escalation notification executions, helping you stay informed of the latest progress and trace the complete handling process.
Hide Bot Operations
Hide Bot Operations is disabled by default, and the operation records display both member operations and bot operations. After enabling it, only bot operations are hidden, and the order of member operations remains unchanged; after disabling it, loaded bot operations are restored immediately.
When you reopen the operation records for the same incident, the current switch state is retained; after switching to another incident, the switch returns to disabled.
Note
Hide Bot Operations applies only to the Incident Center. The operation records of the Incident feature do not display this toggle.
Collaboration Records
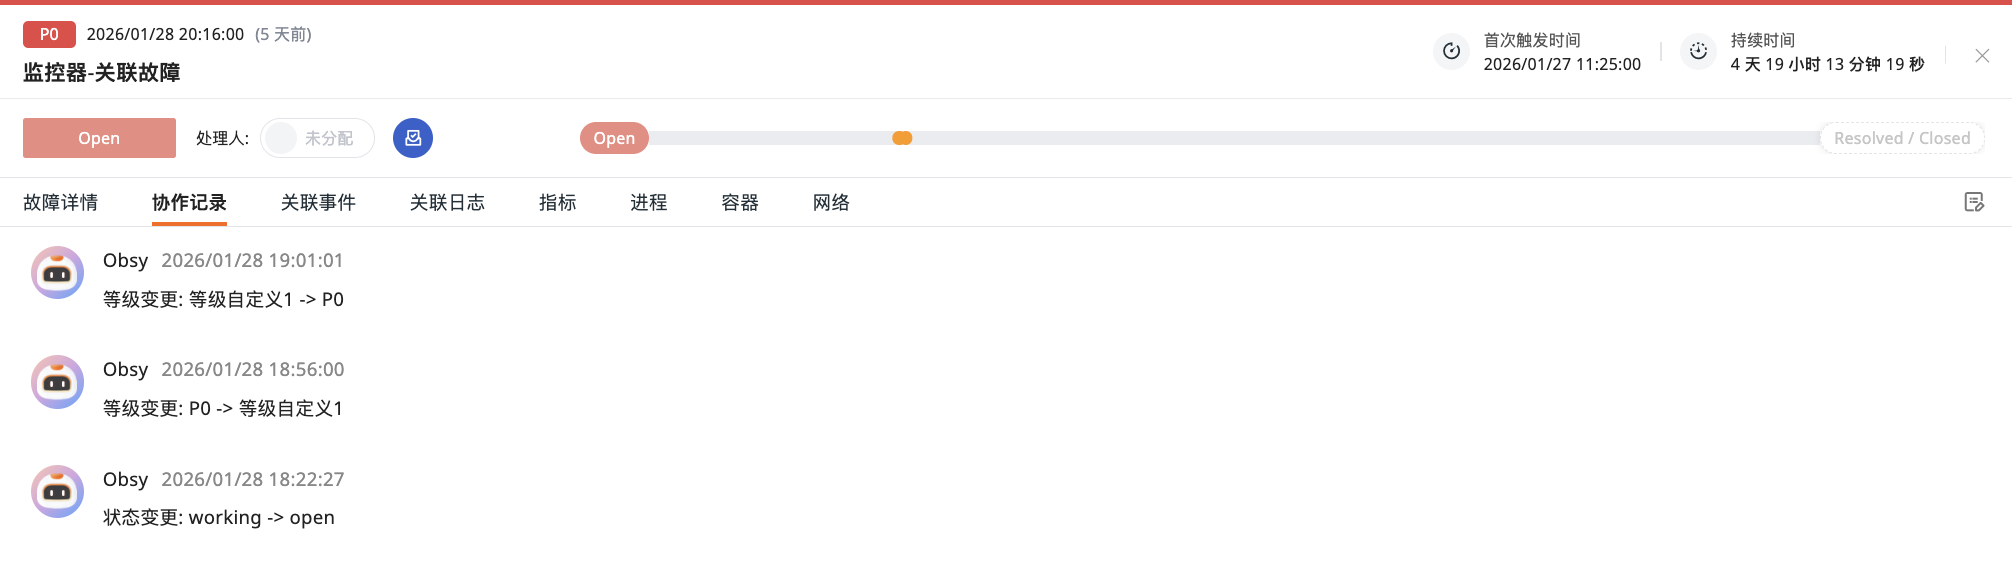
You can collaborate with your team using the comment feature at the bottom of the current details page, which supports adding text, links, or uploading attachments.
All collaboration content is consolidated in the collaboration records section. The system automatically records the complete operation log, including incident triggering, status changes, Operation Records, assignee adjustments, and escalation notifications, forming a clear audit trail for subsequent tracking and review.
Hide Bot Messages
Hide Bot Messages is disabled by default, and the collaboration records display member messages, bot notifications, and bot AI analysis at the same time. After enabling it, only member messages are shown; after disabling it, loaded bot messages are restored immediately.
If there are still historical records after filtering, click Load More to continue viewing. When you re-enter the incident details, this switch returns to disabled.
Note
The two hide toggles only adjust the record display on the current page and do not delete or modify the original records.
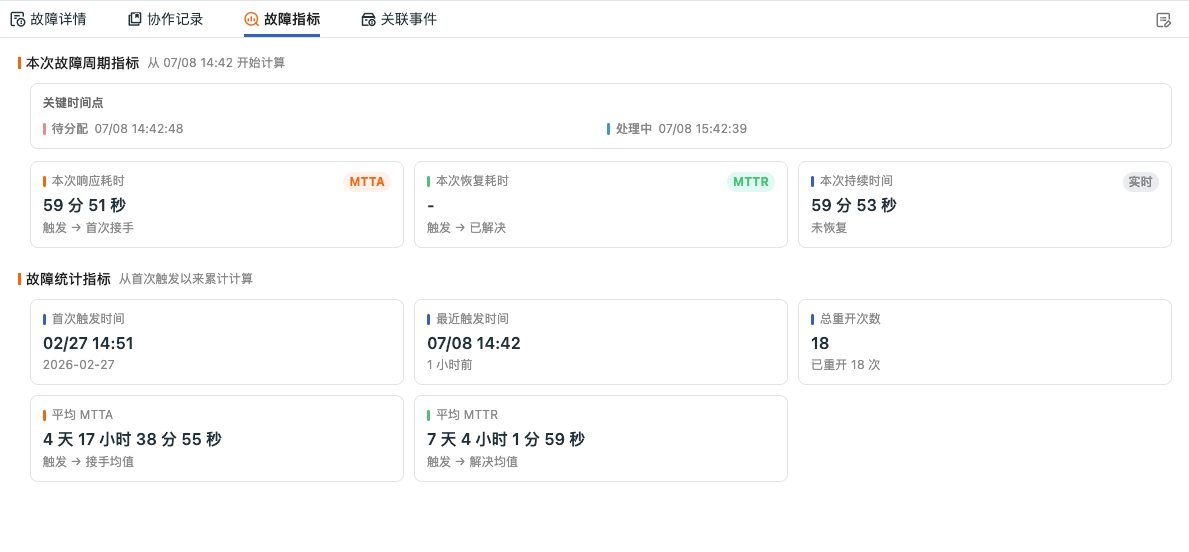
Incident Metrics
On the current details page, you can view the periodic and cumulative data of the incident in the section below, divided into two blocks:
- Current Incident Period Metrics: Displays the timeline of the current period (Triggered / Assigned / Recovered / Closed) and three core metrics: current response time (MTTA), current recovery time (MTTR), and current duration;
- Incident Statistics Metrics: Displays the first trigger time, latest trigger time, total reopen count, average MTTA, and average MTTR, calculated cumulatively since the first trigger.
After the incident is reopened, the current period metrics only show the latest period data, while the statistics metrics continue to accumulate and update.
Related Events
In the "Related Events" tab on the incident details page, the system displays all monitoring events related to this incident. These events are automatically associated based on the same detection dimensions, and by default show data from the last 2 hours before and after the incident.
You can view the following here:
- The occurrence time, source, and specific content of events
- The detection metrics and description information associated with events
- The distribution of events (presented visually through a time bar chart)
Clicking any event or a time range in the distribution chart carries the current filter conditions to jump to the corresponding analysis page, where you can further view detailed logs, metric trends, or tracing information to help locate the root cause of the incident or assess the impact scope.
Related Data Analysis
Based on the incident's detection dimensions (such as service, host, app_name), the system automatically loads the corresponding analysis tools without requiring manual navigation:
- If the detection dimension includes
service: displays associated Distributed Tracing, Service Map, Related Logs, Analysis Dashboard, and so on; - If the detection dimension includes
host: displays built-in views such as Metrics, Logs, Process, Containers, Network; - If the detection dimension includes
app_name: displays related RUM Errors and Analysis Dashboard (depending on the application type); - Other dimensions: displays the corresponding built-in views based on the actual situation.
All data views focus by default on the last 2 hours before and after the incident. You can quickly understand the impact through the distribution chart and click to jump to the corresponding page for in-depth analysis.
Further Reading
You may also be interested in the following: