Error Center
Guance Error Center is a full-stack solution designed to help teams systematically track and manage application errors. It automatically aggregates error information from performance monitoring, user access, and logs, categorizing massive amounts of discrete error reports into manageable tasks and providing a complete analysis and handling workflow.
| ❌ Pain Points of Traditional Error Monitoring | ✅ Solutions from the Error Center |
|---|---|
| Errors with the same root cause are scattered into thousands of independent alerts due to variables (e.g., UUID, timestamps) | Aggregates identical logical errors into a single Issue using a fingerprint algorithm |
| Error information is isolated, lacking associated traces, user sessions, logs, and infrastructure context | Automatically correlates trace data, user sessions, logs, and metrics to provide complete context |
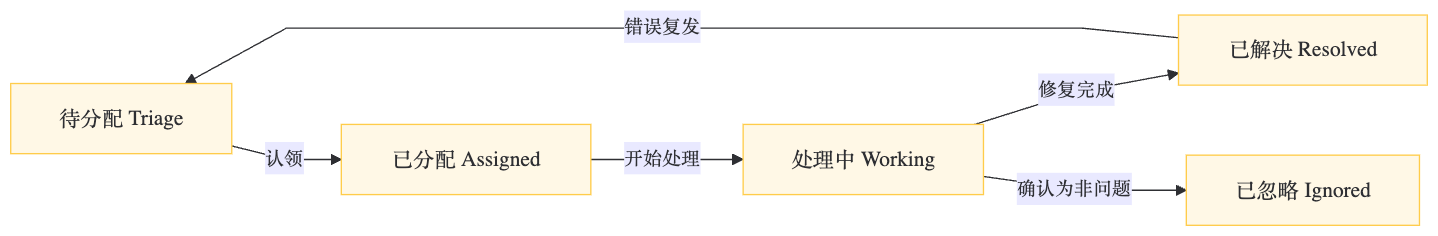
| Error handling status is opaque, leading to low team collaboration efficiency | Standardizes the error lifecycle (Triage → Assigned → Resolved), supporting team collaboration |
Core Concepts
Error
Refers to an abnormal event unit identified from APM, RUM, and logs, containing three essential elements: error type, error message, and error stack.
Generally includes the following error information from three types of data sources:
-
Application Performance Monitoring (APM): Captures exceptions and errors on the server side, reflecting the health status of service operation, typically including complete service call stacks.
-
Real User Monitoring (RUM): Collects errors occurring in frontend applications on user devices, directly reflecting user experience, and can map back to specific locations in the source code via SourceMap.
-
Logs: Cover error information recorded by the system or application itself.
Error Issue
The system uses an intelligent fingerprint algorithm to aggregate multiple error reports (Errors) with the same root cause into a unique Error Issue (problem unit). Each Issue has an independent lifecycle status, following a standard flow from "To be assigned (Triage)" to "Resolved (Resolved)", and is associated with complete analysis context (including performance traces, user sessions, source code mapping, and log metrics).
Error Delivery Logic
The Error Center employs an Intelligent Aggregation Mechanism for unified management of error data. The system only processes error data that can generate a unique identifier (issue_id). This identifier is generated by combining the error fingerprint and service context, ensuring continuous tracking of the same error.
Error Aggregation Mechanism
The system implements intelligent error aggregation through the following steps:
1. Error Fingerprint Generation
a. The system generates a unique fingerprint identifier (fingerprint) for each error:
| Data Source | Fingerprint Calculation Fields | Description |
|---|---|---|
| APM | error_type + error_message + error_stack |
Combination of error type, error message, and error stack |
| RUM | error_type + error_message + error_stack |
Combination of error type, error message, and error stack |
Logs (with error_stack) |
error_type + error_message + error_stack |
Combination of error type, error message, and error stack |
Logs (without error_stack) |
error_type + error_message |
Combination of error type and error message |
b. Data Integrity Requirements:
The generation of an error fingerprint is based on data integrity. APM, RUM, and Logs data must contain fields at the above paths to generate a fingerprint; if fields are missing, that piece of data is skipped.
c. Standardization Processing:
-
Before calculating the fingerprint, the system performs standardization processing, automatically identifying and filtering variable content (such as timestamps, user IDs, UUIDs, etc.) in the error message (
error_message), ensuring consistent fingerprints for identical logical errors. -
Stack information (
error_stack) undergoes optimization processing, retaining only key business call lines and filtering out framework internal calls and third-party library calls. -
The system strictly validates field integrity; data missing required fields will be excluded.
2. Error Issue Identifier (Issue ID Generation)
a. Based on the error fingerprint, the system combines the context in which the error occurred to generate a unique issue identifier (issue_id), used for tracking and managing that issue within the Error Center. The specific generation logic is as follows:
- APM Errors:
service+fingerprint(Service name + fingerprint) - RUM Errors:
app_name+fingerprint(Application name + fingerprint) - Log Errors:
service+fingerprint(Service name + fingerprint)
b. Lifecycle Initiation:
When the system first generates a new issue_id for a particular error combination, it automatically records the first occurrence time of that issue in the workspace and begins full lifecycle status tracking and aggregated analysis for it.
3. Error Data Storage
| Property | Configuration | Description |
|---|---|---|
| Storage Location | Independent namespace | Stored separately from original APM, RUM, and log data |
| Retention Period | Default 90 days | Custom modification is not currently supported |
| Daily Limit | 10,000 new Issues per day | Maximum number of new error issues per workspace per day |
| Handling of Excess | Discard excess | New errors beyond the 10,000 limit will not be recorded |
Typical Use Cases
Use Case 1: Backend Service Exception Aggregation
An e-commerce platform's order service generates tens of thousands of NullPointerException errors during a promotion period. Traditionally, these are scattered into alerts due to containing different order IDs.
Solution:
- Configure an APM error rule to monitor the order-service.
- The Error Center automatically extracts fingerprints, aggregating exceptions from the same code location into a single Issue.
- The development team only needs to address one root cause issue; after fixing it, all related alerts disappear.
👆🏻 Transition from "alert storms" to "precise localization", significantly improving handling efficiency.
Use Case 2: Frontend Error Tracing
Users report occasional white screens on the checkout page, but the issue cannot be reproduced. Traditional logs lack client-side context.
Solution:
- Configure a RUM error rule to collect Web application errors.
- Filter the error list by RUM and application type, then enter the details page.
- View "Session Replay" to reconstruct the user's operation path: click coupon → parsing failure → white screen.
- Examine the error stack; SourceMap automatically maps to line 42 of the source code, the JSON parsing logic.
👆🏻 Transition from "unreproducible" to "second-level localization", reducing the user experience issue resolution cycle from days to hours.
Use Case 3: Log Exception Correlation Analysis
Application logs frequently show "Connection Timeout", but it's unclear whether it's a network issue or a downstream service problem.
Solution:
- Configure a log error rule to collect logs containing
error_type:DBError. - In the error details page, view "Correlated Traces". The trace error details show the timeout occurred during the
payment-servicecall. - Check "Infrastructure Dependencies" to confirm that the database connection pool monitoring shows connection exhaustion.
- Root cause identified: Insufficient thread pool configuration in the downstream payment service, not a network issue.
👆🏻 Transition from "surface phenomenon" to "root cause localization", avoiding misjudgments leading to ineffective optimizations.
Getting Started
Prerequisites
Before you begin, please ensure your data is already connected to Guance:
- APM: Services are connected and reporting
tracedata. - RUM: Web or other applications have the SDK integrated.
- Logs: Logs are indexed and contain error fields.
Start Configuration
The Error Center operates in a configuration-driven manner.

- Before use, you need to create an error delivery rule to explicitly specify the data scope to monitor (specific log indexes, APM services, or RUM applications).
- After configuration, the system will only perform intelligent analysis and aggregation processing on errors generated from these selected data sources. You can go to the Error List to view and manage aggregated error Issues, filtering by status, source, etc.
- You can further analyze Error Details, delving into individual errors, and correlating traces, logs, and sessions for root cause analysis.