Performance Metrics
On the Performance Metrics page, you can quickly filter service performance based on service type, environment, version, project, and service name, enabling rapid identification and viewing of a service's average request count, average response time, P75 response time, P99 response time, maximum response time, error count, Apdex satisfaction, and associated monitors.
Add Service
Manage Performance Metrics
You can perform the following operations for management:
-
Use the Time Widget to select a time range and view the corresponding performance data.
-
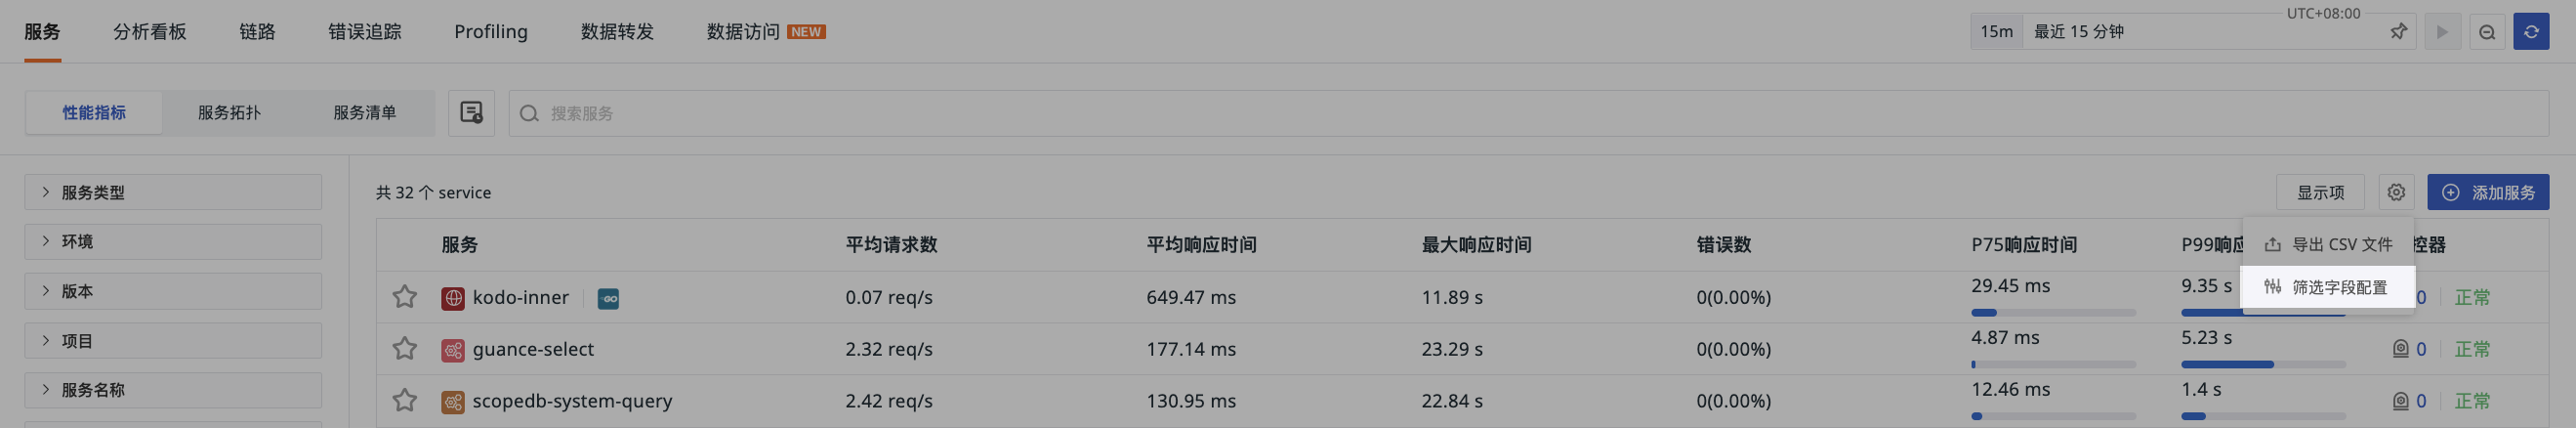
Choose the display items for the current list, including Service, Language, Total Requests, Average Request Count, Average Response Time, P75 Response Time, P99 Response Time, Maximum Response Time, Error Count, Apdex Satisfaction, Team, and Monitor.
-
Export the current list as a CSV file.
-
Hover over a single service entry:
-
Click to jump to the Trace Details page. Clicking directly on a service entry will take you directly to that service's analysis dashboard.
-
If the monitor's tag is the current service, you can click to jump to the corresponding monitor configuration page.
-
You can view the event status. Clicking on the status will open a new page and jump to the Incident Explorer page.
-
Notes on Event Status
- Service statuses include Normal, Critical, Important, and Data Gap. It displays the status of the last unrecovered event within the last 60 days for that service. If none exists, it shows "Normal".
- This only includes services that have trace data reported.
Custom Filter Configuration
In addition to the system default filter fields (service, env, version, project, name), you can customize up to 5 fields as service filter fields (❗️Newly added fields only take effect for new data).
- Go to the Performance Metrics page.
- Click the "Settings" button.
- Start adding fields.
- Save.
Configuration Permissions
Only members with the "Service Management" configuration permission can configure this.