Error Details
The Error Details page provides a comprehensive analysis workspace for a single error. In the Error List, click on a single error data entry to enter its details page.
Top Information
At the top of the details page, the core information of the error is displayed, including the service (APM/LOG) or application name (RUM) corresponding to the current error, the last trigger time, the error type and description, etc.
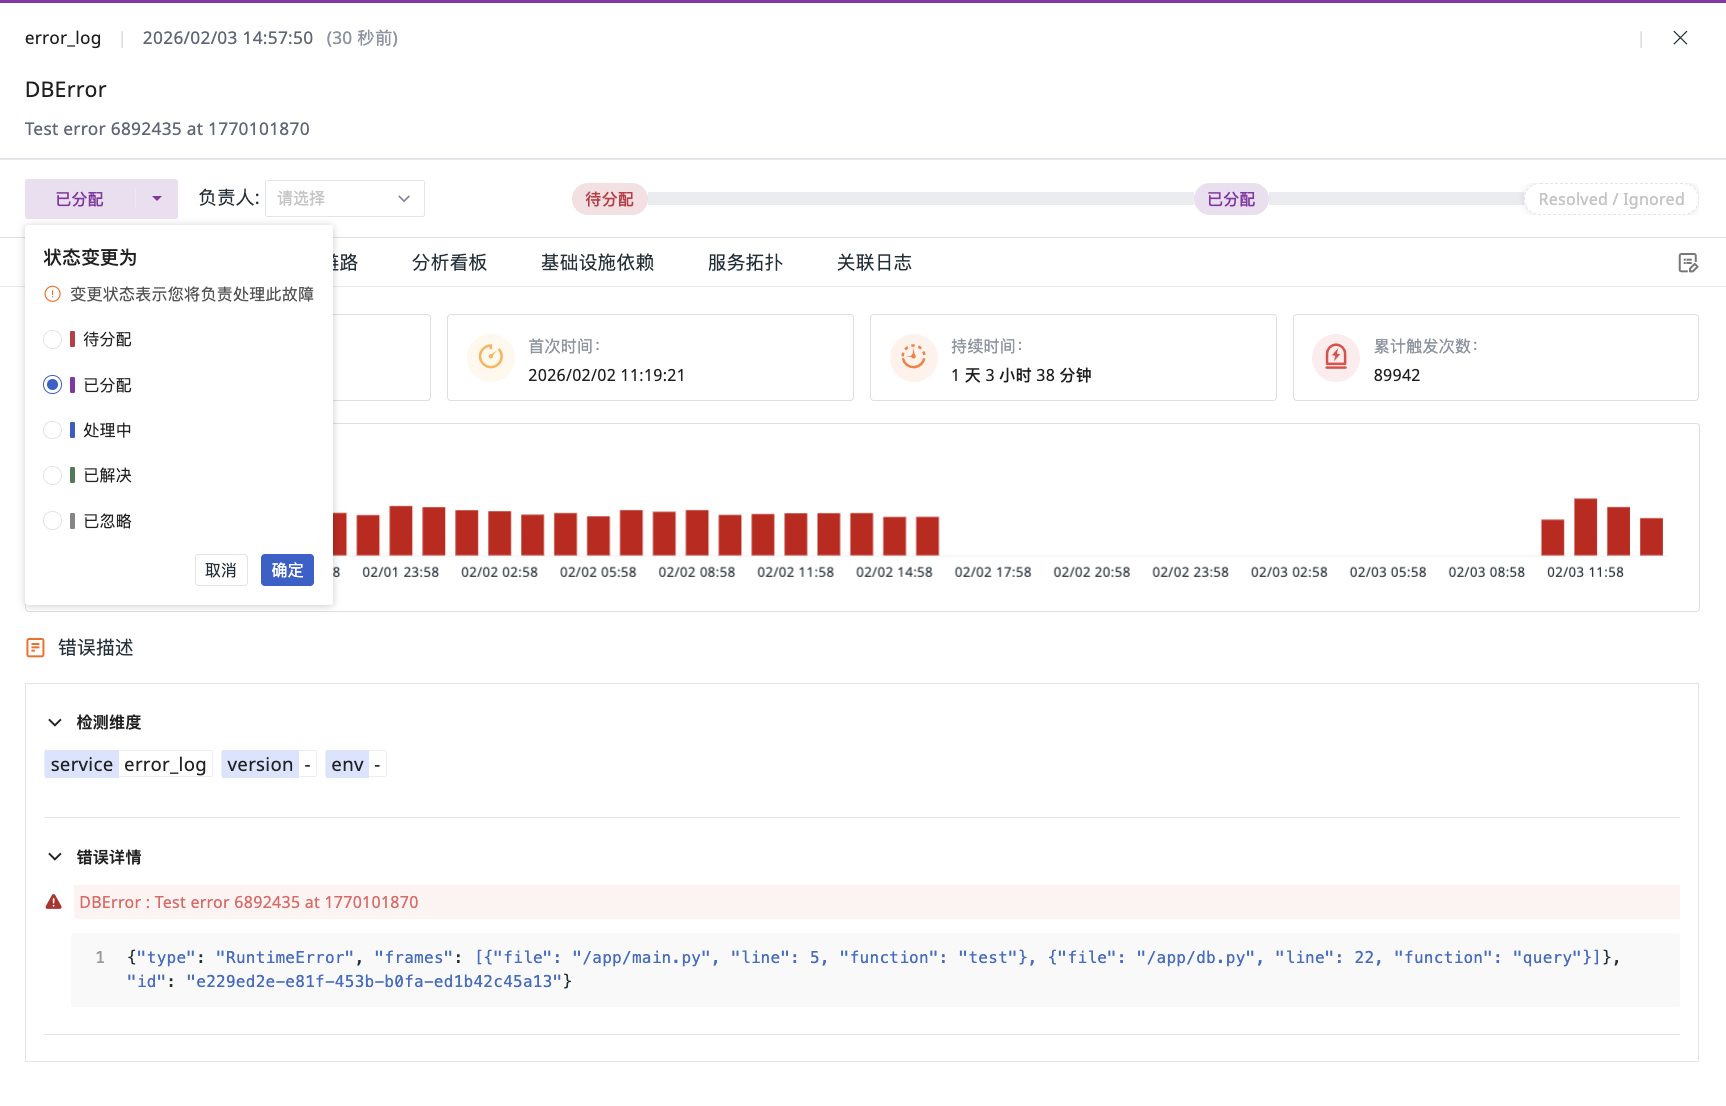
Status Flow Operations
On the top left of the details page, the current processing status of the error is displayed, including:
- Unassigned
- Assigned
- In Progress
- Resolved
- Ignored
Claim Error
Errors adopt a user-initiated claim mechanism. When a user claims an error, its status is automatically updated from "Unassigned" to "Assigned", and the claimant becomes the responsible person for that error, overseeing subsequent analysis and handling. All key milestones in the handling process, including status changes, assignee assignments, note additions, etc., are clearly presented in the progress timeline on the right, providing a complete record of the error's entire flow from discovery to resolution.
Note
Only the responsible person or administrators can change the error status.
Error Details
Error Details provides you with the core context and in-depth insights of the error, containing the following key analysis modules.
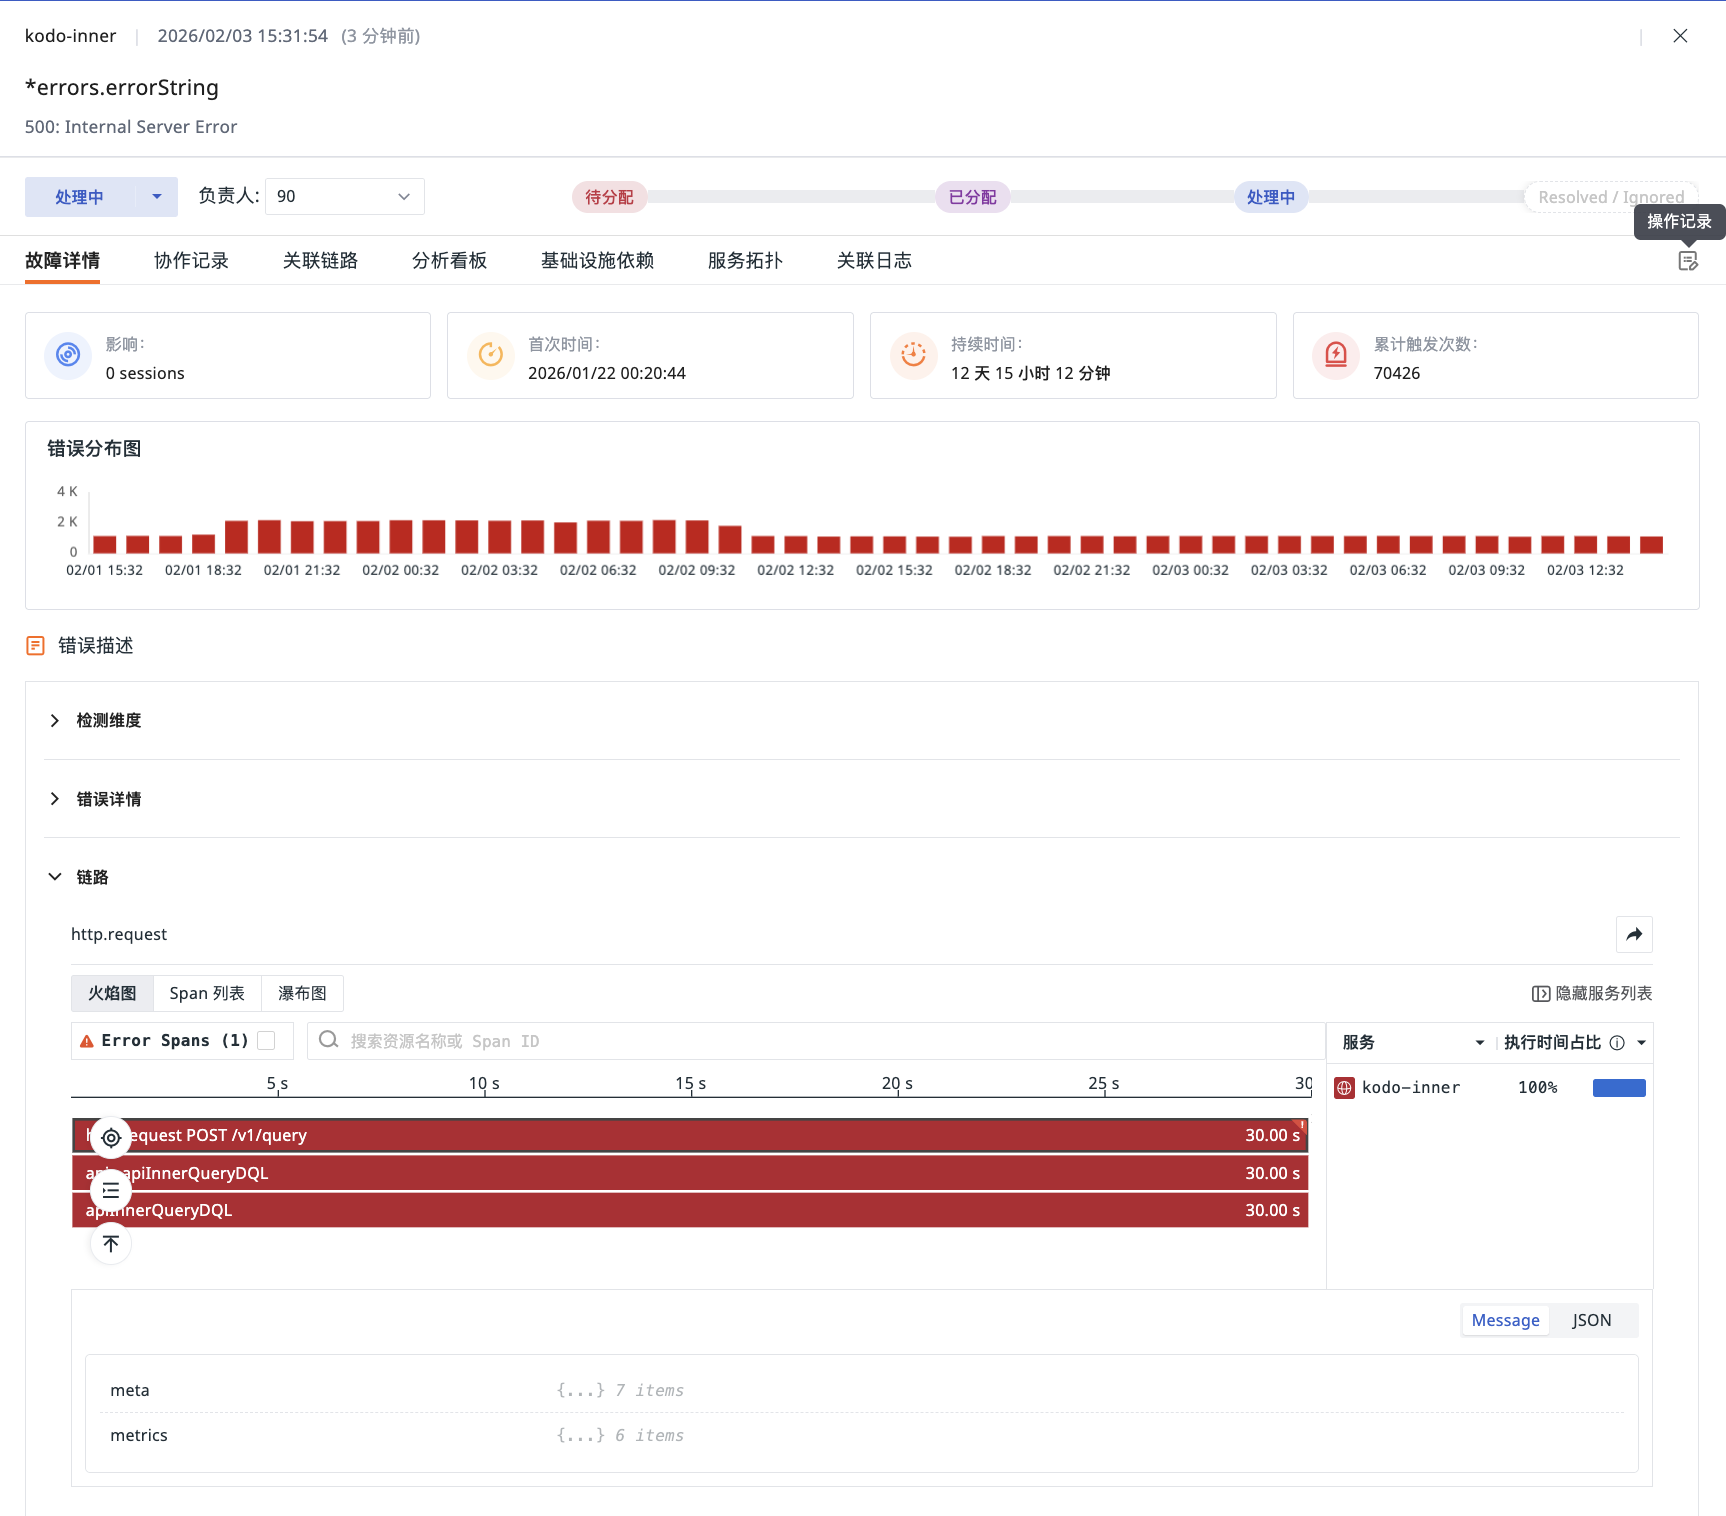
Error Distribution Chart
The Error Distribution Chart is based on the occurrence time of the most recent error and the time range selected on the page, showing the trend of this issue within that period.
Above the distribution chart, key information such as impact statistics, first occurrence time, duration, and cumulative trigger count is also provided.
Error Description
This area centrally displays detailed information about the selected error. Its content composition varies depending on the error source (APM/LOG/RUM).
Detection Dimensions
Displays the key identifying dimensions of the last error, used to locate the specific environment where the error occurred:
-
APM/LOG: Service (
service), Environment (env), Version (version) -
RUM: Application Name (
app_name), Environment (env), Version (version)
Error Details
Displays the core content of the last error:
-
APM/LOG: Error Message (
error_message) and Error Stack (error_stack) (LOG errors also includeerror_type) -
RUM: Error Message (
error_message) and Error Stack (error_stack)- If the error is associated with a Source Map, the system will automatically parse and map it to the source code location, supporting expanding and zooming to view the complete stack information
Associated Context
Provides associated information for in-depth troubleshooting based on the error type and available data:
-
APM/LOG Errors
-
APM: If the error data includes a trace identifier (
trace_id), the system will further display complete call trace details:-
Flame Graph: Visualizes method call stacks and time consumption distribution
-
Span List: Lists all call units in the trace and their detailed information
-
Waterfall Chart: Displays the sequence and duration of each call in chronological order
-
Details Panel: Click on any call unit to view its detailed attributes, logs, and context information
-
-
Associated Logs: If the
servicedimension is included, displays the error log list for that service within 2 hours before and after the failure occurrence
-
-
RUM Errors
-
Session Details: Displays the user session details that triggered the error, including basic session information and a session replay thumbnail. Clicking the thumbnail plays the complete operation recording in a side-sliding overlay on the current page, recreating the real user scenario when the error occurred
-
Session Event List: Displays all interaction events in that user session, showing the user's operation sequence in chronological order to help understand the complete operation path before the error occurred
-
Operation Records
In the Error Details page, you can fully track the entire handling history of the error issue through "Operation Records", which includes three key actions:
- Error Trigger Generation
- Status Change (e.g., from "Unassigned" to "In Progress")
- Responsible Person Change
All records are arranged in reverse chronological order of occurrence, making it easy for you to quickly understand the latest developments and the complete handling context of the error.
Collaboration Records
On the current details page, you can engage in team collaboration through the comment function at the bottom of the page, supporting adding text, links, or uploading attachments.
All collaboration content is aggregated into the Collaboration Records section. The system automatically records a complete operation log, including error triggers, status changes, Operation Records, responsible person adjustments, and escalation notifications, forming a clear audit trail for subsequent tracking and review.
Associated Views
The Error Details page provides targeted associated analysis based on the error source (APM/RUM/LOG). All analysis data is based on the most recent error occurrence time, defaulting to show the associated context from the last 2 hours. This specifically includes comprehensive views such as associated traces, analysis dashboards, infrastructure dependencies, service maps, and associated logs.
Further Reading
You might also be interested in: