Synthetic Tests Explorer
Synthetic Tests provides comprehensive data details for testing tasks through the Explorer, covering performance test results such as DNS, SSL, TTFB for network sites, as well as response details and failure reasons for failed tests.
Query and Analysis
For more details, refer to Explorer Settings.
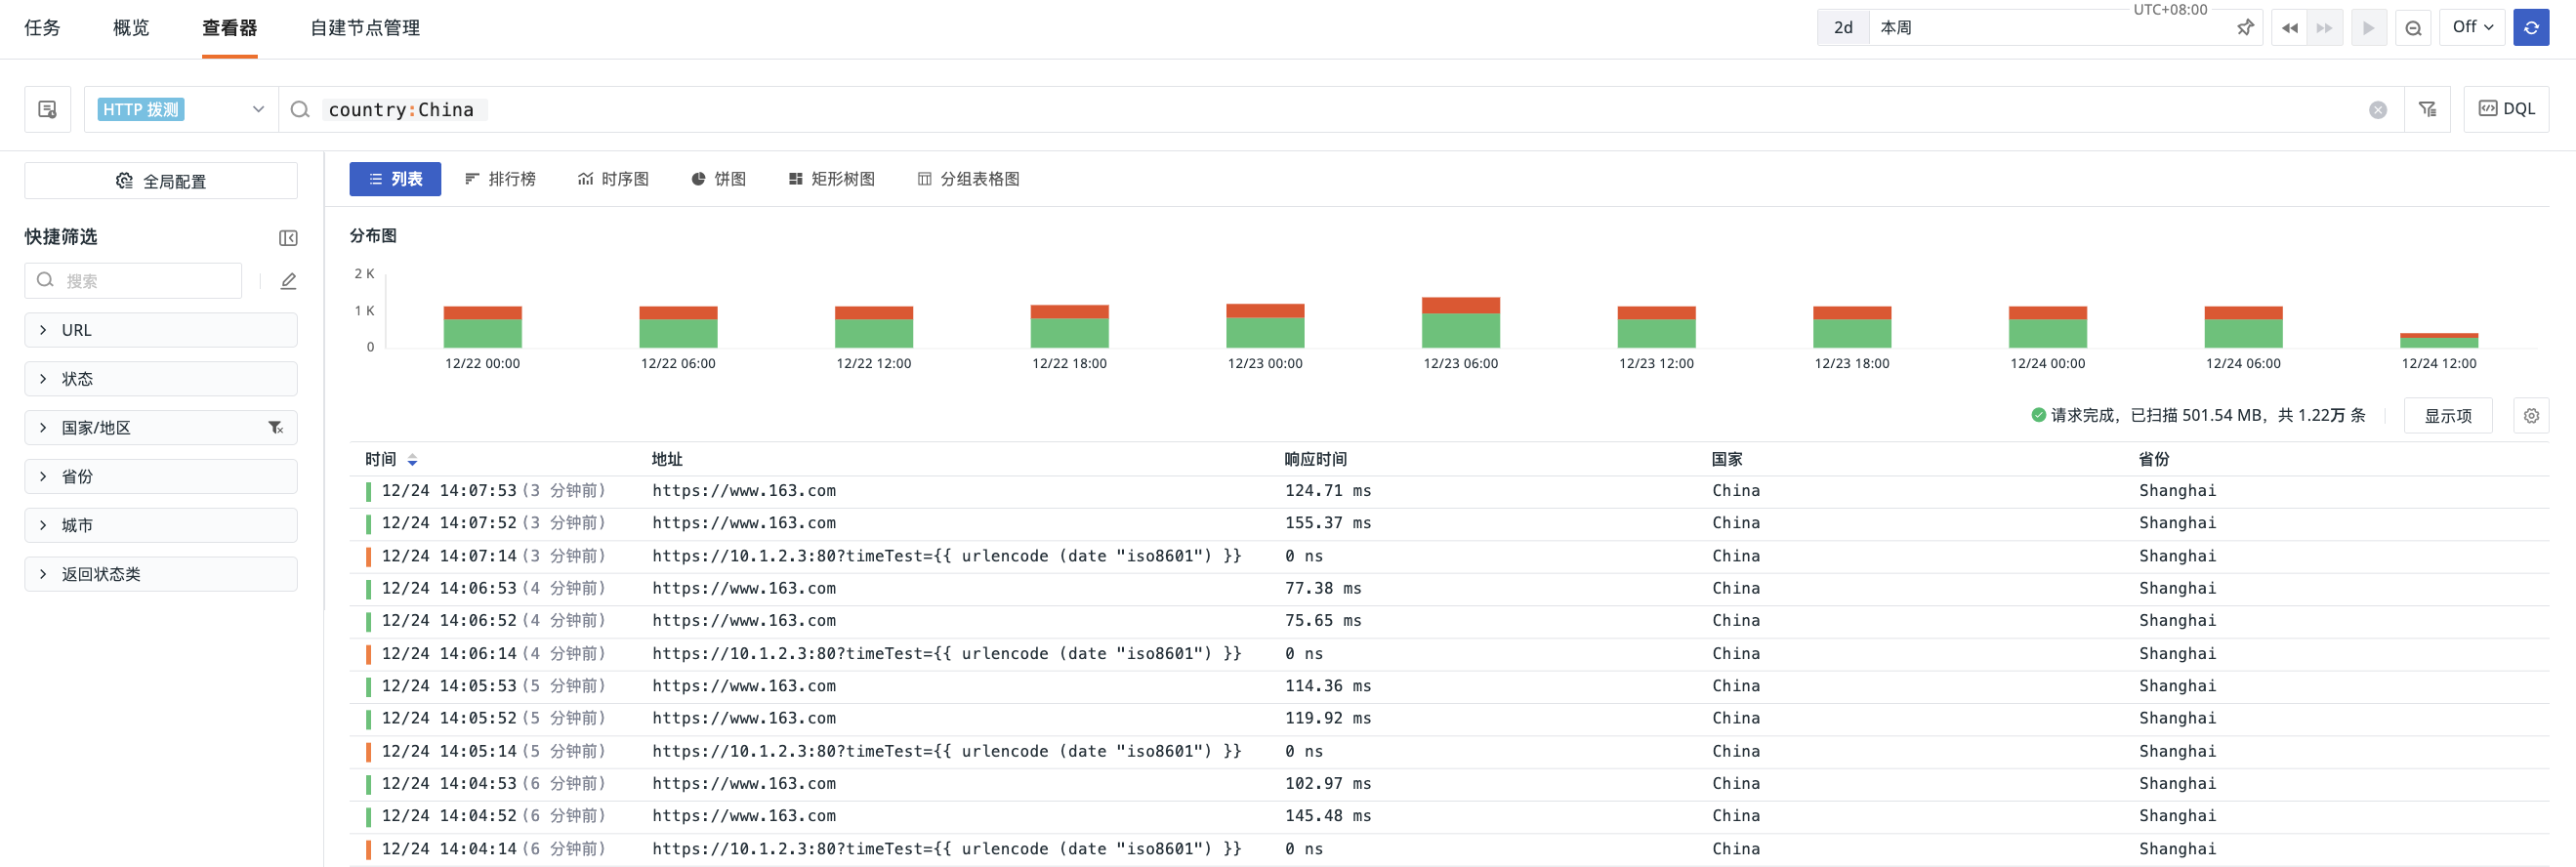
Distribution Chart
Guance counts the number of testing data within specific time periods based on the selected time range. Using stacked bar charts, you can visually see the number of testing data in different states across various time periods.
Different data types correspond to different data states. For example, the states of http (API Tests) data include:
OK: Indicates a successful requestFAIL: Indicates a failed request
Data Export
After filtering the data to be analyzed in the Explorer list, you can choose to export it as a local CSV file, or to a scenario dashboard or notebook.
To export a specific piece of data, open its detail page and click the icon in the upper right corner to export it.