Generate Metrics
On the Metrics > Generate Metrics page, you can create new metrics from existing data in the current workspace, or view the streaming aggregations registered by dashboards and their sources in the Query Acceleration List.
Prerequisites
-
On the Generate Metrics tab, only roles with the "Generate Metrics Configuration Management" permission can create and edit metrics.
-
After metrics are generated, they are stored according to the default data retention policy, and you are billed based on the number of time series generated.
-
If no data is reported after generating metrics, the metrics cannot be queried or analyzed in the workspace.
What Problems Can It Solve?
Scenario 1: Extract business metrics from logs
Business logs contain critical business data (e.g., order amounts, error codes) that need to be converted into monitorable metrics. With Generate Metrics, you can select a log data source, configure query conditions to filter target logs, extract fields to generate metrics (e.g., error log count, average response time), and group by business dimensions (e.g., service, endpoint, status code).
Scenario 2: APM data aggregation
Generate service SLA metrics based on APM trace data. Select an APM data source, group by service and endpoint, calculate P99 latency, error rate, throughput, etc., generate on a schedule, and monitor continuously.
Scenario 3: Resource usage statistics
Aggregate Kubernetes cluster resource usage. Select a basic object or resource catalog data source, group by cluster, namespace, or node, count Pods, resource requests/limits, etc., and generate resource utilization metrics.
Scenario 4: Multi-source data fusion
Combine multiple data sources to create composite metrics. Create separate generation rules, then generate new metrics from the generated metrics to build a complex business monitoring system.
Applicable Data Sources
Logs, APM, RUM, Metrics, Synthetic Monitoring, Basic Objects, Resource Catalog.
Create
- Select a data source;
- Configure data query conditions;
- Define the generated metric content, including the generation frequency, metric name, and measurement name.
Data Query
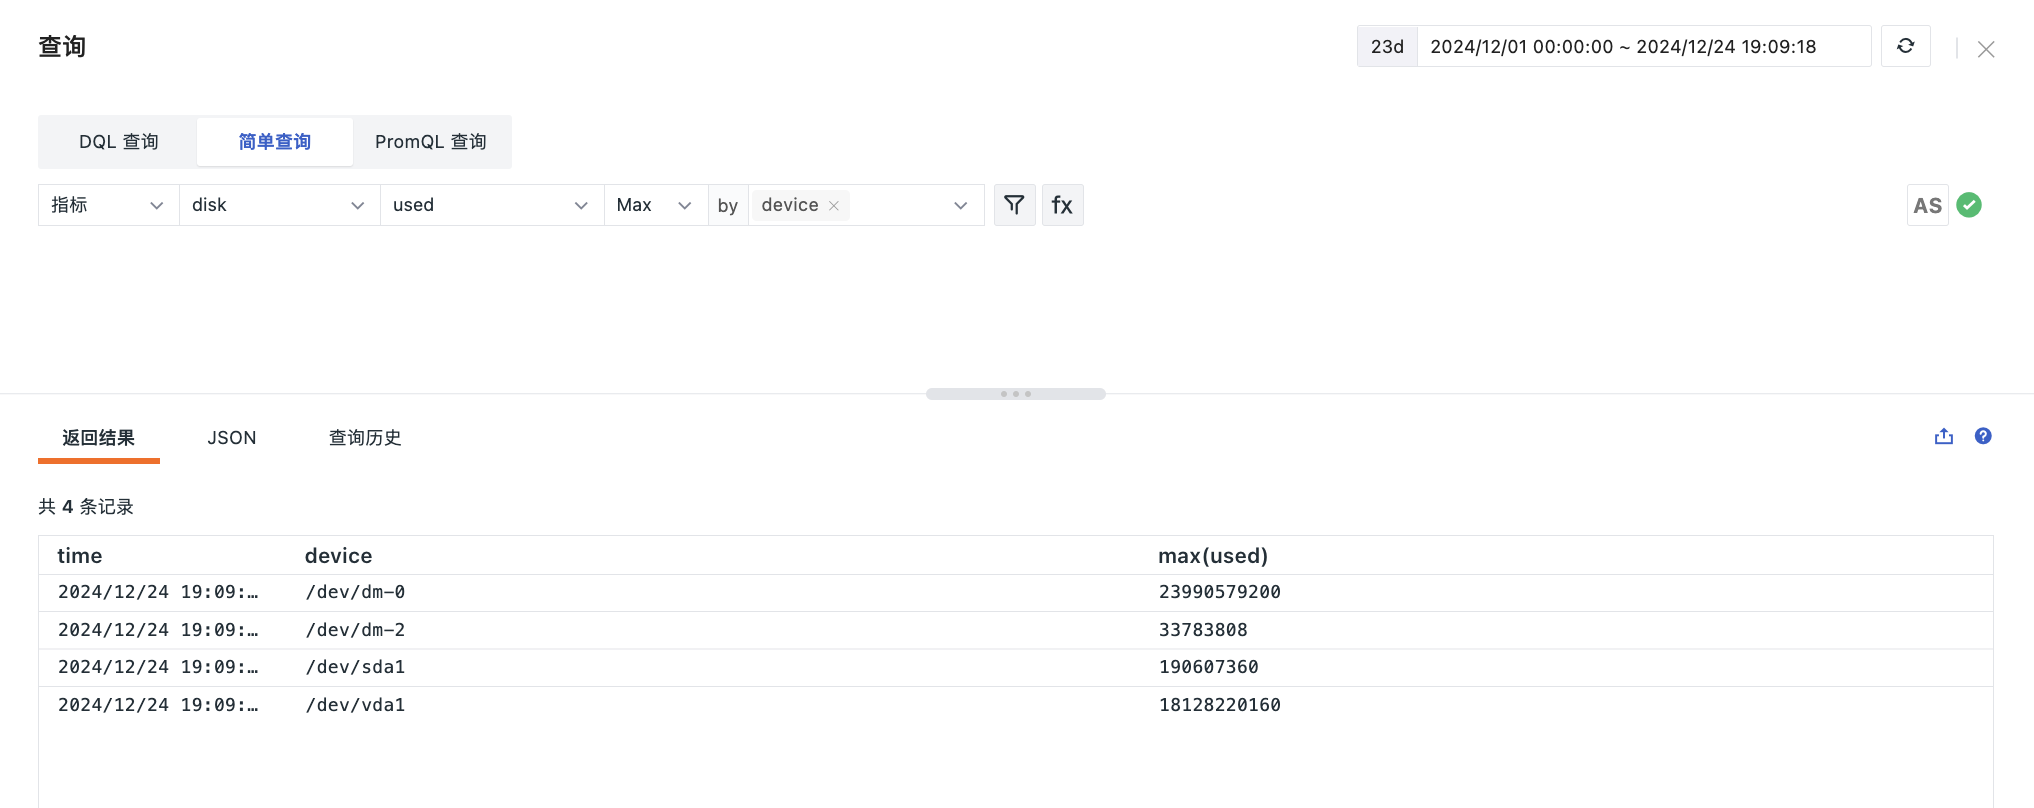
For metrics data, PromQL queries are additionally supported. For all other data types, both simple queries and DQL queries are supported.
For more details, see Chart Query.
Aggregation Functions
| Function | Description |
|---|---|
count |
Counts the number of records |
avg |
Calculates the average value. You must select a field to aggregate. |
max |
Calculates the maximum value. You must select a field to aggregate. |
min |
Calculates the minimum value. You must select a field to aggregate. |
P75 |
Calculates the 75th percentile of the specified field. You must select a field to aggregate. |
P95 |
Calculates the 95th percentile of the specified field. You must select a field to aggregate. |
P99 |
Calculates the 99th percentile of the specified field. You must select a field to aggregate. |
Dimensions
Aggregates data by the selected objects. A statistical value is generated for each selected object in the data request.
Generated Metric Content
-
Frequency: The execution interval for generating metrics. The selected frequency also serves as the aggregation window. For example, selecting 1 minute means a new metric is generated every 1 minute, and the aggregation time range is also 1 minute.
- 1 minute (default; generates new metric data every 1 minute)
- 5 minutes (selected by default when the data type is "Basic Object" or "Resource Catalog")
-
Select a data waiting window to specify how long the system waits after the task window ends before running the calculation.
-
Measurement: Sets the name of the measurement where the metric will be stored.
-
Metric: Sets the name of the metric. Duplicate metric names are allowed, and you can add multiple metrics.
-
Tags: Automatically generated based on the dimensions selected in the query.
-
Unit: Optional. Sets the unit of the metric. After a unit is set, it can be used in chart queries.
-
Description: Optional. Sets the description of the metric. After a description is set, it can be used in chart queries.
After completing the form, click OK to create the metric generation rule and start data collection.
Note
If data has a delay of more than 1 minute, it will not be counted after being written to the database.
Data Waiting Window
After the task window ends, the system continues to wait for data to arrive. Enable this to accommodate data reporting delays and improve metric accuracy.
When generating metrics, the system runs queries at the configured frequency (e.g., every 1 minute). Each query retrieves data for a fixed time range (the "task window"). However, due to delays between data generation and ingestion, some data may arrive after the task window ends, causing these "late" data points to be missed.
Enabling the data waiting window allows the system to wait an additional period after the task window ends, giving late-arriving data a chance to be included in the statistics, thereby improving accuracy.
1. Scenarios where the data waiting window is recommended:
| Scenario | Problem Description | Suggested Configuration |
|---|---|---|
| Long endpoint execution time | An endpoint takes 70 seconds to execute. The span's time is the start time, but the data arrives after the next task window, so it is never counted. |
Data waiting window ≥ maximum endpoint execution time |
| Network delay in data reporting | Average data latency from client to server is 10–30 seconds. Data for the latest time window is incomplete. | 1 minute |
| Batch reporting or network fluctuations | Some data is reported in batches or network is unstable, causing delays of several minutes. | 5 minutes or 15 minutes |
2. Calculation logic example (frequency 1 minute, data waiting window 1 minute):
Task execution time: 13:01:00
Task window (actual `time` range queried): 13:00:00 ~ 13:01:00
Data waiting window: 1 minute
Actual query execution time: 13:02:00 (after waiting 1 minute)
That is: the system executes the query at 13:02:00, retrieving data with time between 13:00:00 and 13:01:00. Even if some data arrives after 13:01:00, as long as its time falls within 13:00:00–13:01:00, it will be counted.
Manage Rules
-
Edit: View all created metric generation rules and edit them.
-
Enable/Disable: Change the rule status. When a metric generation rule is disabled, data stops being written to the measurement. After re-enabling, writing resumes.
-
Delete: Delete unnecessary rules. When a rule is deleted, the measurement is not deleted, but data writing stops.
-
Batch Operations: Perform batch operations on specific rules, including enabling, disabling, deleting, and exporting rules.
-
Import: Import metric generation data.
-
View Metrics
-
View in Metrics Analysis: Jump to the Metrics Analysis page for querying and analysis.
-
View in Metrics Management: Jump to the Metrics Management page to view metrics and tags, and edit metric units and descriptions.
-
Note
- Because the data source and aggregation expression of a metric generation rule determine the data type, some configurations cannot be edited or modified.
- Generated metrics are aggregated from data within the query time range based on the selected frequency. If no data is reported during that time range, no metrics are generated and the metrics cannot be queried or searched.
Query Acceleration List
Go to Metrics > Generate Metrics > Query Acceleration List to view the streaming aggregations that have been registered after enabling guaranteed acceleration on dashboard queries, along with their sources.
The list deduplicates by the actual registered streaming aggregation. When a query contains variables, the actual query after variable resolution is displayed. If the same streaming aggregation has multiple sources, the corresponding dashboards and charts are merged and displayed.
For details on how to enable or disable guaranteed acceleration, see Guaranteed Streaming Aggregation Acceleration.
The list displays the streaming aggregation, source, registration time, and last hit time. It supports searching and filtering by query statement, dashboard, or chart.
View Source Details
Click a streaming aggregation in the list to view the following in the right-hand panel:
- The complete streaming aggregation query statement and registration information.
- The source dashboards, charts, and query templates.
- If the query contains variables, the corresponding variable values.
Click the dashboard name to go to the dashboard. Viewing and navigation permissions follow the dashboard's permission settings.
Stop Guaranteed Acceleration
Guaranteed acceleration is controlled by the source dashboard and cannot be stopped directly from the query acceleration list. Click Stop Guaranteed Acceleration and follow the prompts to disable the option on the source dashboard. If there are multiple sources, you must disable it on all source dashboards. After all sources are disabled, the corresponding record is automatically removed.
Use Cases
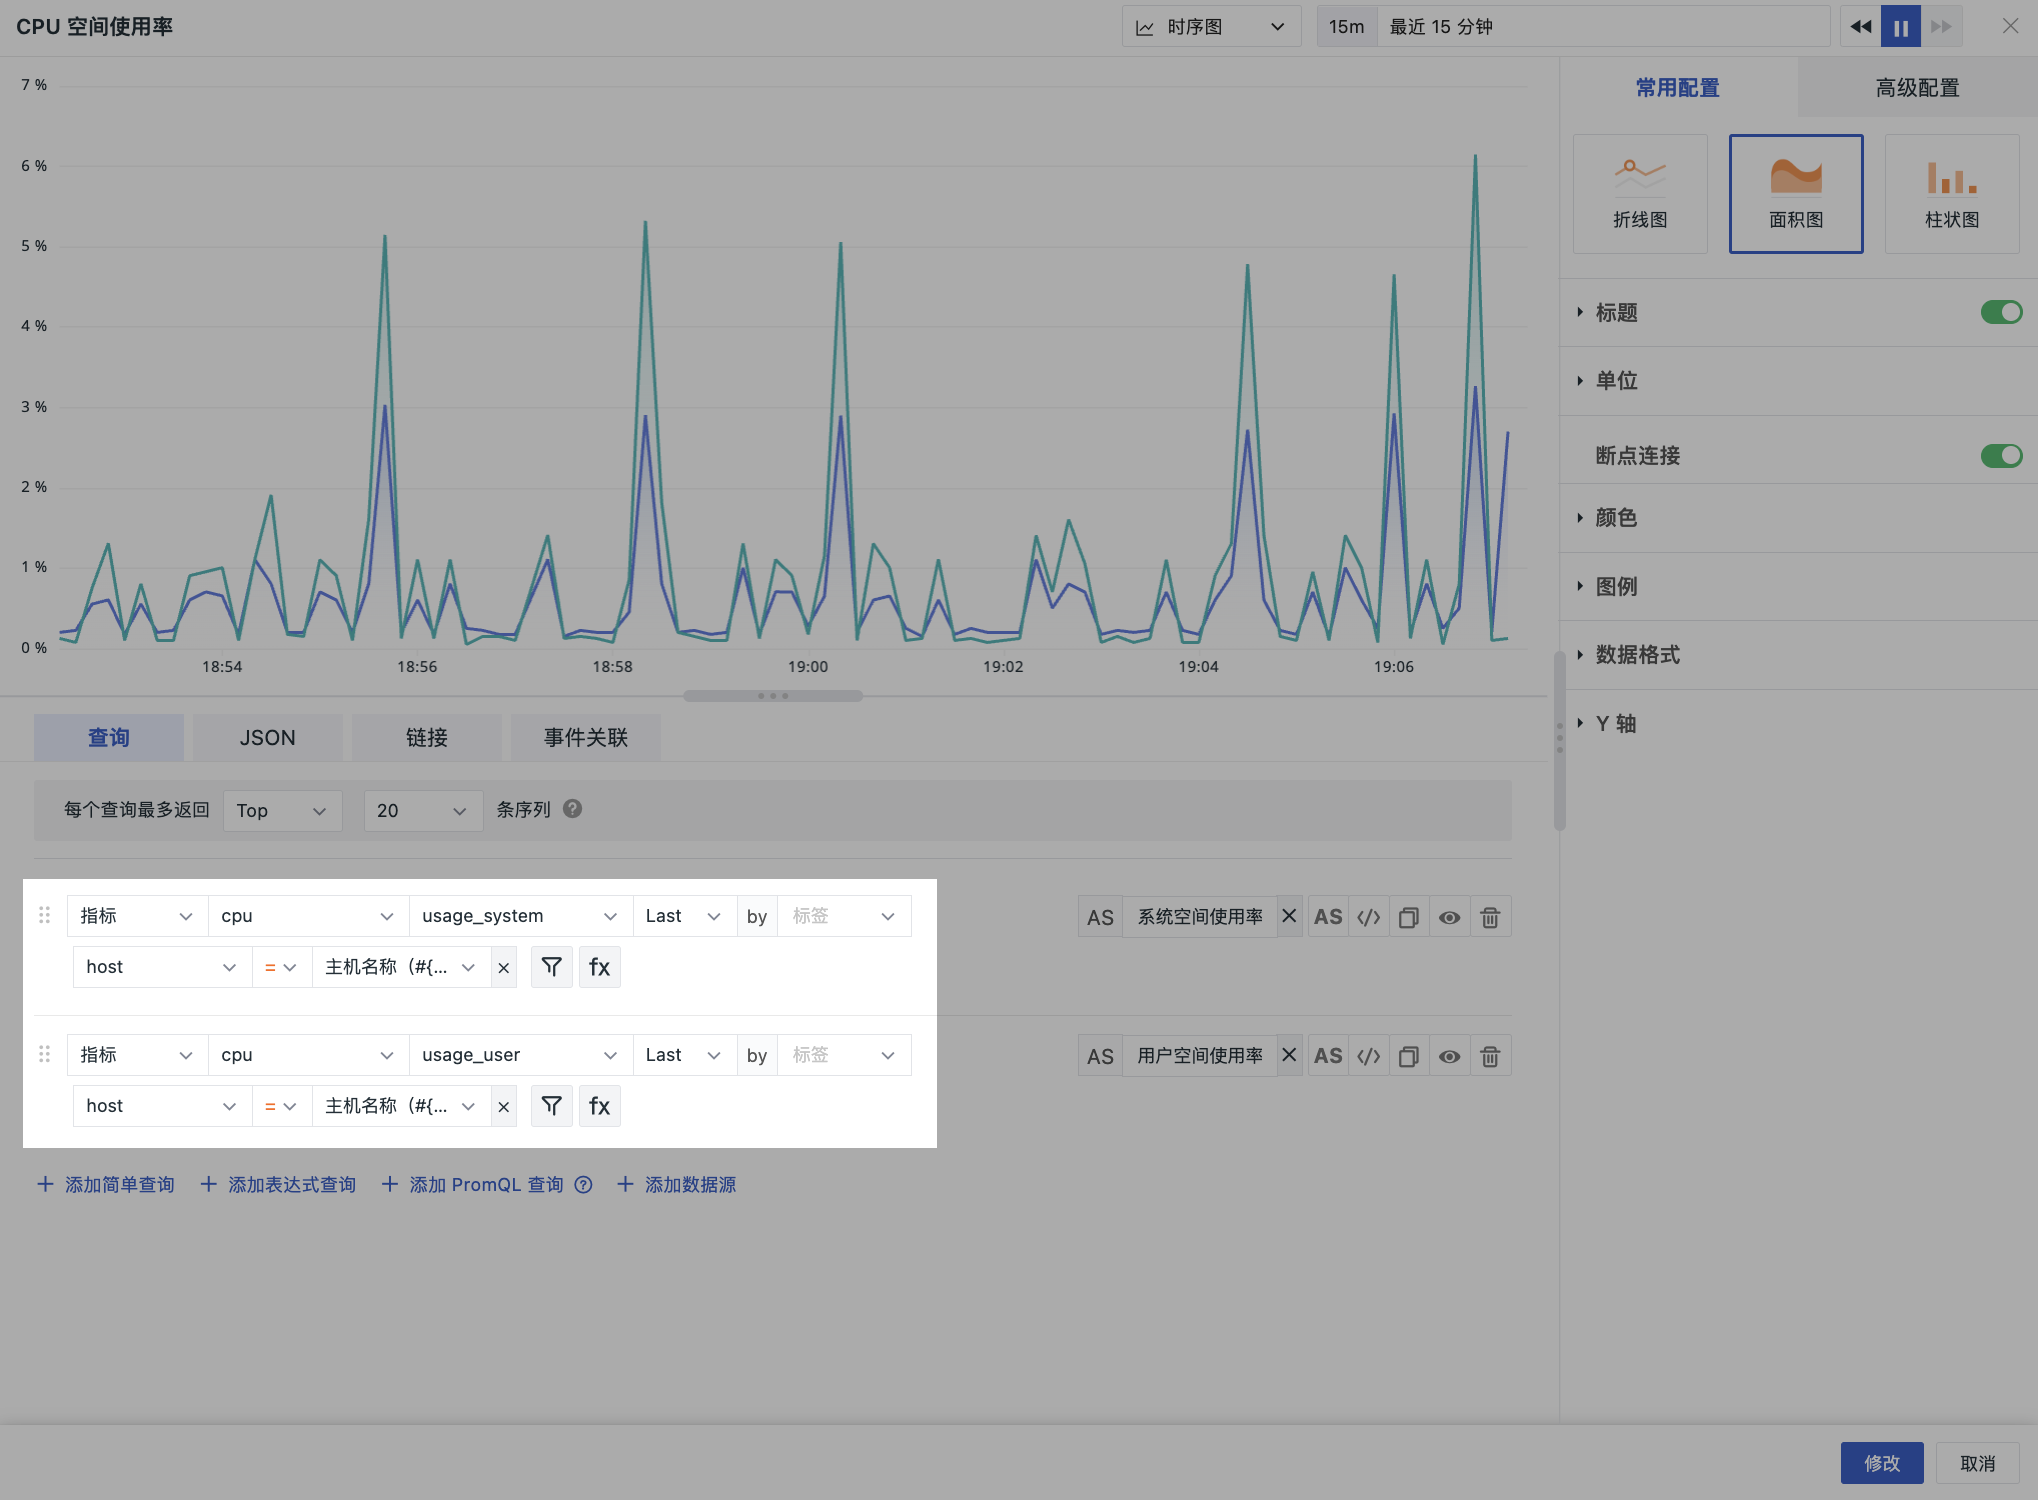
Chart Query
Query and analyze metric data in visual charts.
Query Tool
Query and analyze metric data in Quick Actions > Query Tool > DQL Query.