Explorer
After an application is created, the system aggregates each LLM request (from input prompt to output generation) as a log event into the LLM monitoring Explorer. You can use powerful log query methods to search, filter, and analyze Trace or Span data for a single application or all applications.
| Description | |
|---|---|
| Span | Represents a single operation within an LLM application. Each call to a model, each vector database query, or each API request is an independent Span. It records detailed information about that operation, such as start time, duration, status (success/failure), model used, token consumption, etc. |
| Trace | A Trace records the complete end-to-end path of an external request (e.g., a user query) as it executes through the LLM application system. It is identified by a globally unique ID and organizes all Spans generated during that request into a tree structure with hierarchical and temporal relationships. In short, it may include a series of Spans like "Receive request > Query database > Call LLM > Return result". |
View Modes
Based on list and chart formats, the LLM monitoring Explorer provides multiple professional analysis views.
Displays the latest metric data for all Traces or Spans under a specific application within the current workspace, including input, output, total tokens, duration, etc.
Filters data under the by condition based on count, last, first, count_distinct operation modes:
- Top List
- Time Series
- Pie Chart
- Treemap
- Grouped Table Chart
Details Page
On the details page, the left side displays a single Span and Trace generated by the application, while the right side shows the corresponding preview and attribute information.
Options
- Search and locate based on the node name
source. - Choose whether to display metrics and scores.
What are metrics and scores?
- Metrics:
durationtime display - Scores: Model quality evaluation scores, descriptions, and other information
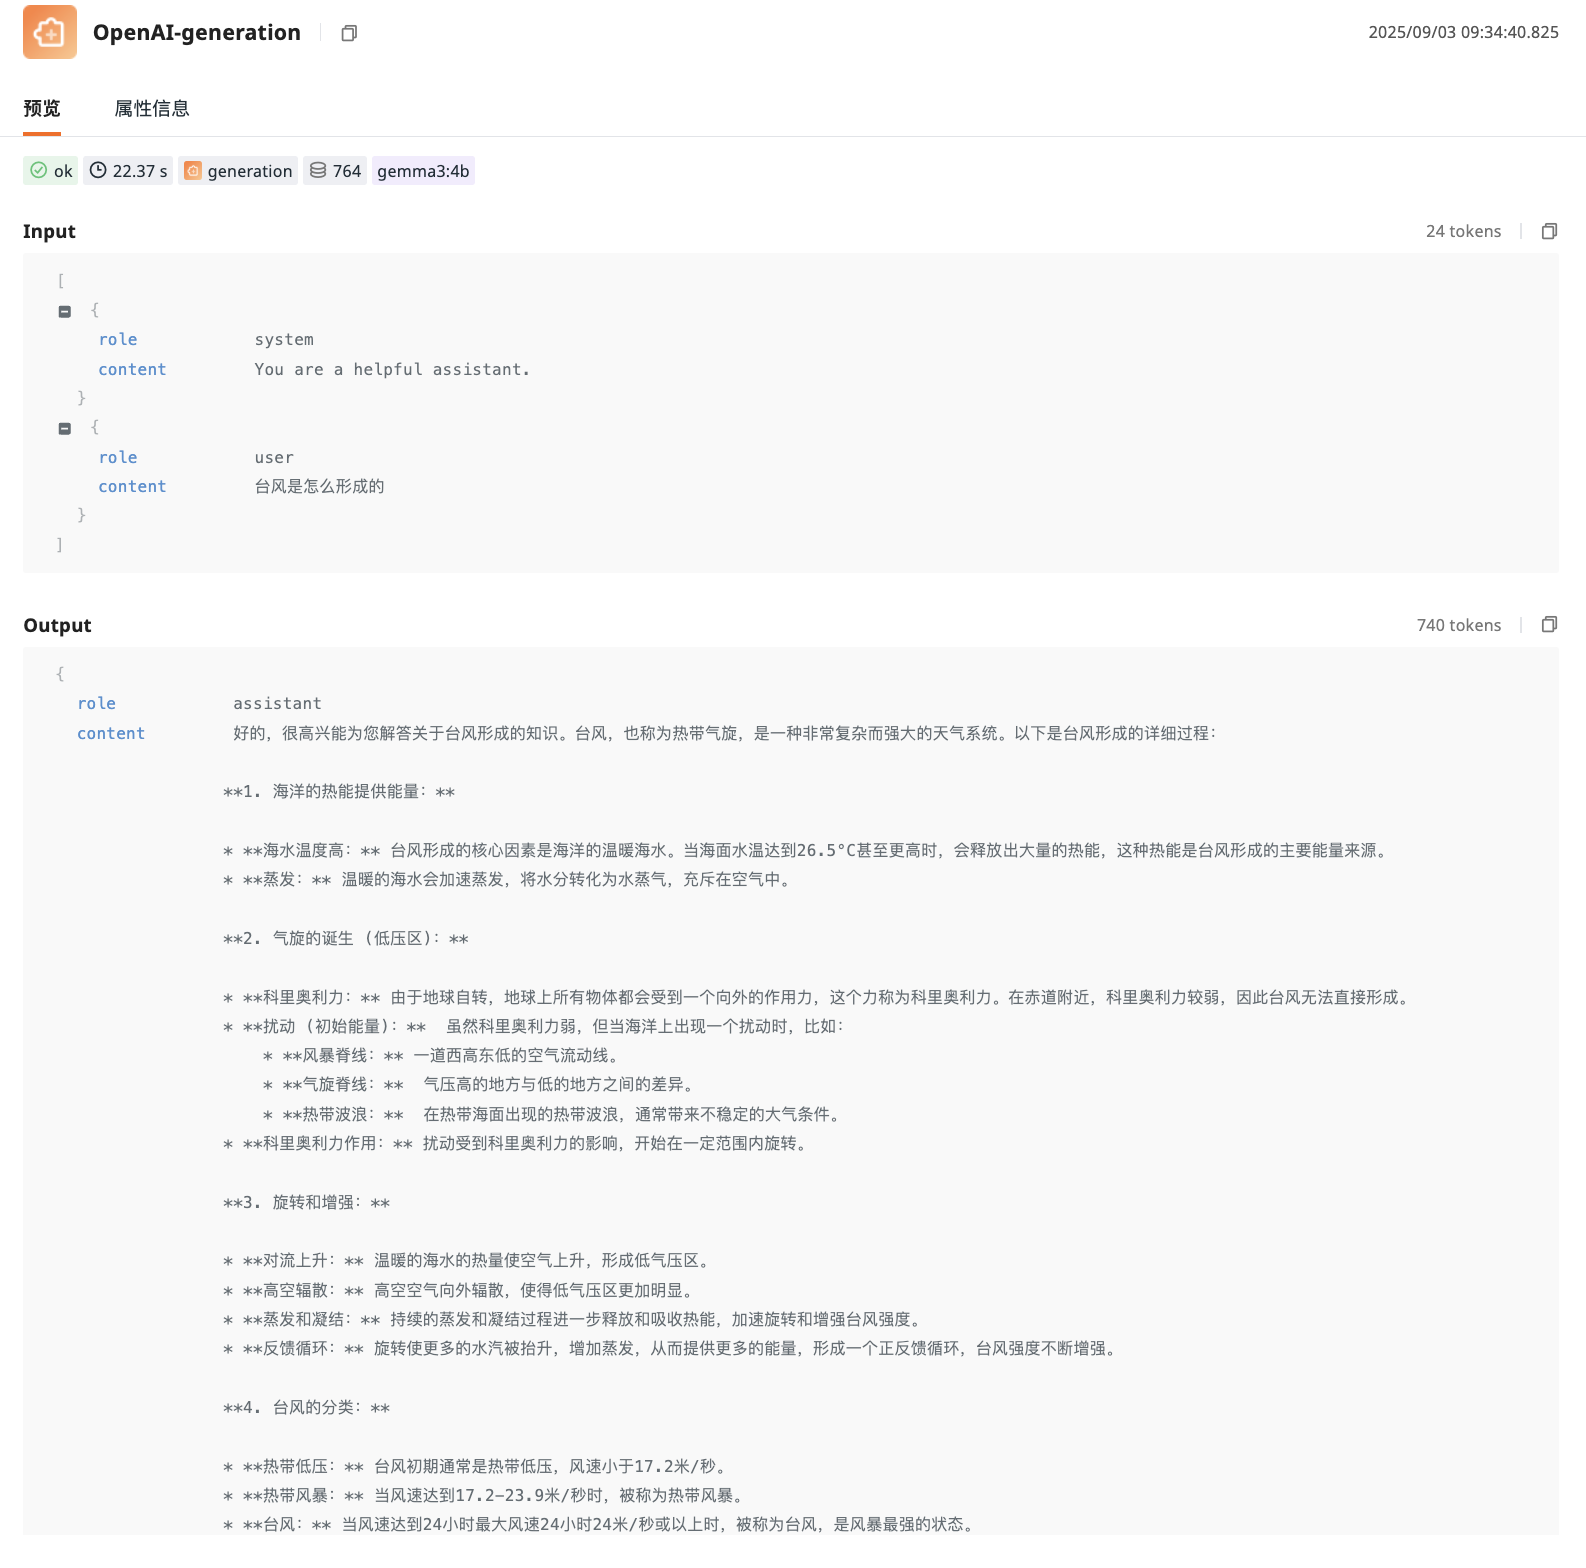
Preview
Includes node type, node name, execution duration, token consumption, execution status, and execution details.
Status Display
Execution Status (status) |
Possible Causes |
|---|---|
| Success: Success | |
| Error: Error | LLM call timeout, tool returning exceptions, etc. |
| Warning: Warning | Output content triggered sensitive word detection but did not interrupt execution, etc. |
Execution Details
Displays the Input and Output within the LLM application. The former contains all elements used to construct the final request sent to the model, while the latter shows the generated result based on the input.
Attribute Information
Relevant field information contained in the current Span or Trace.
Associated Views
Using the + button in the upper right corner, you can bind built-in views to the current details page to achieve specialized display of LLM data.
- Click the add button.
- Select the associated field.
- In the pop-up Bind Built-in View panel, select the view you want to associate.
- After successful binding, the newly added tab will appear in the tab bar.
Further Reading
You might also be interested in: