Enable Observability for the Deployment Plan Itself
Overview
The purpose of this document is to assist private deployment plan users in implementing observability for their deployment plan to enhance the overall operational reliability of the Guance service. This article describes two classic observability patterns and how to deploy Datakit data collection, logging and cutting, Application Performance Monitoring (APM), Synthetic Tests, and Real User Monitoring (RUM) in a Kubernetes environment. Additionally, we provide one-click import template files for Infrastructure and Middleware Observability and Application Service Observability to facilitate better usage and monitoring of your own environment.
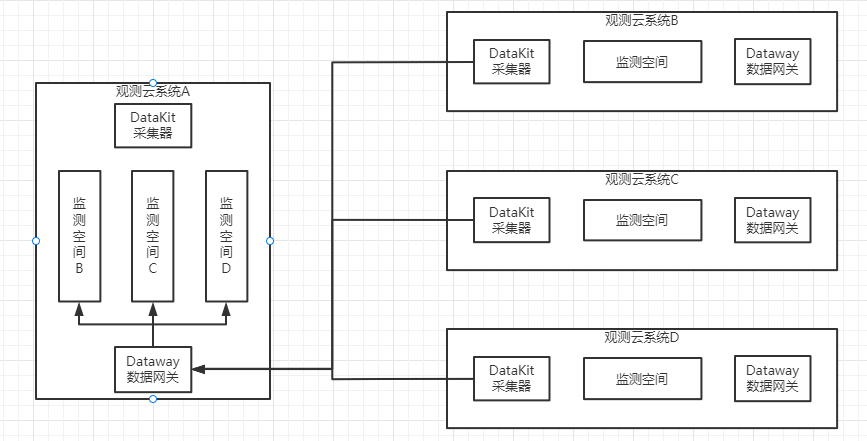
Deployment Plan Observability Patterns
This pattern refers to observing oneself. In other words, it means sending data to one's own workspace. This implies that if the environment goes down, you will not be able to observe your own information data and will be unable to further investigate the cause. The advantage of this solution is: easy deployment. The disadvantage is: data is continuously generated, leading to data self-iteration and creating an infinite loop. Additionally, when the cluster crashes, you cannot observe the issues with the cluster itself.
This pattern refers to having multiple Guance instances of the customer send data to the same node. Advantages: avoids creating a closed loop in data transmission and enables real-time monitoring of the cluster's status.
Account Information Preparation
| Name | Type | Description | Creation Syntax (Note: Modify the Password) | Importance |
|---|---|---|---|---|
| Private FUNC Database Account | DB & USER | FUNC service connection account | CREATE DATABASE private_func; create user 'private_func'@'%' identified by 'V4KySbFhzDkxxxx'; GRANT ALL PRIVILEGES ON private_func.* TO private_func; FLUSH PRIVILEGES; |
Optional |
| MySQL Self-Observation Account | USER | Self-observation account for collecting MySQL metrics | CREATE USER 'datakit'@'%' IDENTIFIED BY 'SFGS&DFxxxx32!'; -- MySQL 8.0+ create the datakit user with the caching_sha2_password method CREATE USER 'datakit'@'%' IDENTIFIED WITH caching_sha2_password by 'SFGS&DFxxxx32!'; GRANT PROCESS ON . TO 'datakit'@'%'; GRANT SELECT ON . TO 'datakit'@'%'; show databases like 'performance_schema'; GRANT SELECT ON performance_schema.* TO 'datakit'@'%'; GRANT SELECT ON mysql.user TO 'datakit'@'%'; GRANT replication client on . to 'datakit'@'%'; |
Important |
| Business Data Collection Account | USER | Used for collecting business data with FUNC | CREATE USER 'read'@'%' IDENTIFIED BY 'u19e0LmkL8Fxxxx'; GRANT SELECT ON df_core.* TO 'read'@'%'; FLUSH PRIVILEGES; |
Optional |
| PostgreSQL Self-Observation Account | USER | Used for GuanceDB 3.0 monitoring | CREATE USER datakit WITH PASSWORD 'Z7ZdQ326EeexxxxP'; GRANT pg_monitor TO datakit; GRANT CONNECT ON DATABASE scopedb_meta TO datakit; GRANT SELECT ON pg_stat_database TO datakit; |
Optional |
Configure Data Collection
Deploy DataKit
Note
Note: The default middleware configurations in the above DataKit configuration are already set up and can be used with minor modifications.
2) Modify the DaemonSet template file in datakit.yaml
   - name: ENV_DATAWAY
     value: https://openway.guance.com?token=tkn_a624xxxxxxxxxxxxxxxxxxxxxxxx74 ## Fill in the real dataway address here
   - name: ENV_GLOBAL_TAGS
     value: host=__datakit_hostname,host_ip=__datakit_ip,guance_site=guance,cluster_name_k8s=guance # Modify panel variables according to your actual situation
   - name: ENV_GLOBAL_ELECTION_TAGS
     value: guance_site=guance,cluster_name_k8s=guance     # Modify according to your actual panel variables
   image: pubrepo.guance.com/datakit/datakit:1.65.2     ## Modify to the latest image version
3) Modify the relevant configurations about ConfigMap in datakit.yaml
apiVersion: v1
kind: ConfigMap
metadata:
  name: datakit-conf
  namespace: datakit
data:
    mysql.conf: |-
        [[inputs.mysql]]
          host = "xxxxxxxxxxxxxxx"      ##Modify the corresponding MySQL connection address
          user = "ste3"                 ##Modify MySQL username
          pass = "Test1234"             ##Modify MySQL password
          ......

    redis.conf: |-
        [[inputs.redis]]
          host = "r-xxxxxxxxx.redis.rds.ops.ste3.com"            ## Modify Redis connection address
          port = 6379
          # unix_socket_path = "/var/run/redis/redis.sock"
          # Configure multiple dbs. If dbs is configured, db will also be included in the collection list. If dbs=[] or not configured, all non-empty dbs in redis will be collected.
          # dbs=[]
          # username = "<USERNAME>"
           password = "Test1234"                                        ## Modify Redis password
          ......

    openes.conf: |-
        [[inputs.elasticsearch]]
          ## Elasticsearch server configuration
          # Supports Basic authentication:
          # servers = ["http://user:pass@localhost:9200"]
          servers = ["http://guance:123.com@opensearch-cluster-client.middleware:9200"]   ## Modify username, password, etc.
          ......
4) Mount operation
        - mountPath: /usr/local/datakit/conf.d/db/mysql.conf
          name: datakit-conf
          subPath: mysql.conf
          readOnly: false
Note: Multiple configurations are handled the same way. Add them sequentially.
6) After modification, start deploying DataKit
Environment Variable Description
| Variable Name | Description |
|---|---|
| ENV_DEFAULT_ENABLED_INPUTS | Configure default collection: self,cpu,disk,diskio,mem,swap,system,hostobject,net,host_processes,container,zipkin |
| ENV_ENABLE_ELECTION | After enabling the election mechanism, Prometheus collection (or other components) will work in master or candidate node mode |
| ENV_GLOBAL_ELECTION_TAGS | Add additional tag dimensions in election components, used for tagging during Prometheus collection (effective when election is enabled) |
| ENV_INPUT_DDTRACE_COMPATIBLE_OTEL | Enable compatibility between otel Trace and DDTrace Trace |
| ENV_INPUT_DISK_USE_NSENTER | Use nsenter method to collect disk usage information, collect cluster dynamic storage block information. Must be set if using dynamic storage block storage. |
| ENV_INPUT_HOSTOBJECT_USE_NSENTER | Use nsenter method to collect disk usage information, collect cluster dynamic storage block information. Must be set if using dynamic storage block storage. |
| ENV_INPUT_CONTAINER_ENABLE_CONTAINER_METRIC | Enable container metric collection |
| ENV_INPUT_CONTAINER_ENABLE_POD_METRIC | Enable Pod metric collection (CPU and memory usage) |
| ENV_INPUT_CONTAINER_ENABLE_K8S_METRIC | Enable k8s metric collection |
Import View, Monitor Templates and Pipelines
Note
After importing the monitoring template, you need to manually set the alert policies and alert notification targets.
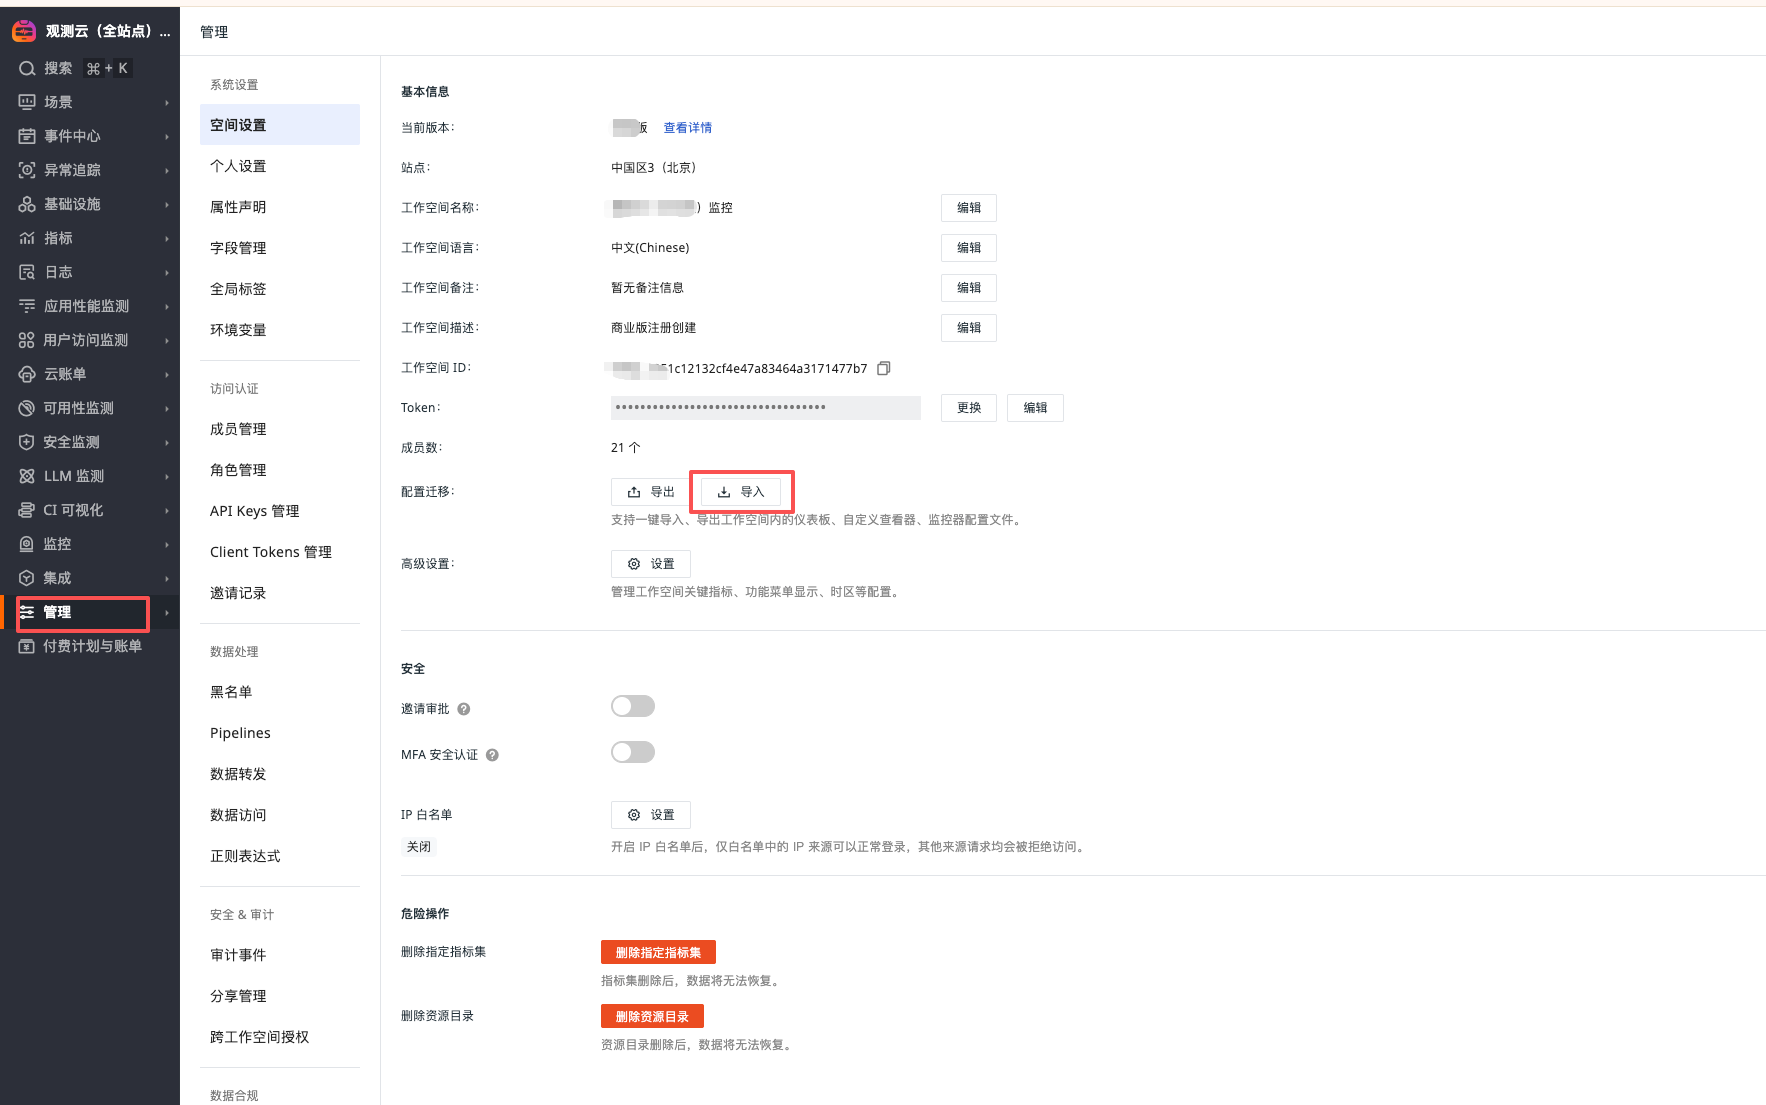
Import View and Monitor Templates
Download View and Monitor Templates
"Manage" - "Workspace Settings" - "Import"
Note
After importing, the monitoring needs to modify the corresponding jump link configuration. Change the dsbd_xxxx in the url to the corresponding dashboard, and change wksp_xxxx to the workspace to be monitored.
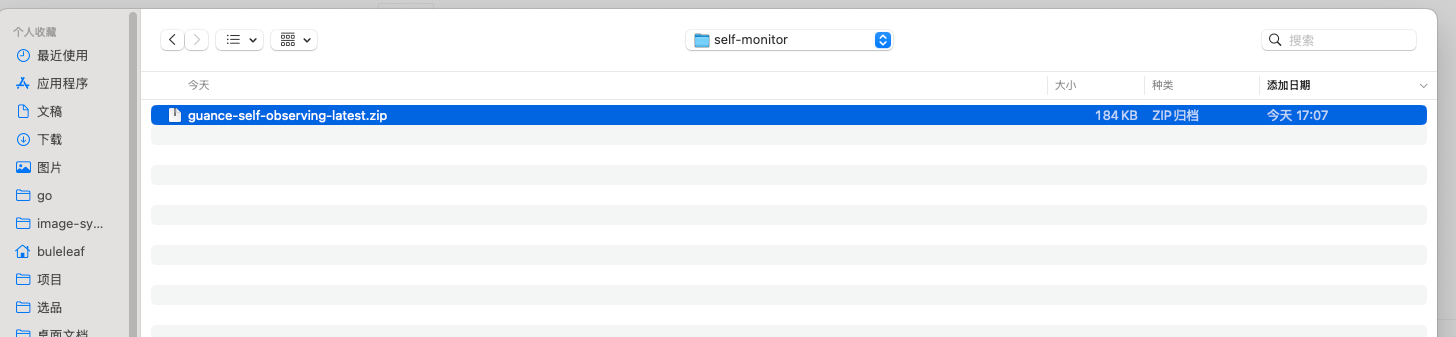
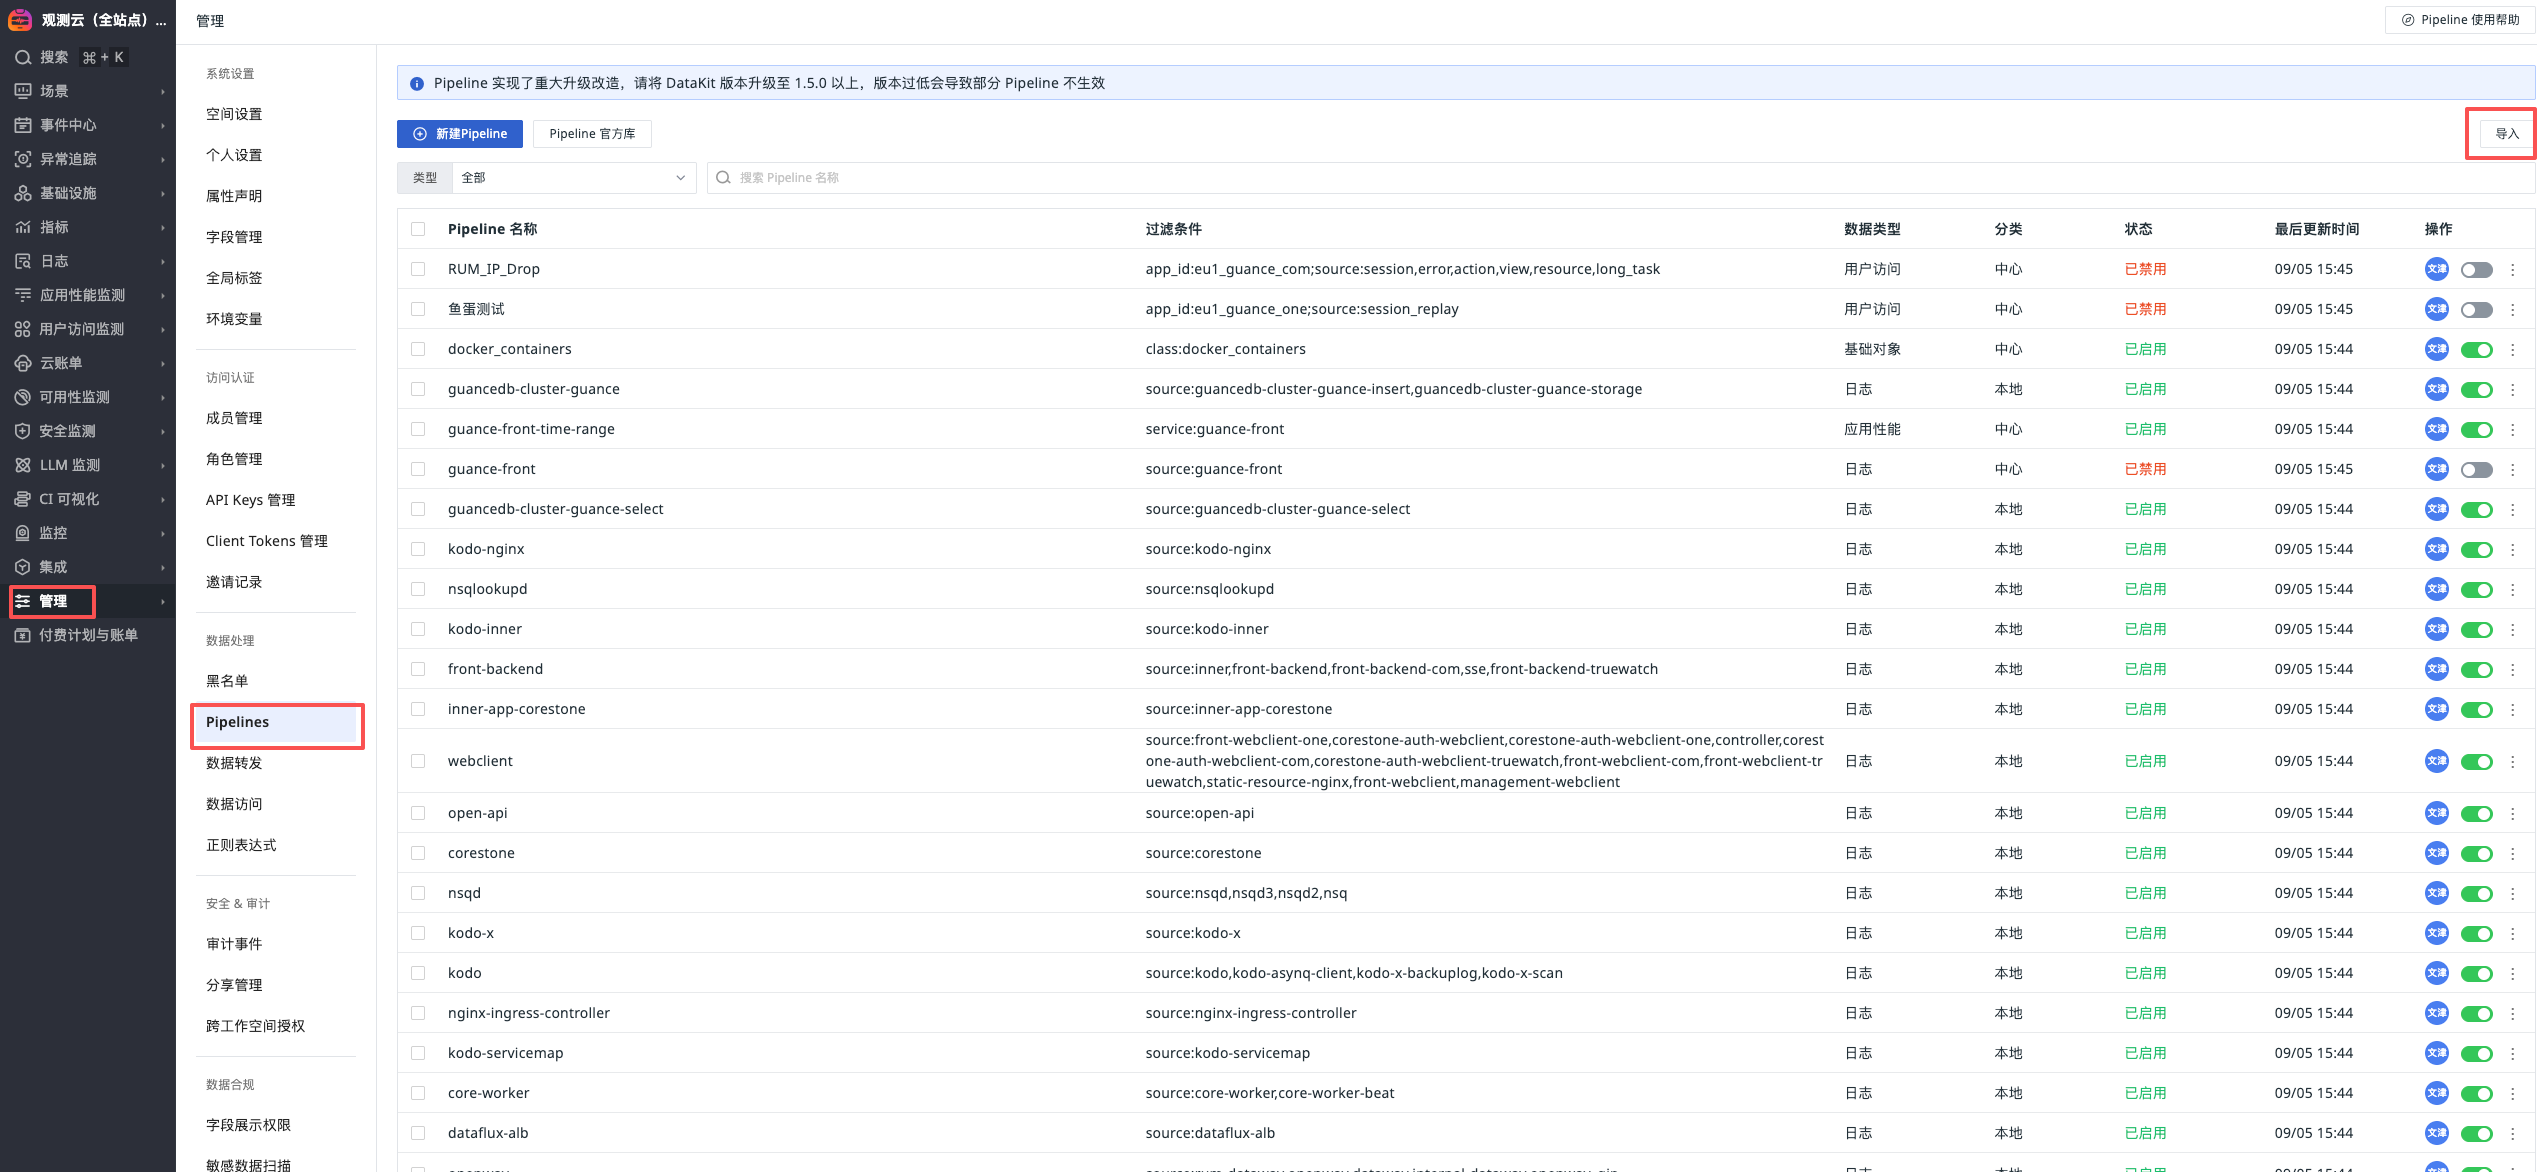
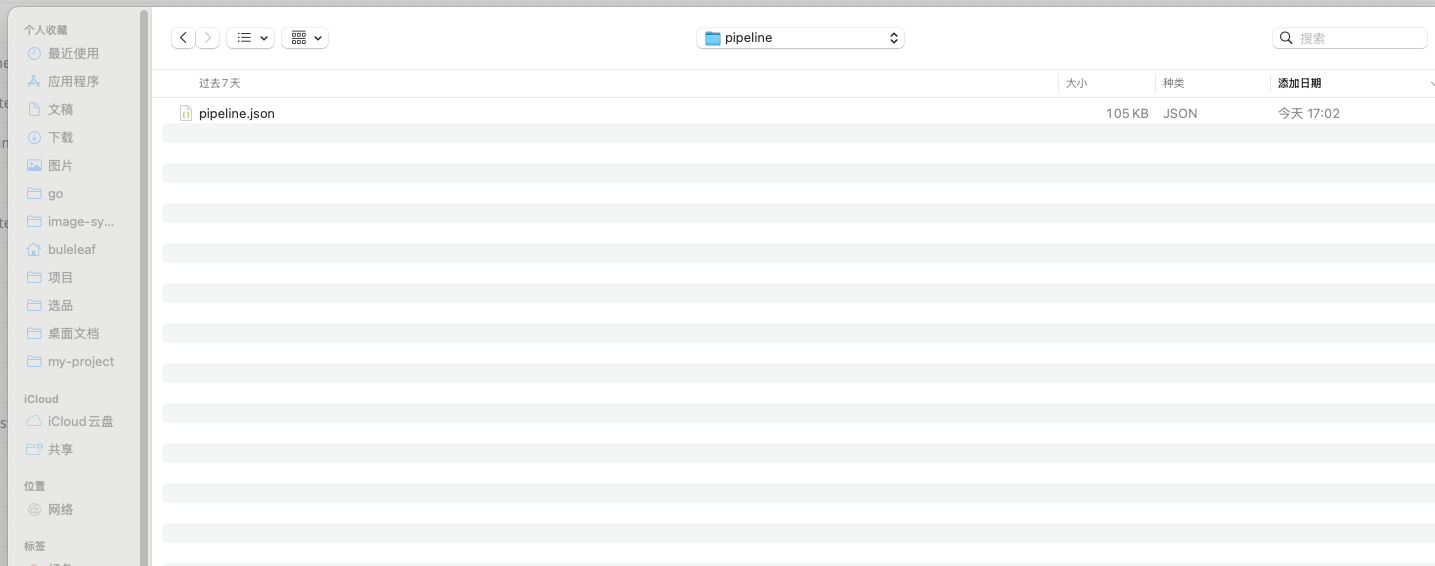
Import Pipelines
Unzip the guance-self-observing-latest.zip file, path: guance-self-observing-latest/pipeline
"Manage" - "Pipelines" - "Import"
Application Service Observability
Configure Service Prom Collection
Download prom configuration file
Unzip guance-self-observing-prom-latest.zip and execute the following commands:
cd guance-self-observing-prom-latest
kubectl patch deploy kodo-x -n  forethought-kodo  --type merge --patch "$(cat kodo-x-prom.yaml)"
kubectl patch deploy kodo -n  forethought-kodo  --type merge --patch "$(cat kodo-prom.yaml)"
kubectl patch deploy kodo-inner -n  forethought-kodo  --type merge --patch "$(cat kodo-inner-prom.yaml)"
kubectl patch sts kodo-servicemap -n  forethought-kodo  --type merge --patch "$(cat kodo-servicemap-prom.yaml)"
kubectl patch sts kodo-x-backuplog -n  forethought-kodo  --type merge --patch "$(cat kodo-x-backuplog-prom.yaml)"
kubectl patch deploy inner -n  forethought-core  --type merge --patch "$(cat core-inner-prom.yaml)"
Configure Application Performance Monitoring
Inject forethought-core Configuration
#!/bin/bash
set -euo pipefail

# Namespace
NAMESPACE="${NAMESPACE:-forethought-core}"

# —— Dedicated KV for each deployment is written here (in the script, no external file) ——
# One line per: "<deploy> KEY=VAL KEY=VAL ..."
DEPLOY_ENV_CONFIG=(

  'front-backend DD_PATCH_MODULES=redis:true,urllib3:true,httplib:true,sqlalchemy:true,httpx:true DD_AGENT_PORT=9529 DD_GEVENT_PATCH_ALL=true DD_SERVICE=front-backend DD_TAGS=pod_name:$(POD_NAME),project:dataflux'
  'inner DD_PATCH_MODULES=redis:true,urllib3:true,httplib:true,sqlalchemy:true,httpx:true DD_AGENT_PORT=9529 DD_GEVENT_PATCH_ALL=true DD_SERVICE=inner DD_TAGS=pod_name:$(POD_NAME),project:dataflux'
  'management-backend DD_PATCH_MODULES=redis:true,urllib3:true,httplib:true,sqlalchemy:true,httpx:true DD_AGENT_PORT=9529 DD_GEVENT_PATCH_ALL=true DD_SERVICE=management-backend DD_TAGS=pod_name:$(POD_NAME),project:dataflux'
  'open-api DD_PATCH_MODULES=redis:true,urllib3:true,httplib:true,sqlalchemy:true,httpx:true DD_AGENT_PORT=9529 DD_GEVENT_PATCH_ALL=true DD_SERVICE=open-api DD_TAGS=pod_name:$(POD_NAME),project:dataflux'
  'sse DD_PATCH_MODULES=redis:true,urllib3:true,httplib:true,sqlalchemy:true,httpx:true DD_AGENT_PORT=9529 DD_GEVENT_PATCH_ALL=true DD_SERVICE=sse DD_TAGS=pod_name:$(POD_NAME),project:dataflux'
  'core-worker DD_TRACE_ENABLED=false'
  'core-worker-0 DD_TRACE_ENABLED=false'
  'core-worker-beat DD_TRACE_ENABLED=false'
  'core-worker-correlation DD_TRACE_ENABLED=false'
)

# —— Only prepend ddtrace-run to args[0] (do not modify command) ——
prefix_ddtrace_run_args_only() { # $1 deploy
  local d="$1"

  # If tracing is explicitly disabled, do not add
  local trace_enabled
  trace_enabled="$(kubectl get deploy "$d" -n "$NAMESPACE" \
     -o jsonpath='{.spec.template.spec.containers[0].env[?(@.name=="DD_TRACE_ENABLED")].value}' 2>/dev/null || true)"
  if [[ "$trace_enabled" == "false" ]]; then
    echo "  • DD_TRACE_ENABLED=false, skip ddtrace-run."
    return 0
  fi

  # Read args[0]
  local first_arg
  first_arg="$(kubectl get deploy "$d" -n "$NAMESPACE" \
     -o jsonpath='{.spec.template.spec.containers[0].args[0]}' 2>/dev/null || true)"

  # Skip if already starts with ddtrace-run
  if [[ "$first_arg" == "ddtrace-run" ]]; then
    echo "  • args already start with ddtrace-run, skip."
    return 0
  fi

  # Check if there is already an args array
  local has_args
  has_args="$(kubectl get deploy "$d" -n "$NAMESPACE" \
     -o jsonpath='{.spec.template.spec.containers[0].args}' 2>/dev/null || true)"

  if [[ -n "$has_args" ]]; then
    # Insert ddtrace-run at the beginning of existing args
    kubectl patch deploy "$d" -n "$NAMESPACE" --type='json' -p='[
      {"op":"add","path":"/spec/template/spec/containers/0/args/0","value":"ddtrace-run"}
    ]' >/dev/null
    echo "  • Inserted ddtrace-run at args[0]"
  else
    # If no args, create args and put ddtrace-run as the first element
    kubectl patch deploy "$d" -n "$NAMESPACE" --type='json' -p='[
      {"op":"add","path":"/spec/template/spec/containers/0/args","value":["ddtrace-run"]}
    ]' >/dev/null
    echo "  • No args: Created args=[\"ddtrace-run\"]"
  fi
}


# —— Utility functions —— #
has_env() { # $1 deploy  $2 KEY
  kubectl get deploy "$1" -n "$NAMESPACE" \
    -o jsonpath="{.spec.template.spec.containers[0].env[?(@.name=='$2')].name}" 2>/dev/null | grep -qx "$2"
}
ensure_env_array() { # $1 deploy
  local has_array
  has_array="$(kubectl get deploy "$1" -n "$NAMESPACE" -o jsonpath="{.spec.template.spec.containers[0].env}" 2>/dev/null || true)"
  if [[ -z "${has_array}" ]]; then
    kubectl patch deploy "$1" -n "$NAMESPACE" --type='json' -p="[
      {\"op\":\"add\",\"path\":\"/spec/template/spec/containers/0/env\",\"value\":[]}
    ]" >/dev/null
  fi
}

for item in "${DEPLOY_ENV_CONFIG[@]}"; do
  deploy="${item%% *}"
  # If the line only has the deployment name, skip
  rest="${item#* }"; [[ "$rest" == "$deploy" ]] && rest=""

  echo "→ Processing: $deploy"

  # Check if it exists
  if ! kubectl get deploy "$deploy" -n "$NAMESPACE" >/dev/null 2>&1; then
    echo "  - Not found, skip."
    continue
  fi

  # Ensure there is an env array (otherwise /env/- append will fail)
  ensure_env_array "$deploy"

  # Append Downward API (add if missing): DD_AGENT_HOST=status.hostIP, POD_NAME=metadata.name
  if ! has_env "$deploy" "DD_AGENT_HOST"; then
    kubectl patch deploy "$deploy" -n "$NAMESPACE" --type='json' -p='[
      {"op":"add","path":"/spec/template/spec/containers/0/env/-",
       "value":{"name":"DD_AGENT_HOST","valueFrom":{"fieldRef":{"apiVersion":"v1","fieldPath":"status.hostIP"}}}}
    ]' >/dev/null
    echo "  • add DD_AGENT_HOST (status.hostIP)"
  else
    echo "  • DD_AGENT_HOST exists, skip."
  fi

  if ! has_env "$deploy" "POD_NAME"; then
    kubectl patch deploy "$deploy" -n "$NAMESPACE" --type='json' -p='[
      {"op":"add","path":"/spec/template/spec/containers/0/env/-",
       "value":{"name":"POD_NAME","valueFrom":{"fieldRef":{"apiVersion":"v1","fieldPath":"metadata.name"}}}}
    ]' >/dev/null
    echo "  • add POD_NAME (metadata.name)"
  else
    echo "  • POD_NAME exists, skip."
  fi

  # Process each static KEY=VAL (add if missing; skip if exists)
  for kv in $rest; do
    key="${kv%%=*}"
    val="${kv#*=}"
    if has_env "$deploy" "$key"; then
      echo "  • $key exists, skip."
    else
      kubectl set env deploy/"$deploy" -n "$NAMESPACE" "$key=$val" >/dev/null
      echo "  • add $key=$val"
    fi
  done
  # Ensure the startup command is prefixed with ddtrace-run
  prefix_ddtrace_run_args_only "$deploy"
  echo "  -> Done: $deploy"
done
Inject forethought-kodo Configuration
#!/bin/bash
set -euo pipefail

# Namespace
NAMESPACE="${NAMESPACE:-forethought-kodo}"

# —— Dedicated KV for each deployment is written here (in the script, no external file) ——
# One line per: "<deploy> KEY=VAL KEY=VAL ..."
DEPLOY_ENV_CONFIG=(
  'kodo DD_TRACE_ENABLED=true DD_TRACE_AGENT_PORT=9529 DD_TRACE_SAMPLE_RATE=0 DD_SERVICE=kodo DD_TAGS=pod_name:$(POD_NAME),project:dataflux'
  'kodo-inner DD_TRACE_ENABLED=true DD_TRACE_AGENT_PORT=9529 DD_SERVICE=kodo-inner DD_TAGS=pod_name:$(POD_NAME),project:dataflux'

)

# —— Utility functions —— #
has_env() { # $1 deploy  $2 KEY
  kubectl get deploy "$1" -n "$NAMESPACE" \
    -o jsonpath="{.spec.template.spec.containers[0].env[?(@.name=='$2')].name}" 2>/dev/null | grep -qx "$2"
}
ensure_env_array() { # $1 deploy
  local has_array
  has_array="$(kubectl get deploy "$1" -n "$NAMESPACE" -o jsonpath="{.spec.template.spec.containers[0].env}" 2>/dev/null || true)"
  if [[ -z "${has_array}" ]]; then
    kubectl patch deploy "$1" -n "$NAMESPACE" --type='json' -p="[
      {\"op\":\"add\",\"path\":\"/spec/template/spec/containers/0/env\",\"value\":[]}
    ]" >/dev/null
  fi
}

for item in "${DEPLOY_ENV_CONFIG[@]}"; do
  deploy="${item%% *}"
  # If the line only has the deployment name, skip
  rest="${item#* }"; [[ "$rest" == "$deploy" ]] && rest=""

  echo "→ Processing: $deploy"

  # Check if it exists
  if ! kubectl get deploy "$deploy" -n "$NAMESPACE" >/dev/null 2>&1; then
    echo "  - Not found, skip."
    continue
  fi

  # Ensure there is an env array (otherwise /env/- append will fail)
  ensure_env_array "$deploy"

  # Append Downward API (add if missing): DD_AGENT_HOST=status.hostIP, POD_NAME=metadata.name
  if ! has_env "$deploy" "DD_AGENT_HOST"; then
    kubectl patch deploy "$deploy" -n "$NAMESPACE" --type='json' -p='[
      {"op":"add","path":"/spec/template/spec/containers/0/env/-",
       "value":{"name":"DD_AGENT_HOST","valueFrom":{"fieldRef":{"apiVersion":"v1","fieldPath":"status.hostIP"}}}}
    ]' >/dev/null
    echo "  • add DD_AGENT_HOST (status.hostIP)"
  else
    echo "  • DD_AGENT_HOST exists, skip."
  fi

  if ! has_env "$deploy" "POD_NAME"; then
    kubectl patch deploy "$deploy" -n "$NAMESPACE" --type='json' -p='[
      {"op":"add","path":"/spec/template/spec/containers/0/env/-",
       "value":{"name":"POD_NAME","valueFrom":{"fieldRef":{"apiVersion":"v1","fieldPath":"metadata.name"}}}}
    ]' >/dev/null
    echo "  • add POD_NAME (metadata.name)"
  else
    echo "  • POD_NAME exists, skip."
  fi

  # Process each static KEY=VAL (add if missing; skip if exists)
  for kv in $rest; do
    key="${kv%%=*}"
    val="${kv#*=}"
    if has_env "$deploy" "$key"; then
      echo "  • $key exists, skip."
    else
      kubectl set env deploy/"$deploy" -n "$NAMESPACE" "$key=$val" >/dev/null
      echo "  • add $key=$val"
    fi
  done

  echo "  -> Done: $deploy"
done
Configure Synthetic Tests
1) Create a new website to monitor
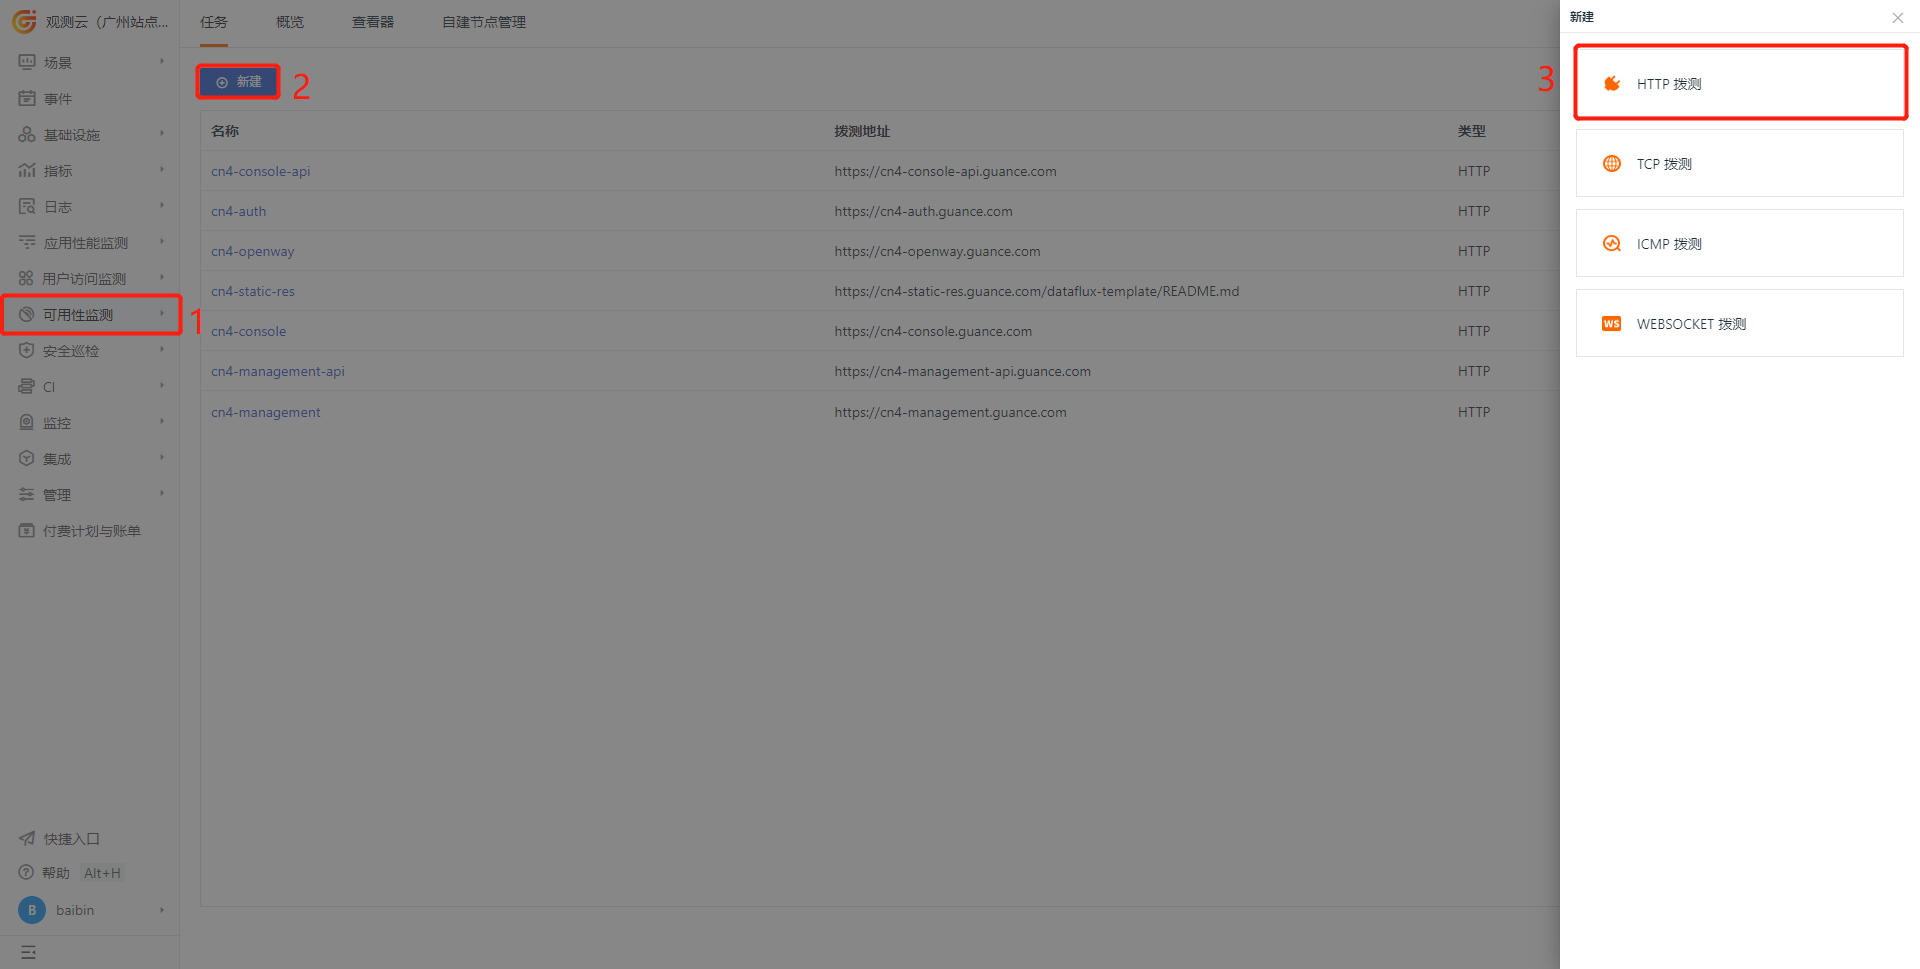
2) Configure the testing task
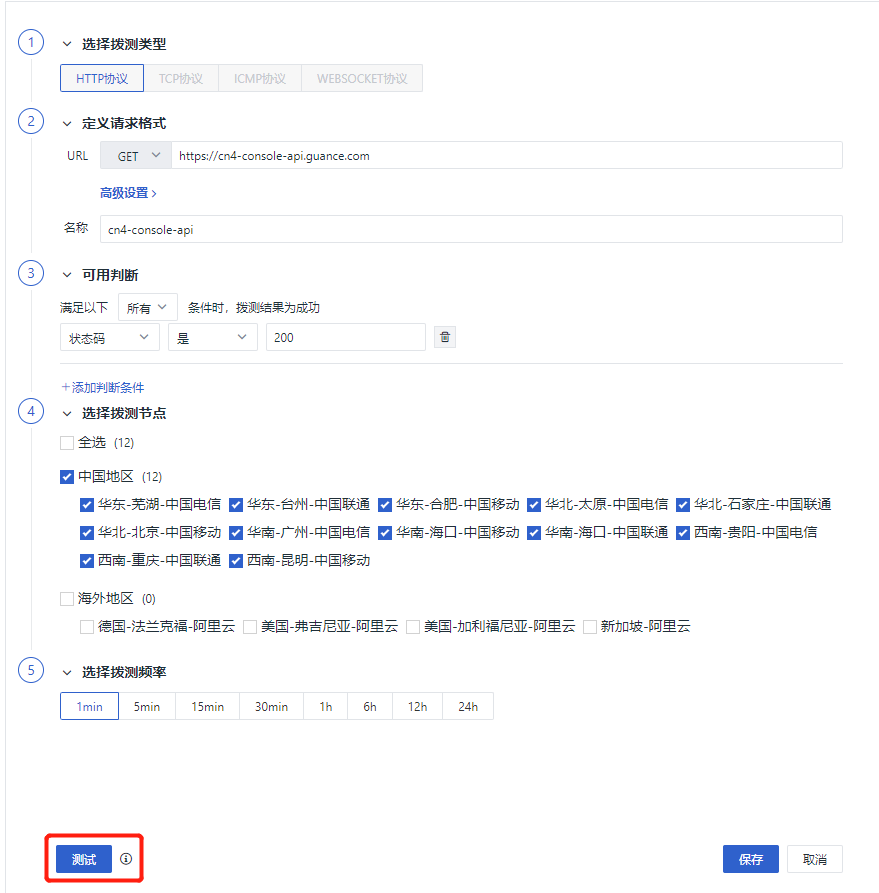
Note
Modify according to the actual domain name set
| Name | Test Address | Type | Task Status | Options |
|---|---|---|---|---|
| xx-dataflux-api | https://xx-console-api.guance.com | HTTP | Start |  |
| xx-open-api | https://xx-open-api.guance.com | HTTP | Start |  |
| xx-dataway | https://xx-dataway.guance.com | HTTP | Start |  |
| xx-static-res | https://xx-static-res.guance.com/dataflux-template/README.md | HTTP | Start | |
| xx-dataflux | https://xx-dataflux.guance.com | HTTP | Start |  |
| xx-management-api | https://xx-management-api.guance.com | HTTP | Start | |
| xx-management | https://xx-management.guance.com | HTTP | Start |  |
Configure Real User Monitoring
Note
If "Use Public Network DataWay" is not found, please modify the namespace "forethought-webclient" - configmap "front-web-config", add rumDatawayUrl:<https://<Dataway address>, and restart the front-webclient service.
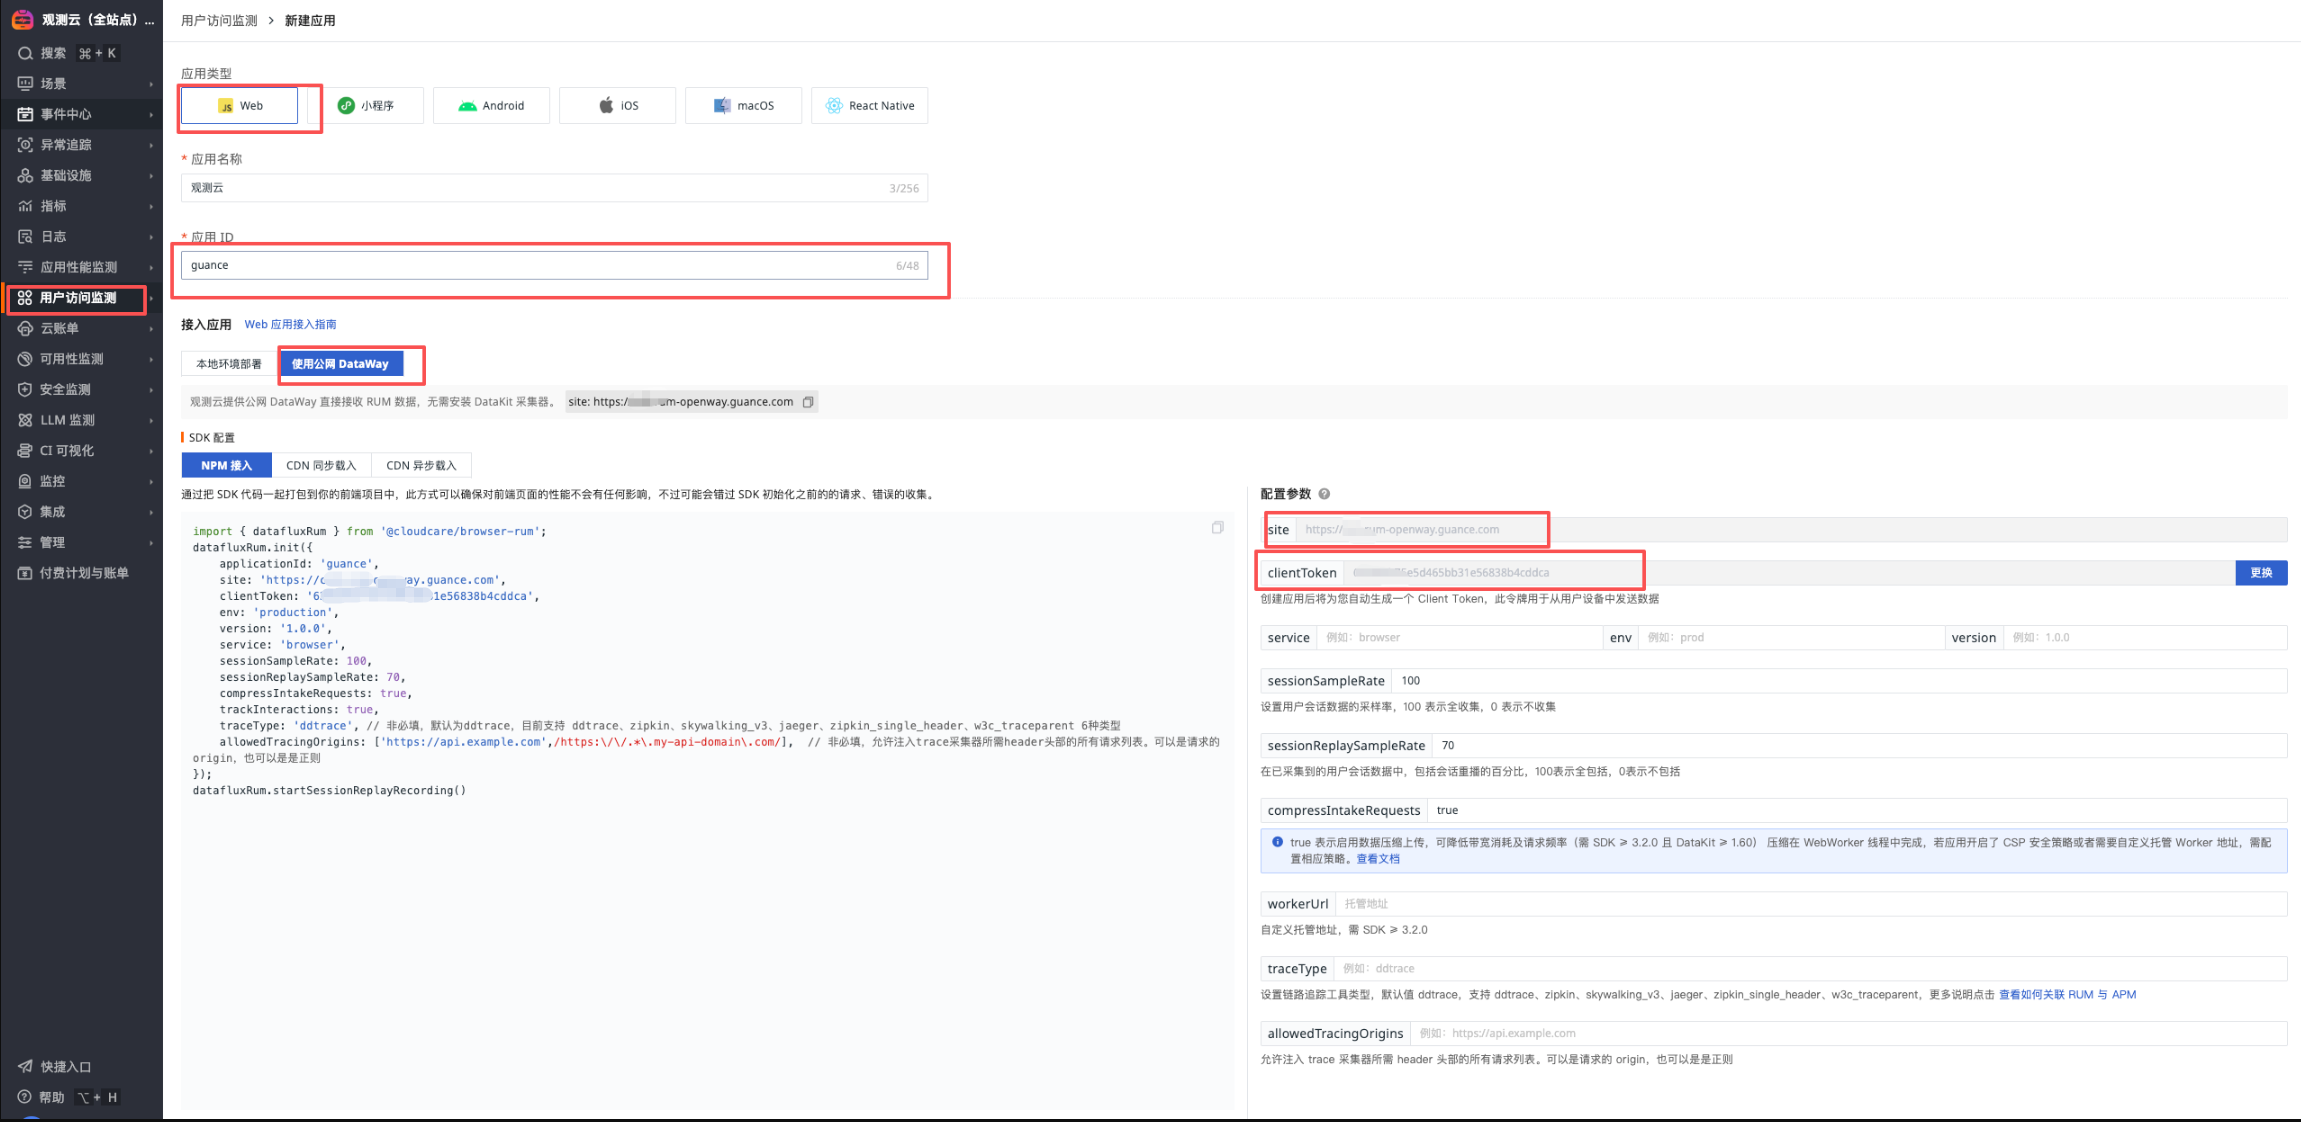
1) Get RUM configuration
Log in to the self-observation workspace and create a RUM app
- App Name: Guance
- App ID: xxx_guance_com
- Get site
- Get clientToken
2) Modify the ConfigMap configuration under the forethought-webclient namespace's front-web-config (add parameters if not present)
- rumEnable: 1 (1 means enabled)
- rumOpenwayUrl: "Get site"
- rumClientToken: "Get clientToken"
- rumApplicationId: "App ID"
- rumAllowedDdtracingOrigins: ["https://xxx-console-api.guance.com", "https://xxx-console.guance.com"]
- rumJsUrl: "https://static.guance.com/browser-sdk/v3/dataflux-rum.js", ## For Guance versions before 1.123.216, please change v2 to v3
window.DEPLOYCONFIG = {
    cookieDomain: '.guance.com',
    apiUrl: 'https://cn4-console-api.guance.com',
    wsUrl: 'wss://.guance.com',
    innerAppDisabled: 0,
    innerAppLogin: 'https://cn4-auth.guance.com/redirectpage/login',
    innerAppRegister: 'https://cn4-auth.guance.com/redirectpage/register',
    innerAppProfile: 'https://cn4-auth.guance.com/redirectpage/profile',
    innerAppCreateworkspace: 'https://cn4-auth.guance.com/redirectpage/createworkspace',
    staticFileUrl: 'https://cn4-static-res.guance.com',
    staticDatakit: 'https://static.guance.com',
    cloudDatawayUrl: '',
    isSaas: '1',
    showHelp: 1,
    rumEnable: 1,                                                                              ## 0 is disabled, 1 is enabled, enable here
    rumOpenwayUrl: "",                                                                         ## openway address
    rumApplicationId: "",                                                                      ## Modify to actual appid
    rumJsUrl: "https://static.guance.com/browser-sdk/v3/dataflux-rum.js", ## For Guance versions before 1.123.216, please change v2 to v3
    rumDataEnv: 'prod',
Alert Policy Description
| Alert Policy Name | Alert Level | Alert Description | Remarks |
|---|---|---|---|
| P0 Alert - Lark Group & Phone Call | Critical | This policy is the highest level alert. Incidents must be handled immediately after they occur. Trigger conditions include: 1. Site page inaccessible; 2. Data cannot be reported or written, causing data loss; 3. Monitors stop running, causing user monitoring to fail; 4. Automatic trigger tasks terminate or fail, causing data loss; 5. Middleware failure, causing system unavailability or data loss. |
Recommended notification target: Phone call |
| Infrastructure Alert - Lark Group | Critical, Major | This policy level is lower than P0 alert. Incidents require continuous attention and investigation after they occur. Trigger conditions include: 1. Service abnormal restart; 2. Node memory anomaly; 3. Node load too high or other system resource anomalies. |
Recommended notification target: Normal (Email, Lark, etc.) |
| Business Alert - Lark Group | Critical, Major, Warning | This policy is a normal level alert. It is recommended to pay continuous attention after incidents occur. Trigger conditions include: 1. Service log errors; 2. Business logic related anomalies. |
Recommended notification target: Normal (Email, Lark, etc.) |
| ScopeDB Related Service Alert | All | This policy is a normal level alert. It is recommended to pay continuous attention after incidents occur. Trigger conditions include: 1. ScopeDB service log errors; 2. ScopeDB performance alerts |
Recommended notification target: Normal (Email, Lark, etc.) |
Alert Setup Steps
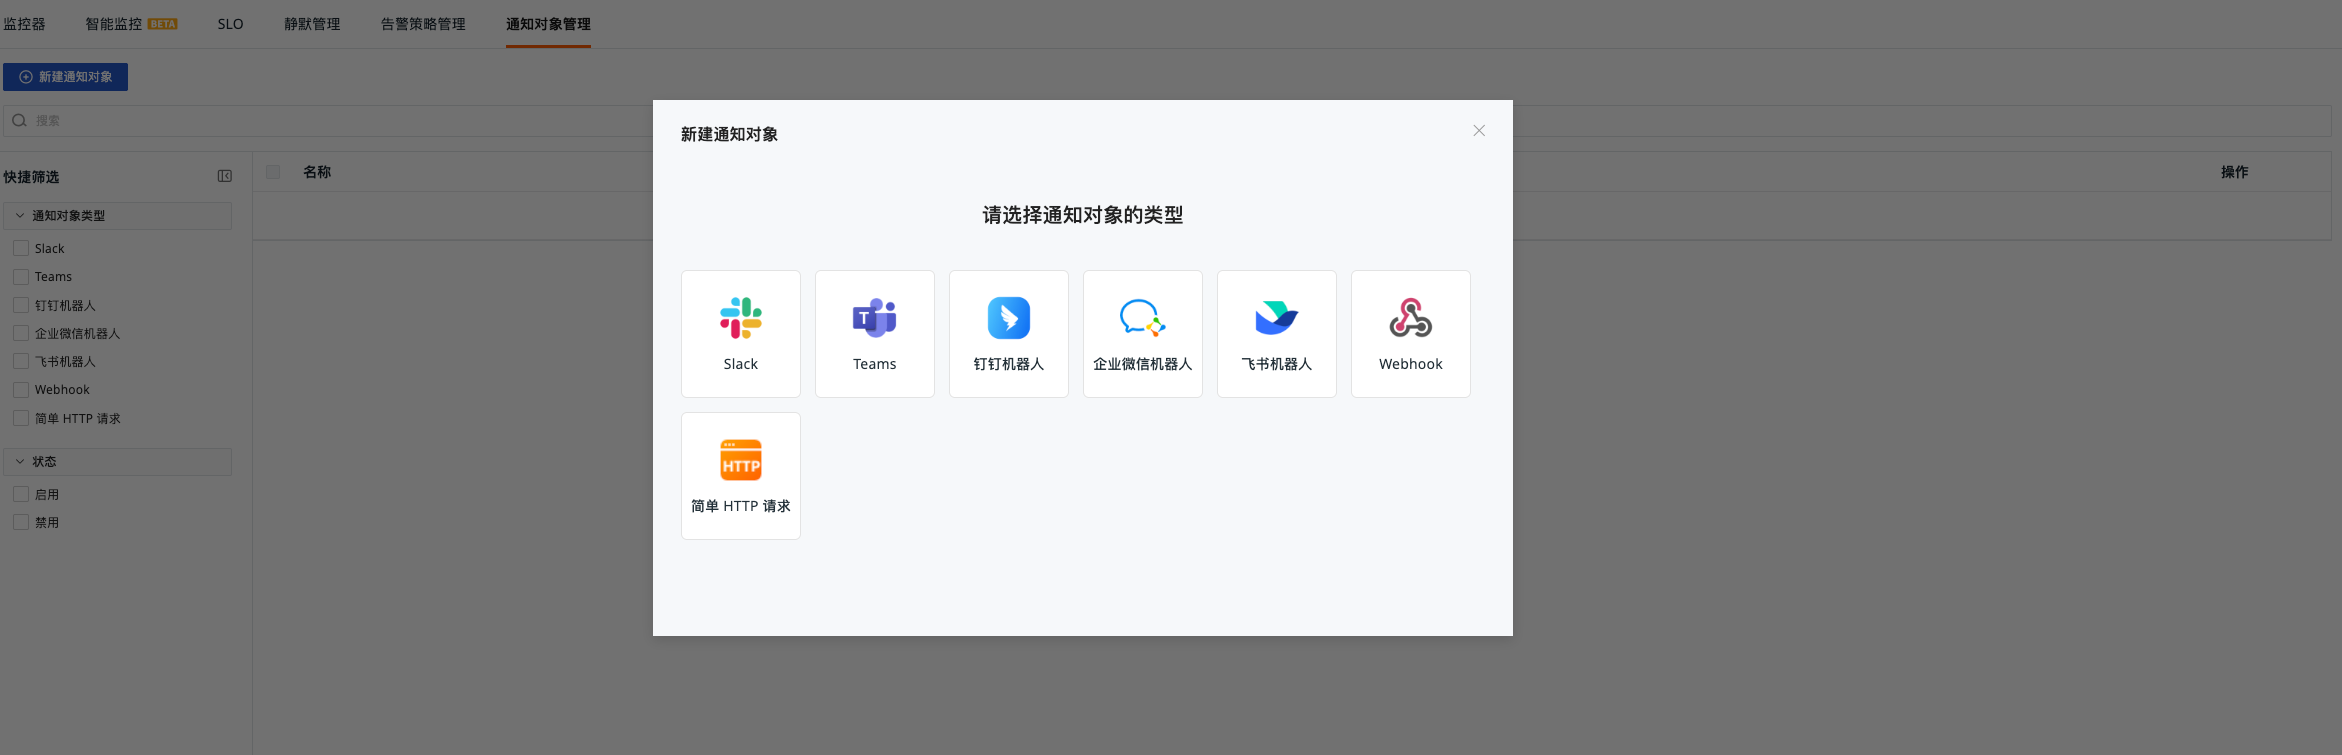
Create Notification Targets
-
Log in to the self-observation workspace and go to "Monitoring" - "Notification Targets Management"
-
Create 3 different notification targets (Notification target type is optional, different notification groups are recommended)
- Business Alert
- Infrastructure Alert
- P0 Alert
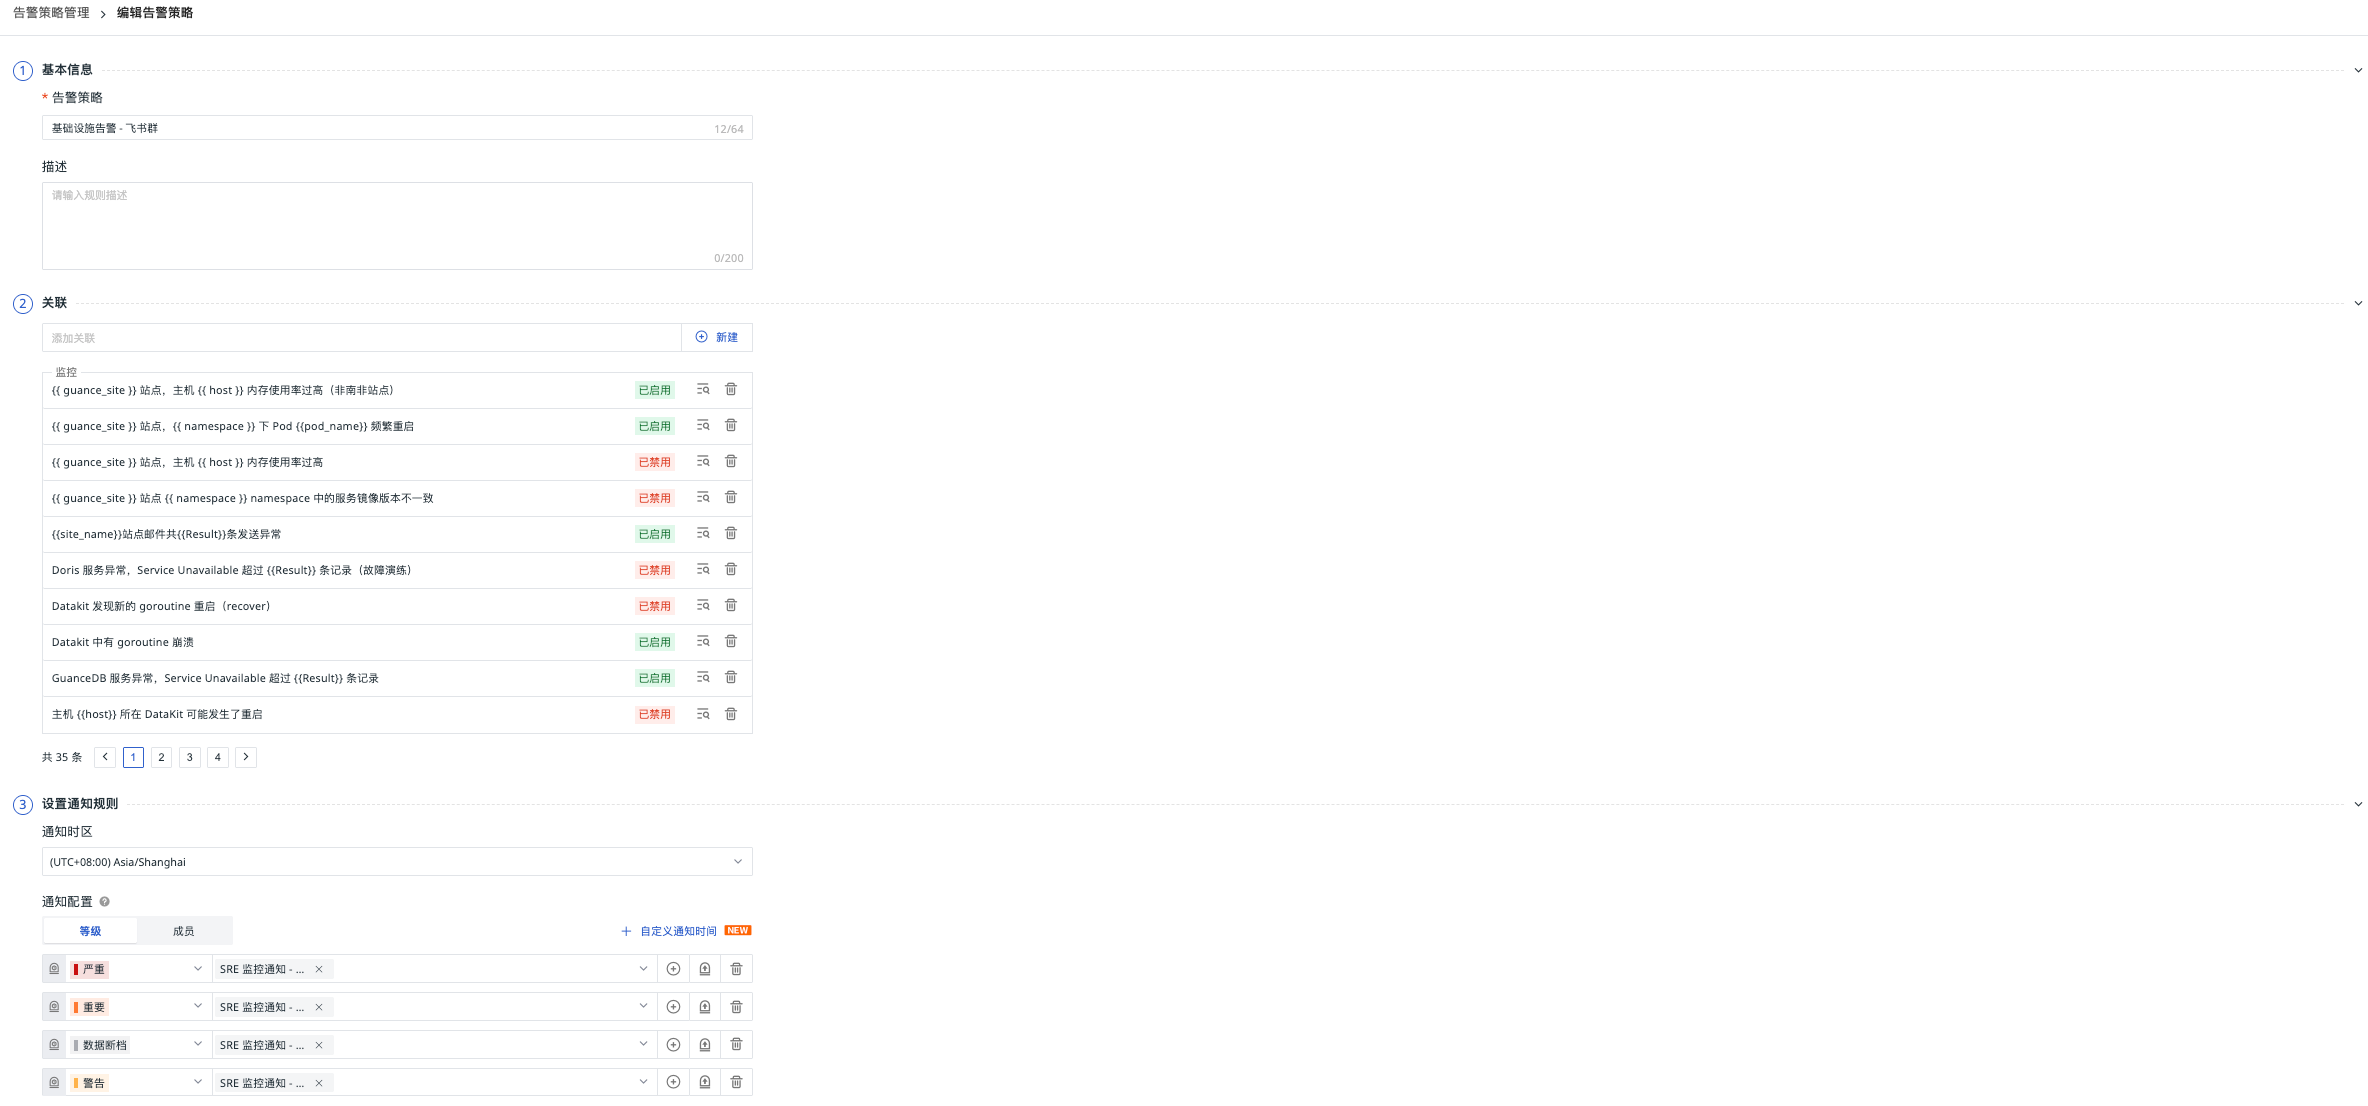
Configure Alert Policies
"Monitoring" - "Alert Strategies Management" Set notification configuration
| Alert Policy Name | Notification Configuration - Level | Notification Configuration - Target | Repeat Alert Cycle |
|---|---|---|---|
| Infrastructure Alert - Lark Group | Critical, Major | Infrastructure Alert | 30 minutes |
| P0 Alert - Lark Group & Phone Call | Critical | P0 Alert | 6 hours |
| Business Alert - Lark Group | Critical, Major, Warning | Business Alert | 30 minutes |
| ScopeDB Related Service Alert | All | Business Alert | 30 minutes |
Func Self-Observation (Optional)
Func Task Log Data Reporting
DataFlux Func's function run logs, automatic trigger configuration and other information can be directly reported to Guance. The steps are as shown in the figure below
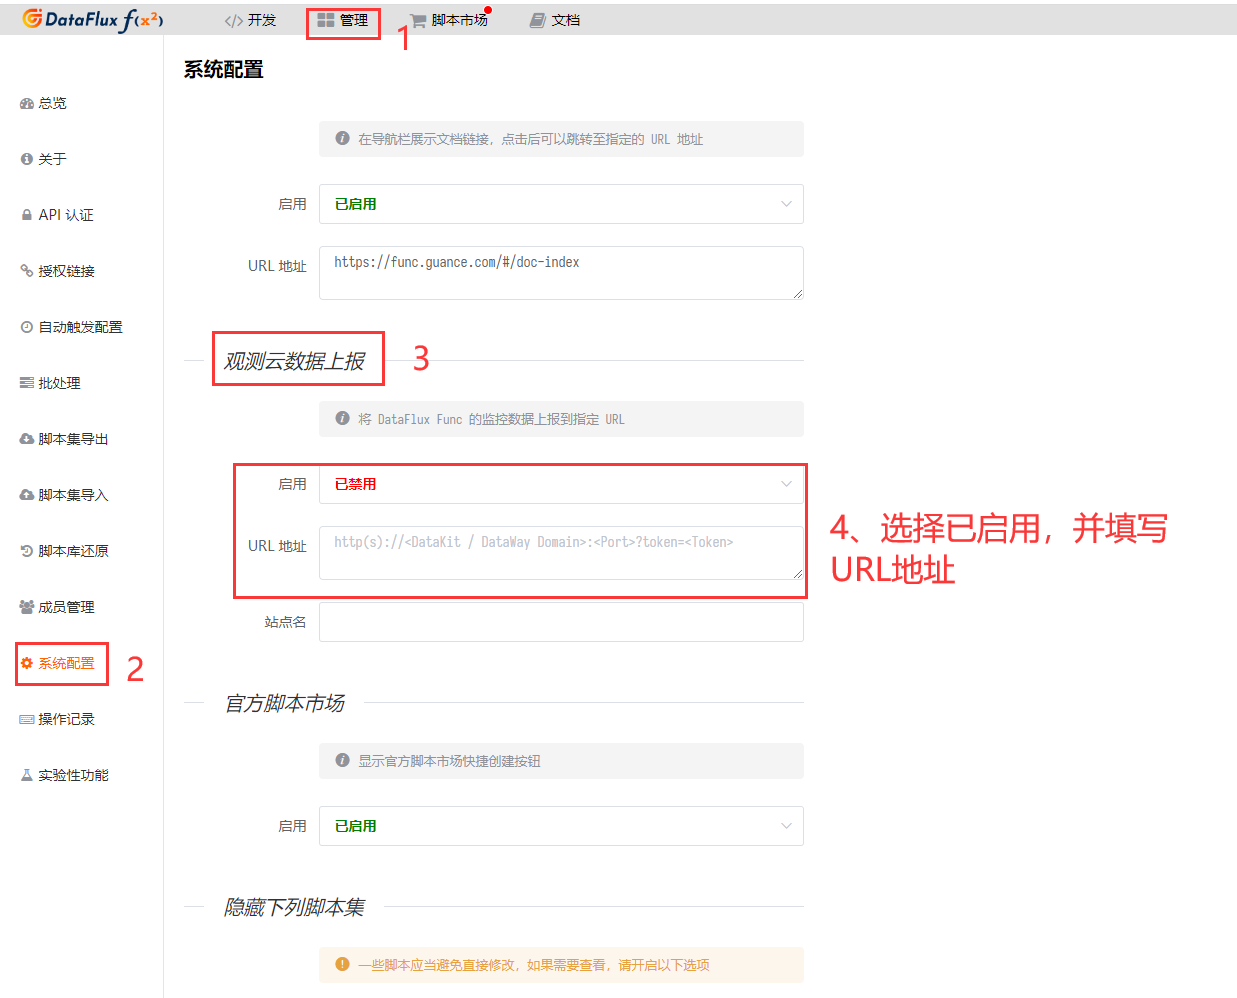
Fill in the DataWay / OpenWay address and Token information in the Guance data reporting section, the format is as follows:
Note: If Func data reporting fails, please check the DataFlux Func documentation
Business Monitoring Collection (Optional)
Private Func Deployment
Note: storageClass, MYSQL_HOST, MYSQL_USER, MYSQL_PASSWORD, MYSQL_DATABASE and other parameters
helm install func func --repo https://pubrepo.guance.com/chartrepo/func -n datakit  --create-namespace  \
    --set storage.pvc.enabled=true,storage.pvc.storageClass="xxxxxxxx" \
    --set mysql.enabled=false,func.MYSQL_HOST='xxxxxx' \
    --set func.MYSQL_USER=private_func,func.MYSQL_PASSWORD=xxxxx,func.MYSQL_DATABASE=private_func
Set up ingress
Set up the certificate in advance
apiVersion: networking.k8s.io/v1
kind: Ingress
metadata:
  name: xxx-private-func
  namespace: datakit
spec:
  ingressClassName: nginx
  rules:
    - host: xxx-private-func.guance.com
      http:
        paths:
          - backend:
              service:
                name: func-server
                port:
                  number: 8088
            path: /
            pathType: ImplementationSpecific
  tls:
    - hosts:
        - xxx-private-func.guance.com
      secretName: guance.com
Initialization
Access the domain name via browser, proceed to the next step
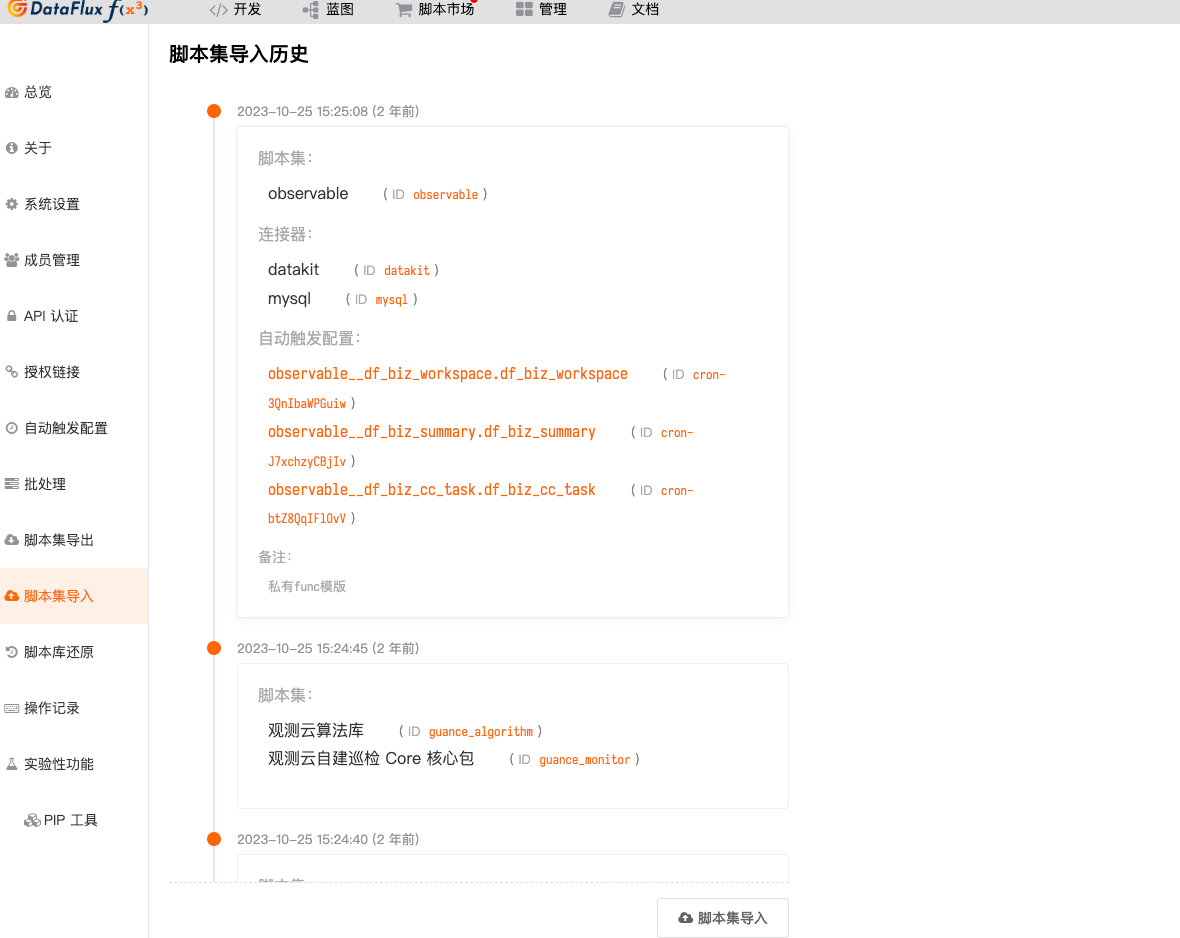
Import Scripts
Download Script Package
Access "Script Set Import" - "Script Import"
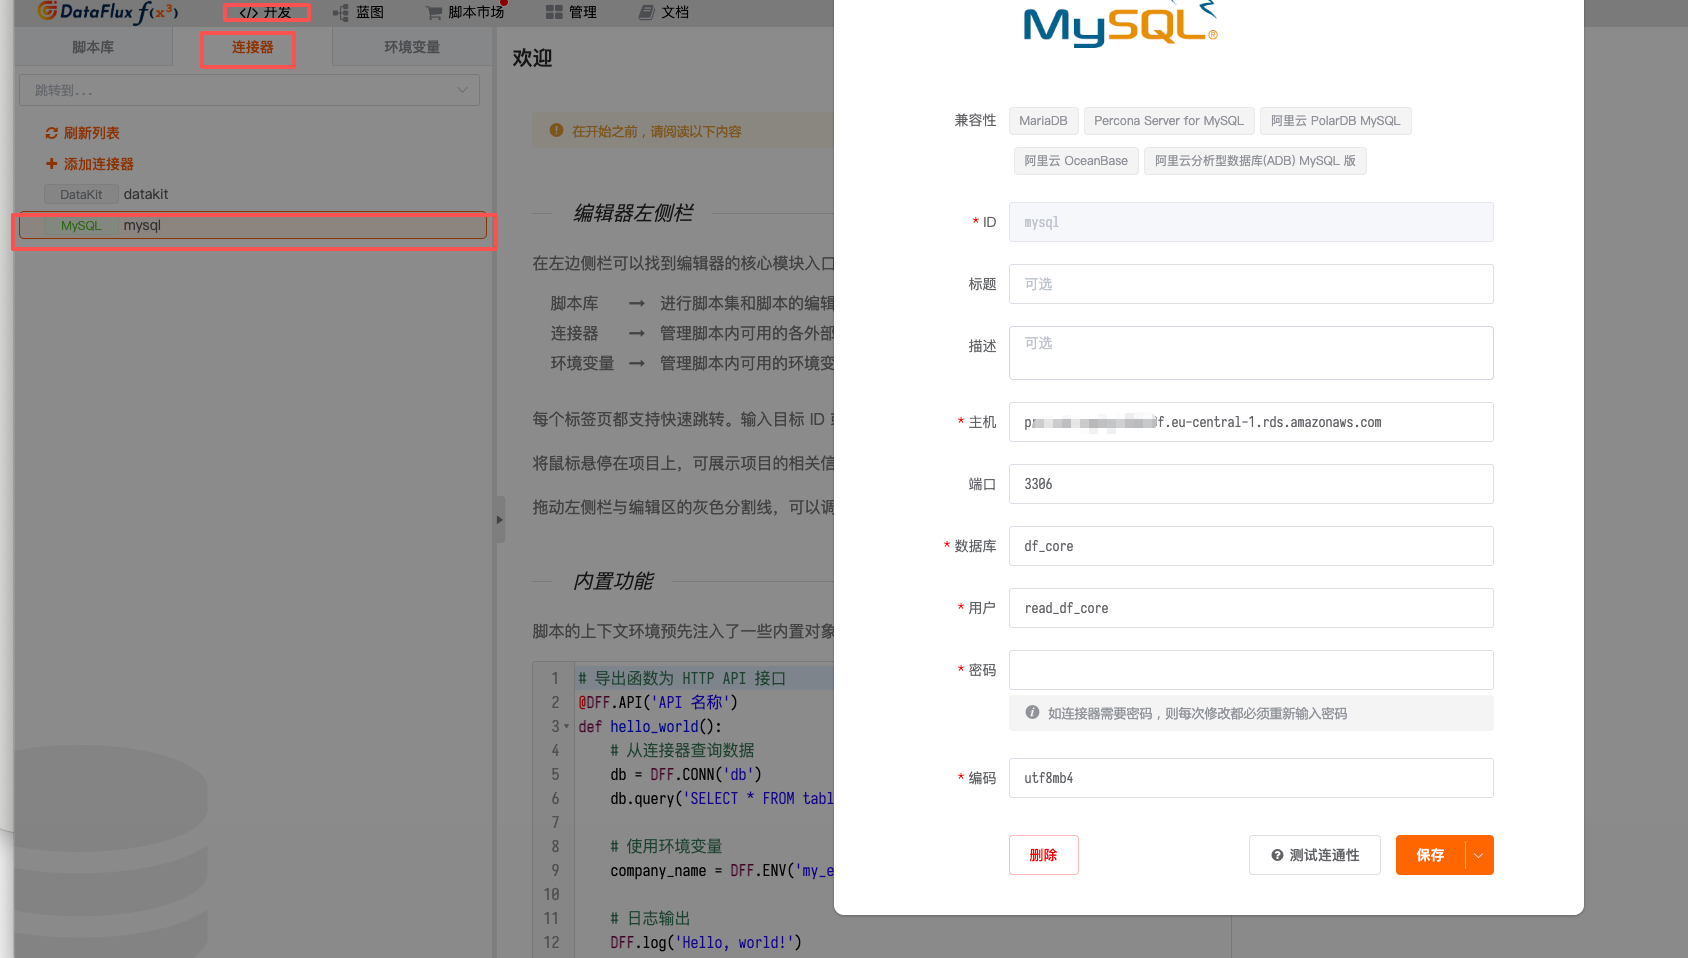
Modify Database Environment Variable Configuration
Fill in the 【Business Data Collection Account】 information
Verification Method
Need to switch the guance_site parameter
| Name | Verification Method | Verification Operation | |
|---|---|---|---|
| MySQL | DQL | M::mysql:(avg(max_connections)) { guance_site = 'xxx' } BY host |
|
| Redis | DQL | M::redis_info:(avg(maxmemory)) { guance_site = 'xxx' } BY host |
|
| PostgreSQL | DQL | M::postgresql_connection:(max(percent_usage_connections)) { guance_site = 'xxx' } |
|
| NSQD | DQL | M::nsq_topics:(max(message_count)) { guance_site = 'xxx' } BY topic |
|
| DataWay | DQL | M::dw:(max(dataway_cpu_cores)) { guance_site = 'xxx' } BY guance_site |
|
| Studio Trace | DQL | T::front-backend:(count(*)) { guance_site = 'xxx' } BY guance_site |
|
| Kodo-inner Trace | DQL | T::kodo-inner:(count(*)) { guance_site = 'xxx' } BY guance_site |
|
| Kodo Metrics | DQL | M::kodo_workers:(count(job_point_bytes_total), count(write_byte_total)) BY guance_site |
|
| Kodo X Metrics | DQL | M::kodo_x_workers:(count(job_point_bytes_total), count(write_byte_total)) BY guance_site |
|
| OpenSearch | DQL | M::elasticsearch:(max(indices_count)) { guance_site = 'xxx' } BY host |
|
| Kafka | DQL | M::kafka:(max(messages_in_per_sec)) { guance_site = 'xxx' } BY host |
|
| ZooKeeper | DQL | M::zookeeper:(max(outstanding_requests)) { guance_site = 'xxx' } BY host |
Troubleshooting Guide
Common Issues
-
Data Not Reporting
- Check DataKit status:
kubectl get pods -n datakit - Check DataKit logs:
kubectl logs -f <datakit-pod-name> -n datakit - Verify DataWay configuration: Ensure the ENV_DATAWAY value is correct
- Check DataKit status:
-
APM Traces Not Showing
- Check application environment variables:
kubectl describe deploy <deployment-name> -n <namespace> - Verify ddtrace-run injection:
kubectl get deploy <deployment-name> -o yaml -n <namespace> | grep args - Check trace agent connectivity
- Check application environment variables:
-
RUM Data Not Collected
- Verify front-web-config ConfigMap:
kubectl get configmap front-web-config -o yaml -n forethought-webclient - Check browser console for RUM SDK loading errors
- Validate RUM application configuration in Guance workspace
- Verify front-web-config ConfigMap:
-
Synthetic Tests Failing
- Verify target URLs are accessible
- Check network connectivity between test nodes and target services
- Validate synthetic test configuration
Performance Optimization
-
DataKit Resource Allocation
- Adjust CPU/memory limits based on data volume
- Consider dedicated nodes for DataKit deployment
-
Storage Optimization
- Configure appropriate retention policies
- Monitor storage usage regularly
-
Network Optimization
- Ensure efficient data transmission between components
- Consider compression for large data volumes
Maintenance Procedures
Regular Checks
-
Daily
- Check system health status
- Review critical alerts
- Verify data collection status
-
Weekly
- Review performance metrics
- Check storage capacity
- Validate backup procedures
-
Monthly
- Review security configurations
- Update components as needed
- Perform comprehensive system audit
Backup and Recovery
-
Configuration Backup
- Export important configurations regularly
- Store backups in secure location
-
Data Backup
- Implement regular database backups
- Test restoration procedures
-
Disaster Recovery
- Maintain recovery documentation
- Conduct periodic recovery drills
Security Considerations
Access Control
-
Role-Based Access
- Implement least privilege principle
- Regular access reviews
-
Authentication
- Strong password policies
- Multi-factor authentication where possible
-
Network Security
- Secure service communications
- Firewall configuration review
Data Protection
-
Encryption
- Encrypt sensitive data
- Secure transmission channels
-
Audit Logging
- Maintain comprehensive audit trails
- Regular log review
-
Compliance
- Ensure regulatory compliance
- Maintain documentation
Update and Upgrade
Version Management
-
Component Updates
- Regular version reviews
- Test updates in staging environment
-
Upgrade Procedures
- Follow official upgrade guides
- Maintain rollback capability
-
Documentation Updates
- Keep documentation current
- Document all changes
Best Practices
-
Change Management
- Formal change control process
- Impact assessment for changes
-
Monitoring
- Continuous system monitoring
- Proactive alert response
-
Documentation
- Maintain current runbooks
- Knowledge sharing
Support Resources
Documentation
Community Support
Professional Services
- Technical support contacts
- Consulting services
- Training programs
Conclusion
Implementing comprehensive observability for your Guance deployment ensures reliable operation and quick issue resolution. This guide provides the foundation for monitoring your environment effectively. Regular maintenance and adherence to best practices will help maintain optimal performance and reliability.
For additional assistance or specific scenarios not covered in this document, please refer to the official documentation or contact support services.
Remember to: * Regularly review and update your monitoring configuration * Stay informed about new features and best practices * Participate in community discussions for shared learning * Maintain security and compliance standards
This concludes the observability implementation guide for Guance deployment edition.