Event Details
In the Unrecovered Events, All Events, and Change Events lists, click any event data entry to view the event details, including basic attributes, extended fields, alert notifications, history records, and more.
Basic Attributes
Detection Dimensions
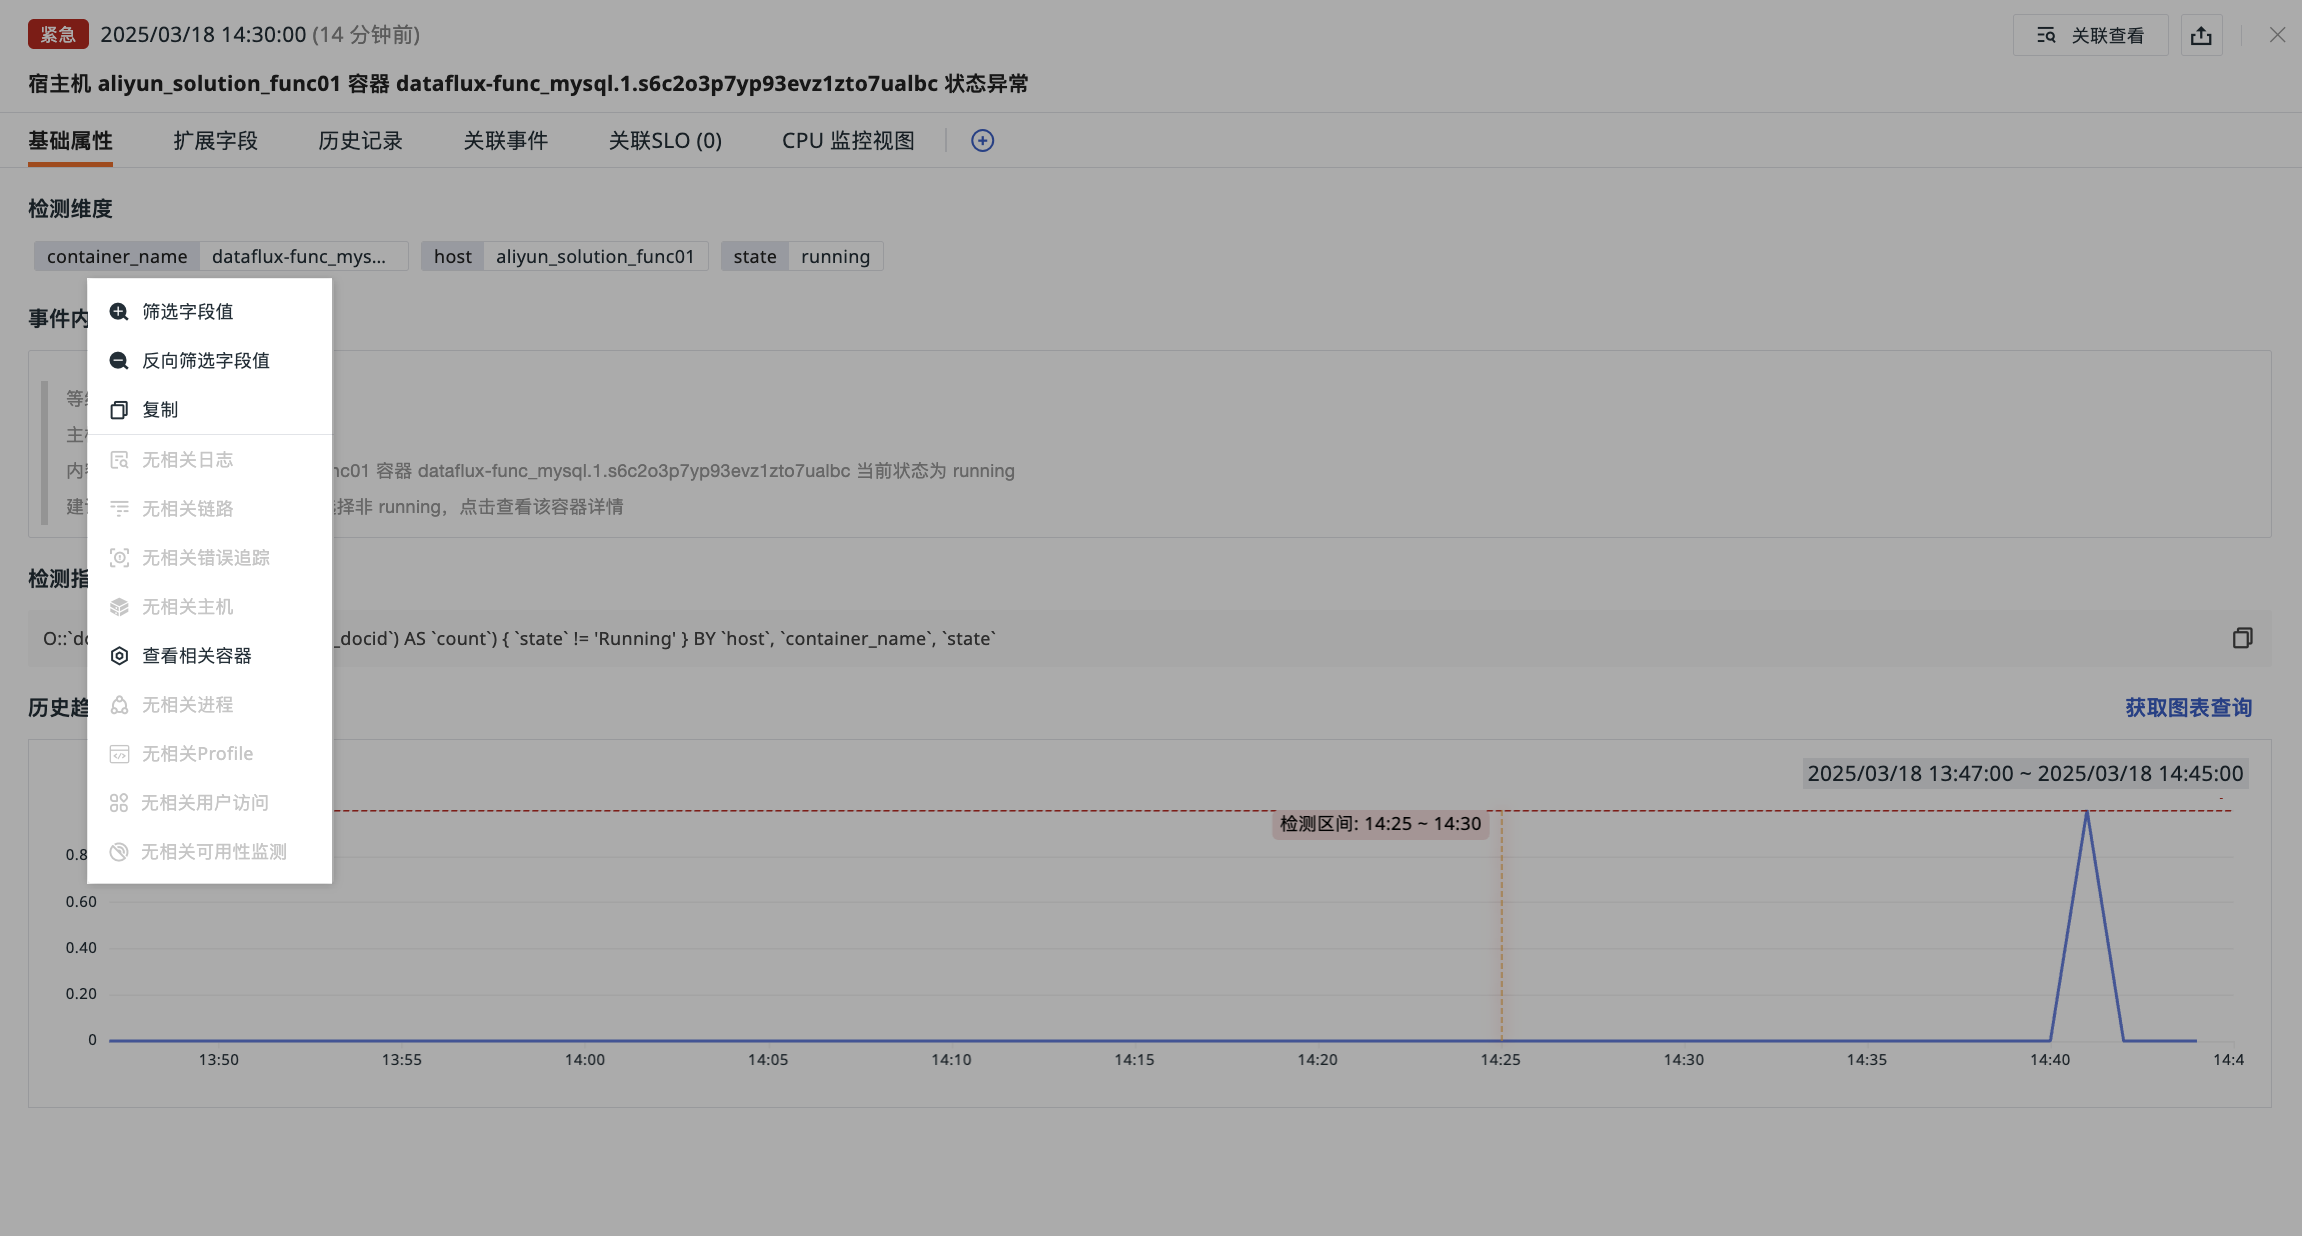
Specific attributes used to identify and classify events during event detection. Click a dimension tag to view related detection content. The following operations are supported:
-
Filter by field value: Filter based on the detection dimension field value to view event data related to this field;
-
Exclude field value: Reverse-filter based on the detection dimension field value to view event data other than this field;
-
Copy: Copy the tag content to the clipboard.
Event Content
Event content is determined by the event source:
-
Rule monitor events are generated based on the event content defined on the monitor configuration page;
-
Smart monitoring events display the event content saved when creating or editing the monitor;
-
AI monitor event reports are generated by AI at each execution based on the detection Prompt and related observability data, and can display structured analysis information such as problem summary, confidence level, supporting evidence, impact scope, diagnosis, and recommended actions.
Analysis Report
Smart monitoring events provide an analysis report for the current detection. If multiple rules are triggered in the same detection, the system consolidates and merges the matched rules into one report, displaying anomaly summary, rule details, monitoring signals, current values, judgment basis, anomaly causes, and related trends by detection dimension. The actual displayed content varies with the smart monitor type and the matched rules.
Detection Metrics
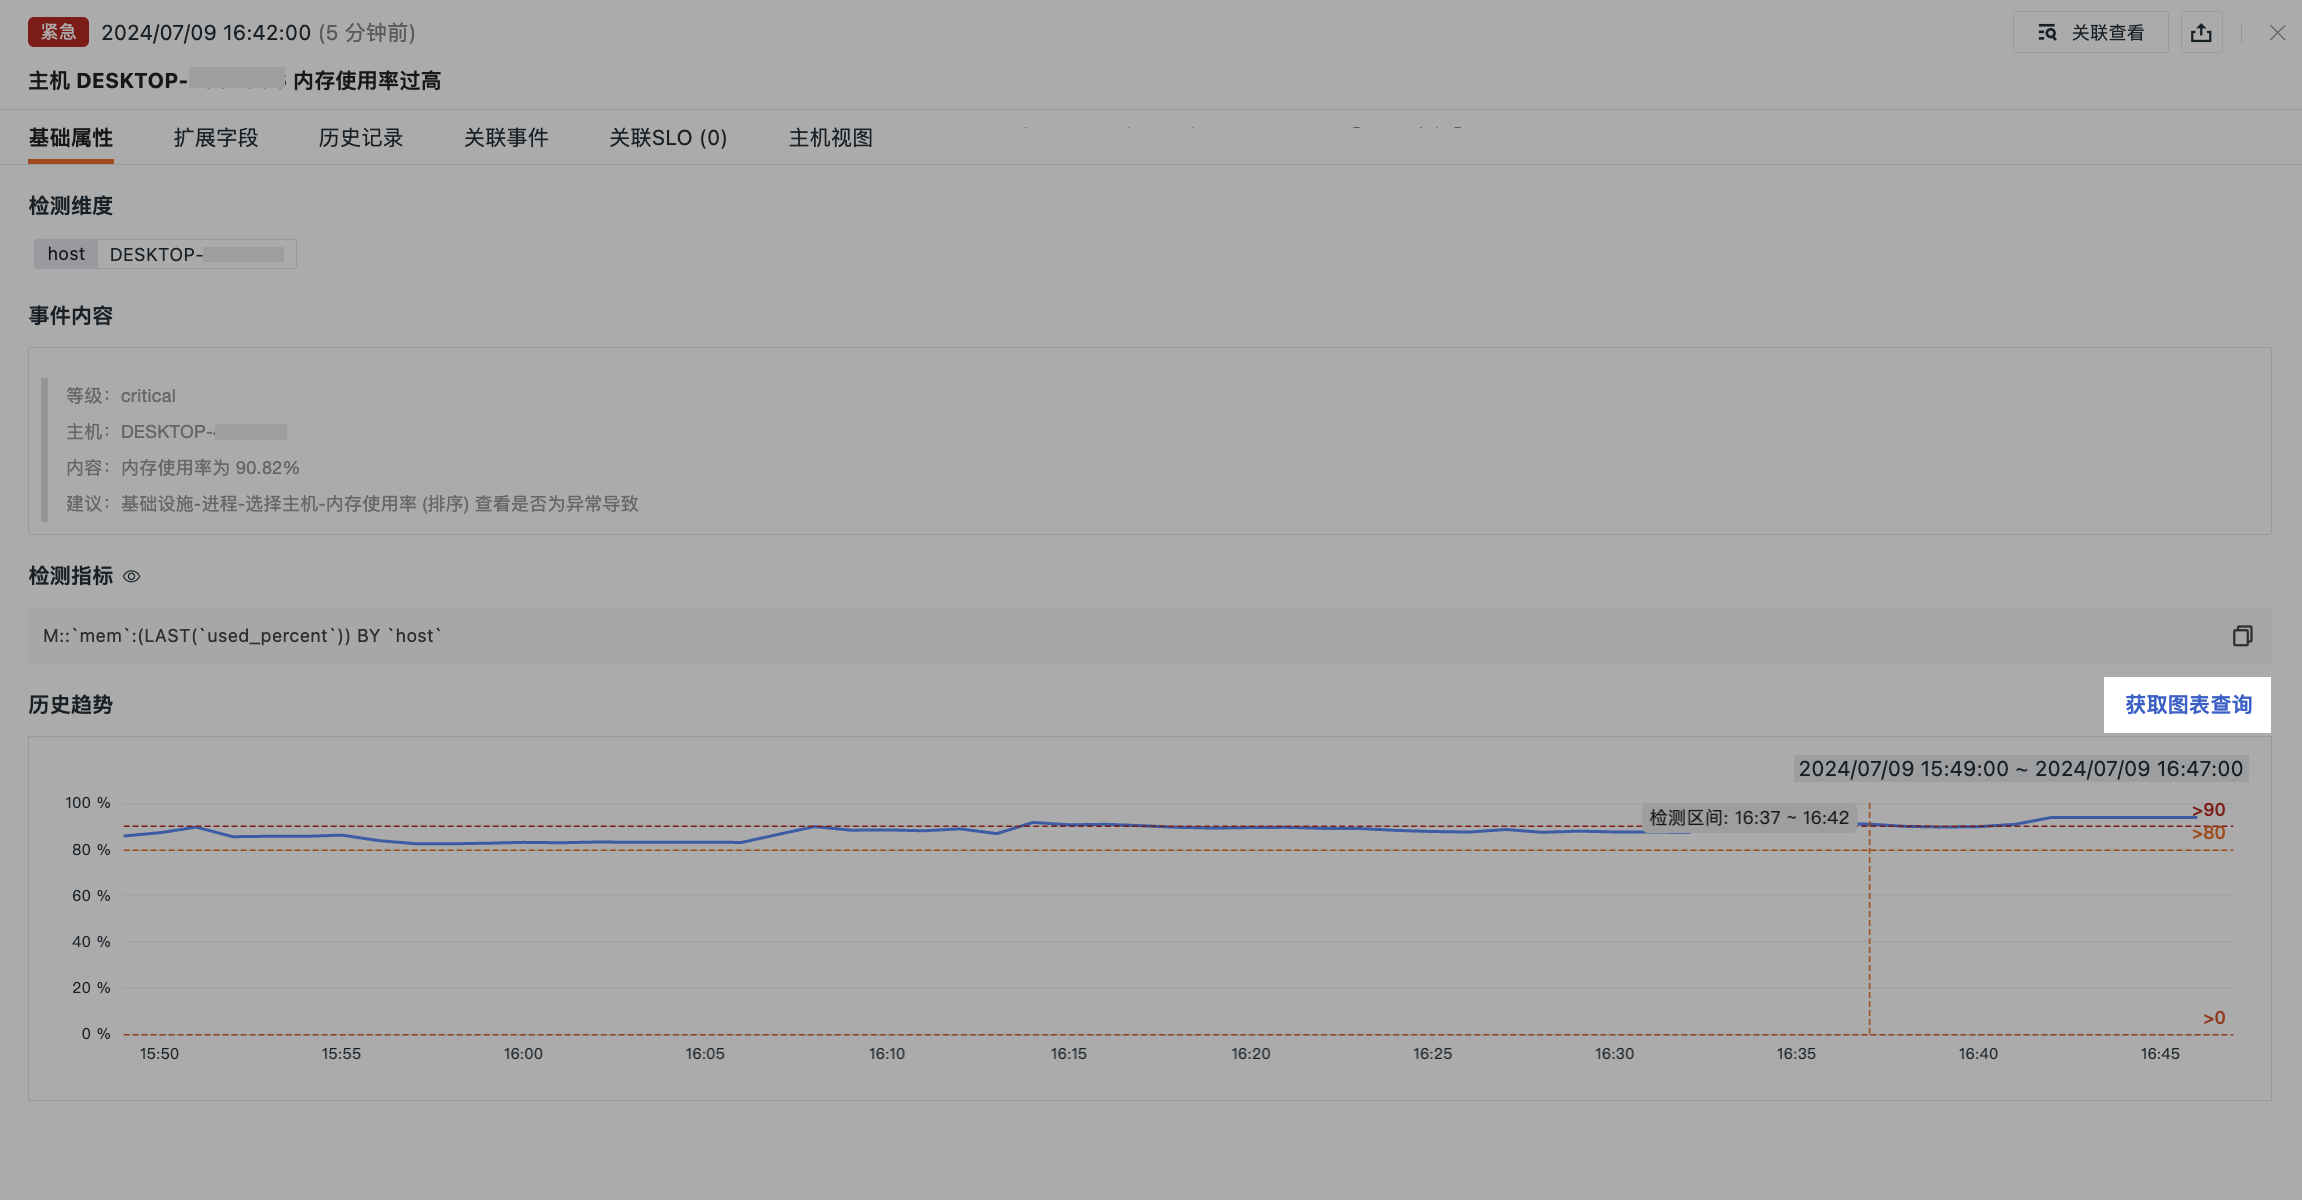
The detection metric query statement configured when setting up the monitor, showing the specific query logic at the time the event was triggered.
Historical Trend
Displays the historical trend of the current event's detection result values, including the trigger threshold reference line and detection interval markers. Click Get Chart Query to obtain the current query statement for reproducing the chart in a dashboard or note.
Extended Fields
View and manage the attribute fields contained in this event data:
-
Enter a field name or value in the search bar to quickly search and locate;
-
After enabling a field alias, view it after the field name;
-
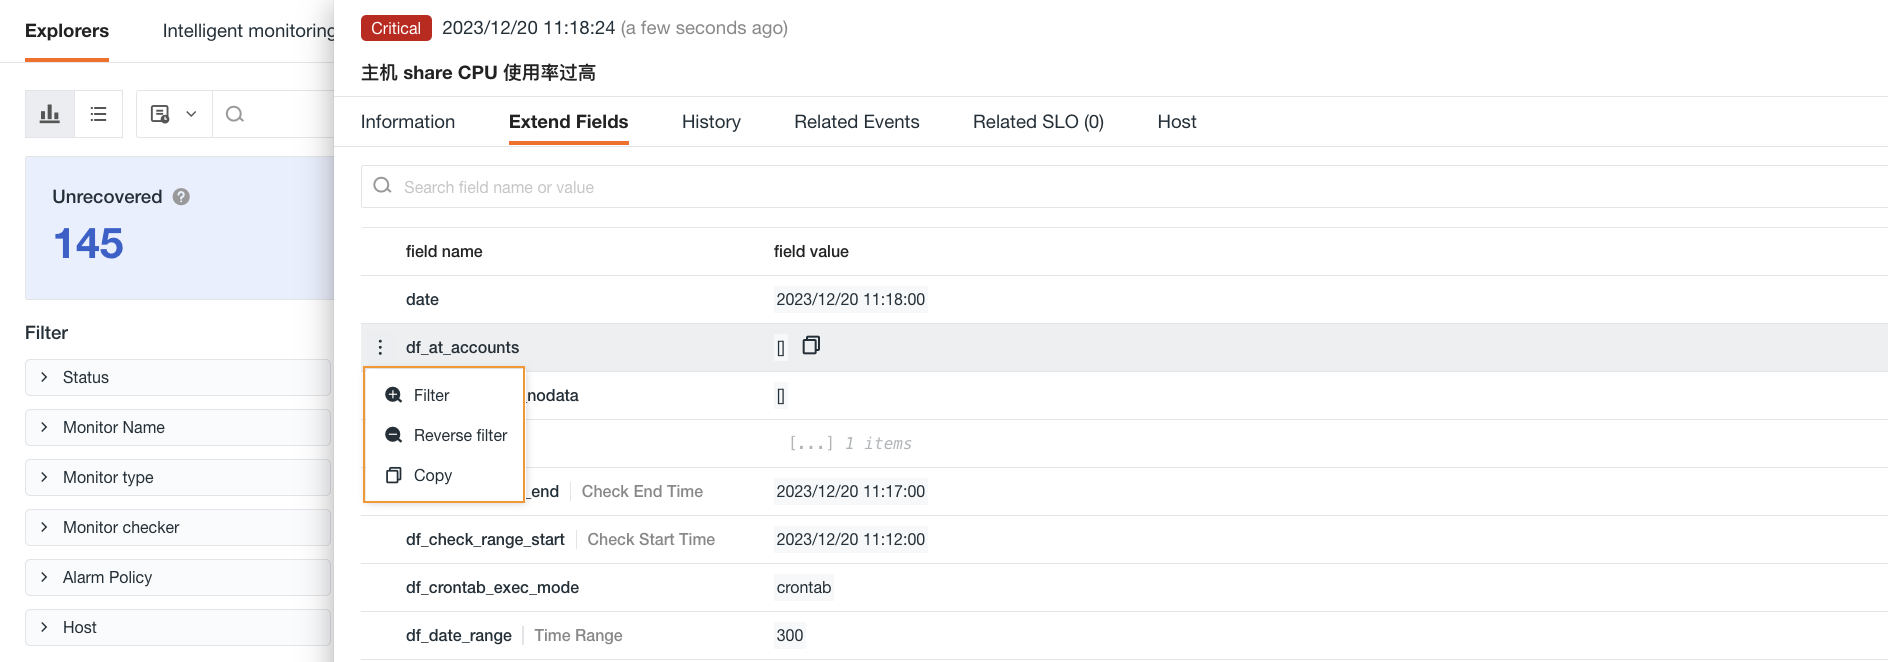
Each field supports filtering by field value, excluding field value, and copying:
Field |
Attribute |
|---|---|
| Filter by field value | Adds the field to the Explorer search bar to view all data related to this field |
| Exclude field value | Adds the field to the Explorer search bar to view all data other than this field |
| Copy | Copies the field to the clipboard |
Alert Notifications
Displays information such as notification target type and notification target name. Click to expand and view the detailed information of the alert notification target; hover to copy.
History
Displays the host of the detected object, the anomaly/recovery time, and the duration.
Click a data entry to open the corresponding Explorer, which automatically applies df_fault_id for query filtering, allowing you to view the complete lifecycle of the same fault.
Related Events
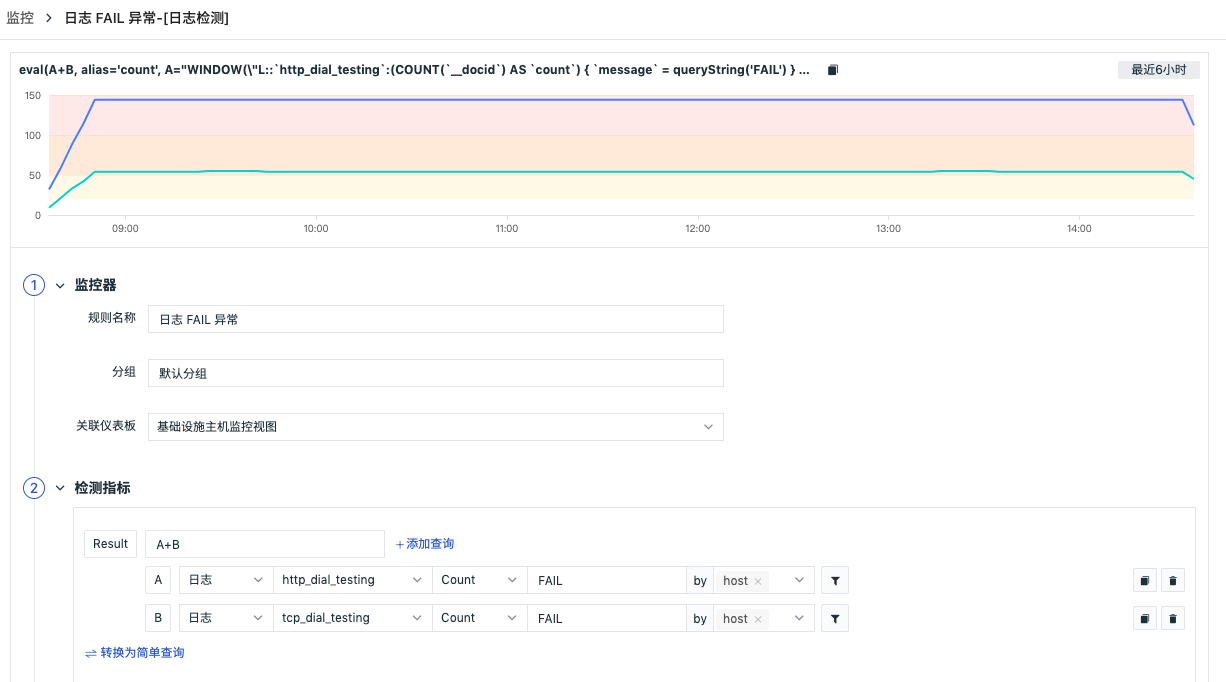
Supports viewing related events within a specified time range based on four filter fields, helping to locate the root cause and impact scope of a fault:
| Filter field | Field name | Description |
|---|---|---|
| Same fault ID | df_fault_id |
Special ID tag used to record the complete process of a detection dimension from anomaly trigger to recovery |
| Same monitor | df_monitor_checker_id |
Other events generated by the same detection rule |
| Same detection dimension | df_dimension_tags |
Other events of the same detected object |
| Same level | df_status |
Other events at the same alert level |
Related SLO
If an SLO is configured in the monitor, you can view related SLO information, including SLO name, monitor, success rate, error budget, target, and more.
Related Queries
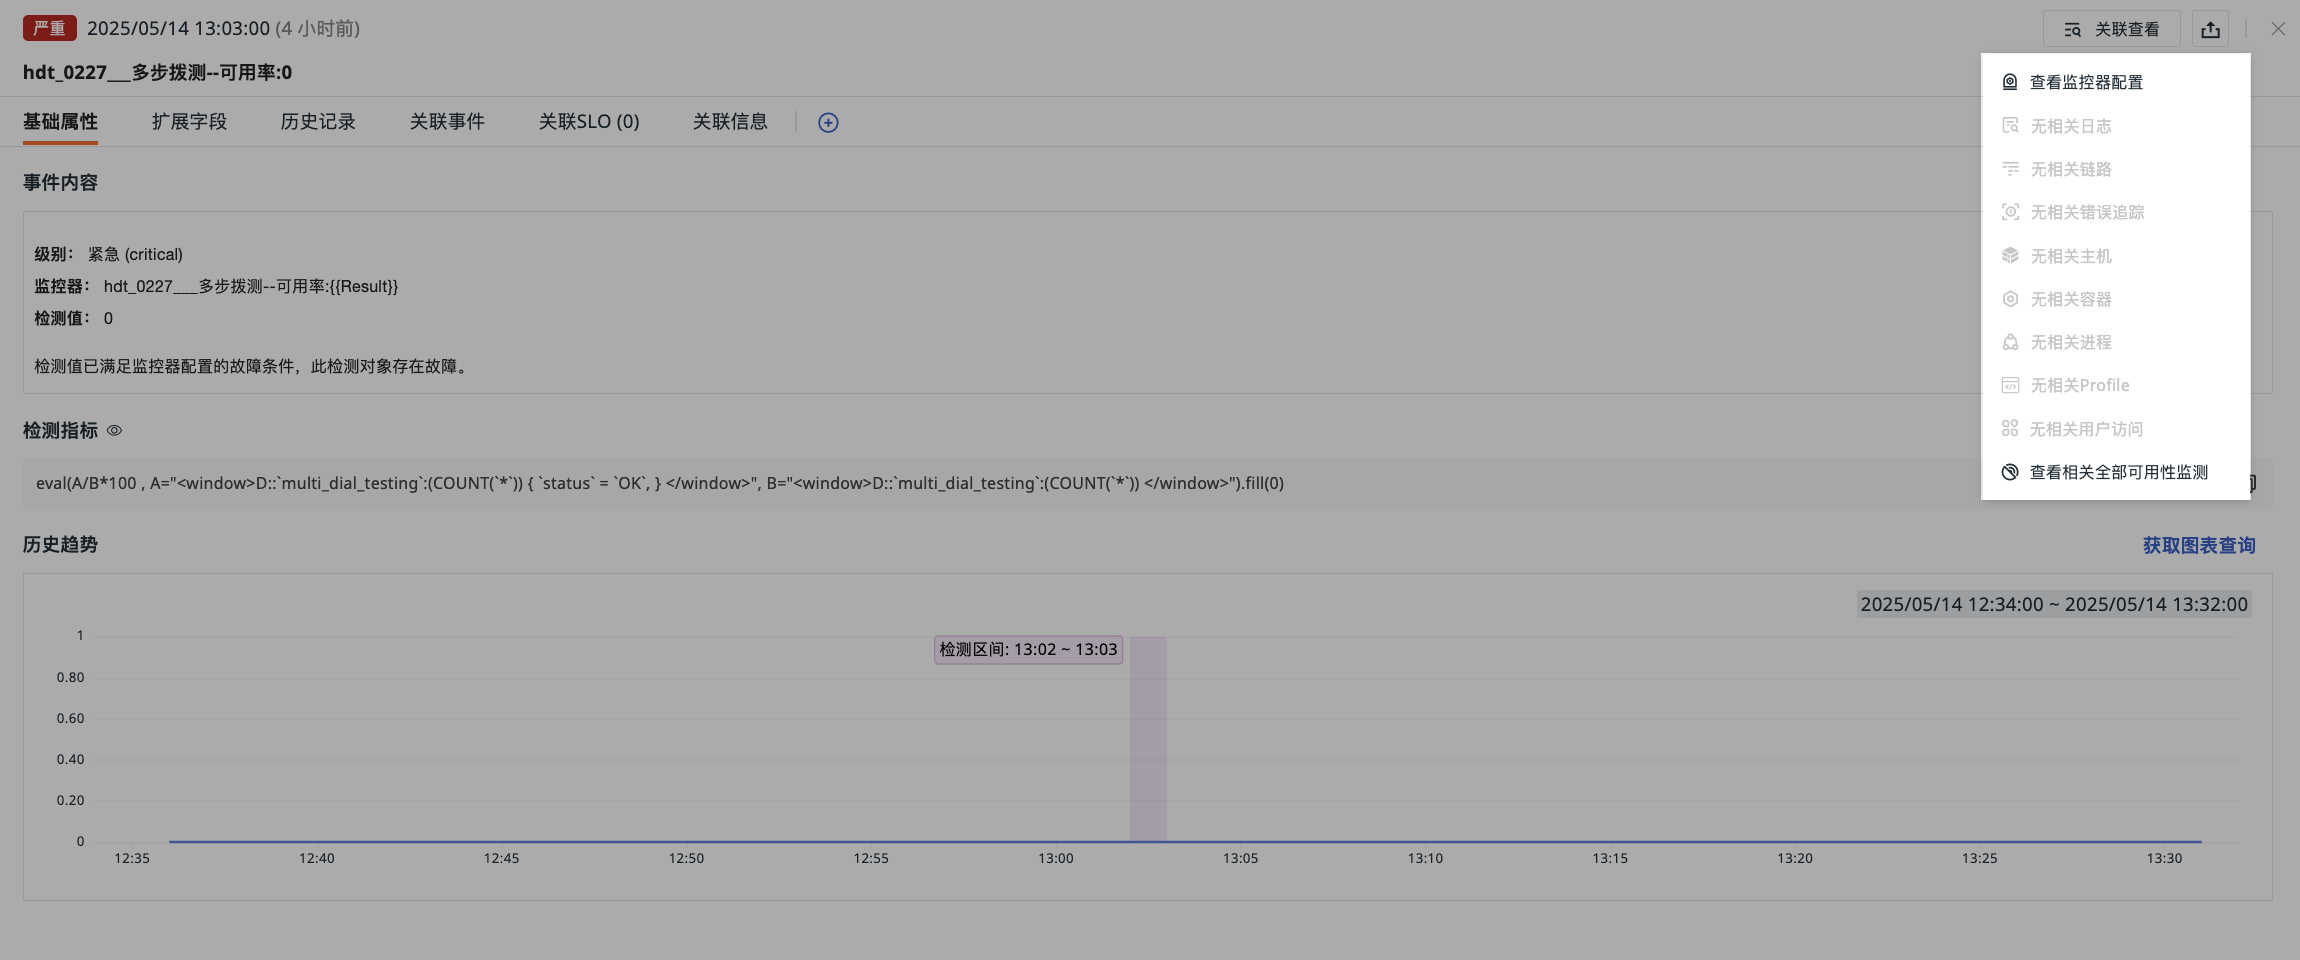
In Related Queries, you can view all queries associated with the current event, including:
-
View monitor configuration
-
Related logs, traces, error tracking, hosts, containers, processes, profiles, RUM, Synthetic Monitoring, etc.
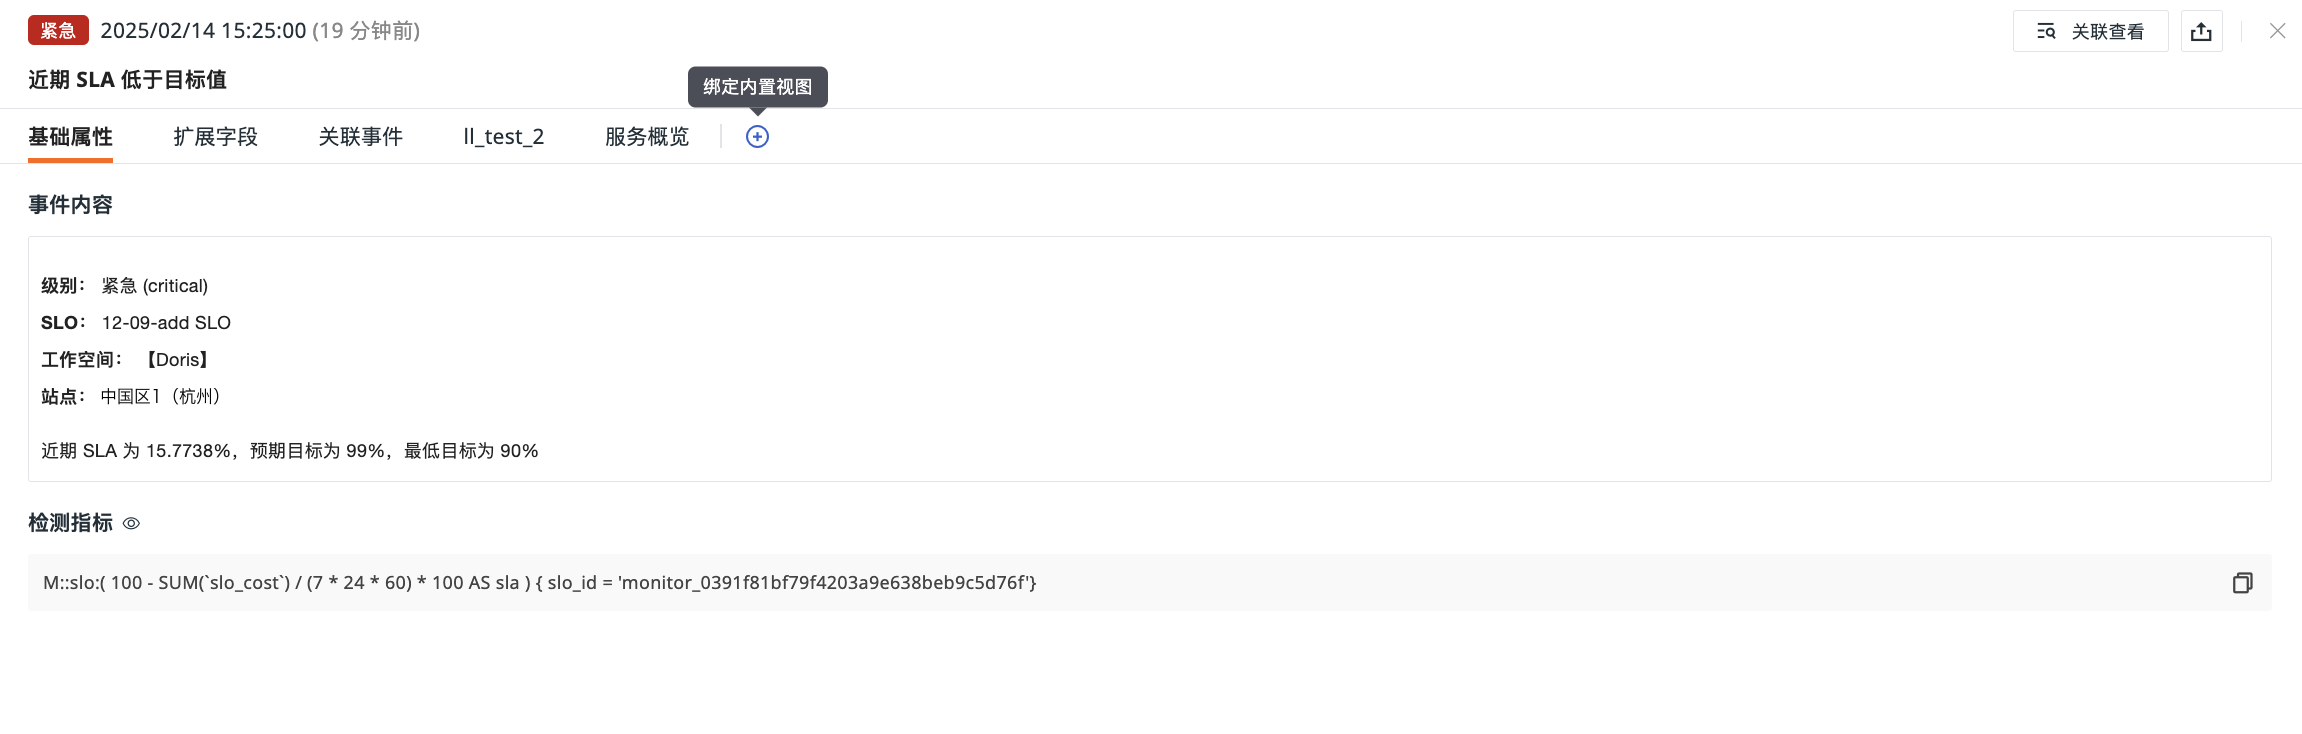
Bind Built-in View
Supports binding a built-in view (user view) to the event details page. Click Bind Built-in View to add a new view to the current event details page.
Obsy Copilot AI Analysis
Events triggered based on monitor detection rules can be directly analyzed by Obsy Copilot, providing AI-assisted fault diagnosis recommendations.