Funnel Analysis
Funnel analysis is a data analysis model used to visualize and quantify user conversion through a series of predefined steps. By capturing user session data, it presents user behavior in key workflows step by step, forming a funnel shape that narrows from top to bottom. User retention and drop-off at each step are clear at a glance, helping analysts intuitively monitor the success rate of business processes and identify friction points that may cause user churn.
Use Cases
- Web page browsing optimization: Analyze user conversion paths from the homepage to target pages to optimize page layout and content.
- E-commerce conversion improvement: Monitor conversion rates at each stage of the shopping process, identify and improve drop-off stages, and increase purchase completion rates.
- Application feature improvement: Evaluate how users complete tasks within the application, optimize the feature experience, and improve user retention.
Configure
First select a workspace scope, then choose an application from the candidate list. Available applications come from the selected authorized workspaces on the same site. The funnel only counts data from the current application and its source workspace; user journeys from different workspaces or different applications are not merged. The same User ID or Session ID is not used to merge conversion processes across applications.
Application options also display the workspace name. Applications across workspaces with the same name or the same application ID are identified separately. After switching the workspace scope, the current application is retained if it remains valid; otherwise, select an application again. If no valid application is available, funnel analysis is not performed. For authorization and read-only conditions, see Cross-Workspace Query Documentation.
1. Define Conversion Steps
Two step types are provided by default: View and Action.
- Click the copy button on the right of a step to duplicate and add the current step directly.
- Add more steps as needed (❗️ up to 10 steps can be added).
- Reset steps as needed.
Operators
| Type | Operator | Description |
|---|---|---|
| View | is | i.e., = |
| not is | i.e., ≠ |
|
| contains | i.e., match |
|
| matches regex | i.e., regex query |
|
| Action | is | |
| contains |
2. Filter User Scope
Determine the scope of session data using filter conditions such as city, environment, version, browser, session duration, and the first page path of the session.
Click "More" to search and add more filter conditions.
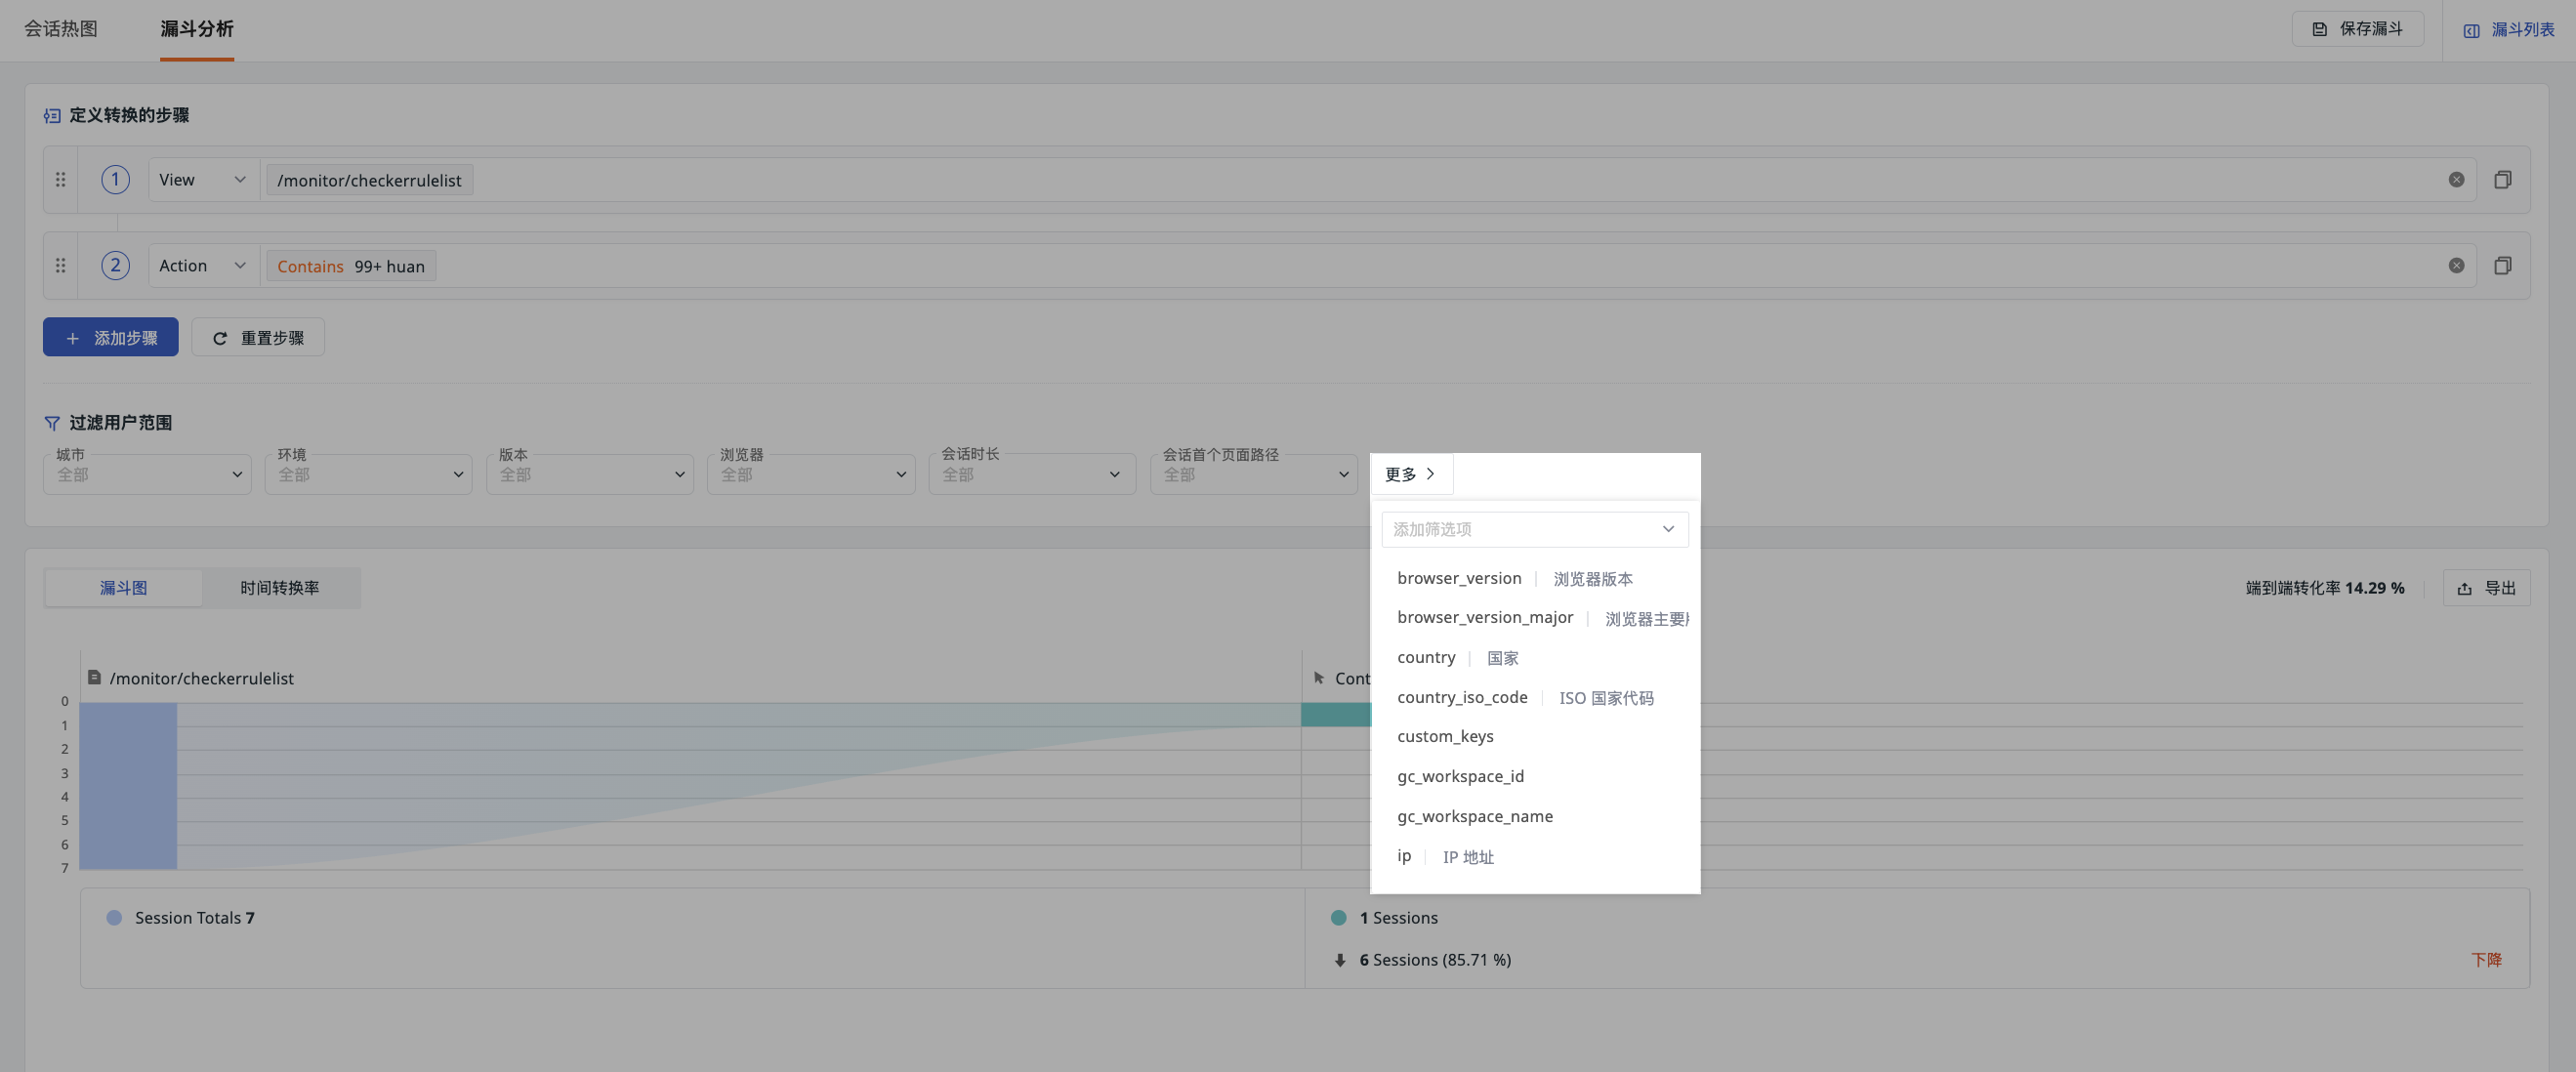
Funnel Chart
Visualize end-to-end conversion rates in a chart.
As shown below, in the RUM application list, out of 10 sessions, 1 session eventually performed the Export action, giving this behavior a conversion rate of 10%.

- This chart can be exported to a dashboard/notes or as a PNG image.
- Click the right side of a Session to jump to Session Replay.
When opening Session Replay from cross-workspace results, playback follows the source workspace of the session. The source workspace must match the selected application. If source information is missing, the replay cannot be played. After returning to the funnel, the original workspace scope and application selection are retained.
For more details, see Web Session Replay
Drop-off Statistics Between Steps
The funnel chart displays the number of dropped sessions and the drop-off rate between each pair of adjacent steps:
- Dropped count: The number of Sessions that completed up to the current step in order but did not continue to complete the next step.
- Drop-off rate: The dropped count divided by the cumulative Session count of the current step.
- When the cumulative count of the current step is 0, the dropped count is 0 and the drop-off rate is displayed as
-.
If the same Session matches the same step multiple times, it is counted only once. Steps must be completed in the chronological order of events. Other events are allowed between steps, and the events involved in matching must fall within the current query time range.
View Dropped Sessions
- In the funnel chart, locate the adjacent steps you want to analyze.
- Click "View Dropped Sessions" in the drop-off area.
- On the opened Session Replay page, view the dropped Session list on the left.
- Select a Session and view the corresponding Session Replay on the right.
The list displays the Session ID, occurrence time, session duration, and replay availability status. It is sorted by Session start time in descending order by default, with 50 entries per page. More records are loaded by scrolling. The most recent Session is selected by default, and you can switch sessions within the same dropped session set.
When no replay data is available, the page shows "No Session Replay data available". If the query fails, times out, or the results expire, re-run the query as prompted.
Usage Limits
- Only drop-off analysis between adjacent steps is supported. Set-difference queries between any two arbitrary steps are not supported, and the cause of drop-off is not automatically determined.
- When the dropped count is 0, the details entry is not clickable.
- Viewing dropped Session details and Session Replay requires the Session Replay permission.
- External share pages do not display the Session ID, drop-off details, or the Session Replay entry.
- After modifying steps, their order, the time range, the application, or filter conditions, re-run the query with the new conditions.
Conversion Rate Over Time
Conversion behavior can also be presented and evaluated through time trends.