Trace List
The system provides three types of trace viewing lists: All Spans, Service Entry Spans, and All Traces.
A Span represents a logical unit of work within a distributed system over a given time period, and multiple Spans form a trace trajectory (trace).
Displays all collected Span data within the currently selected time range.
Filters and displays all Spans generated by service entry calls within the currently selected time range.
Filters and displays all top-level entry Spans for chain calls within the currently selected time range.
Chart Statistics
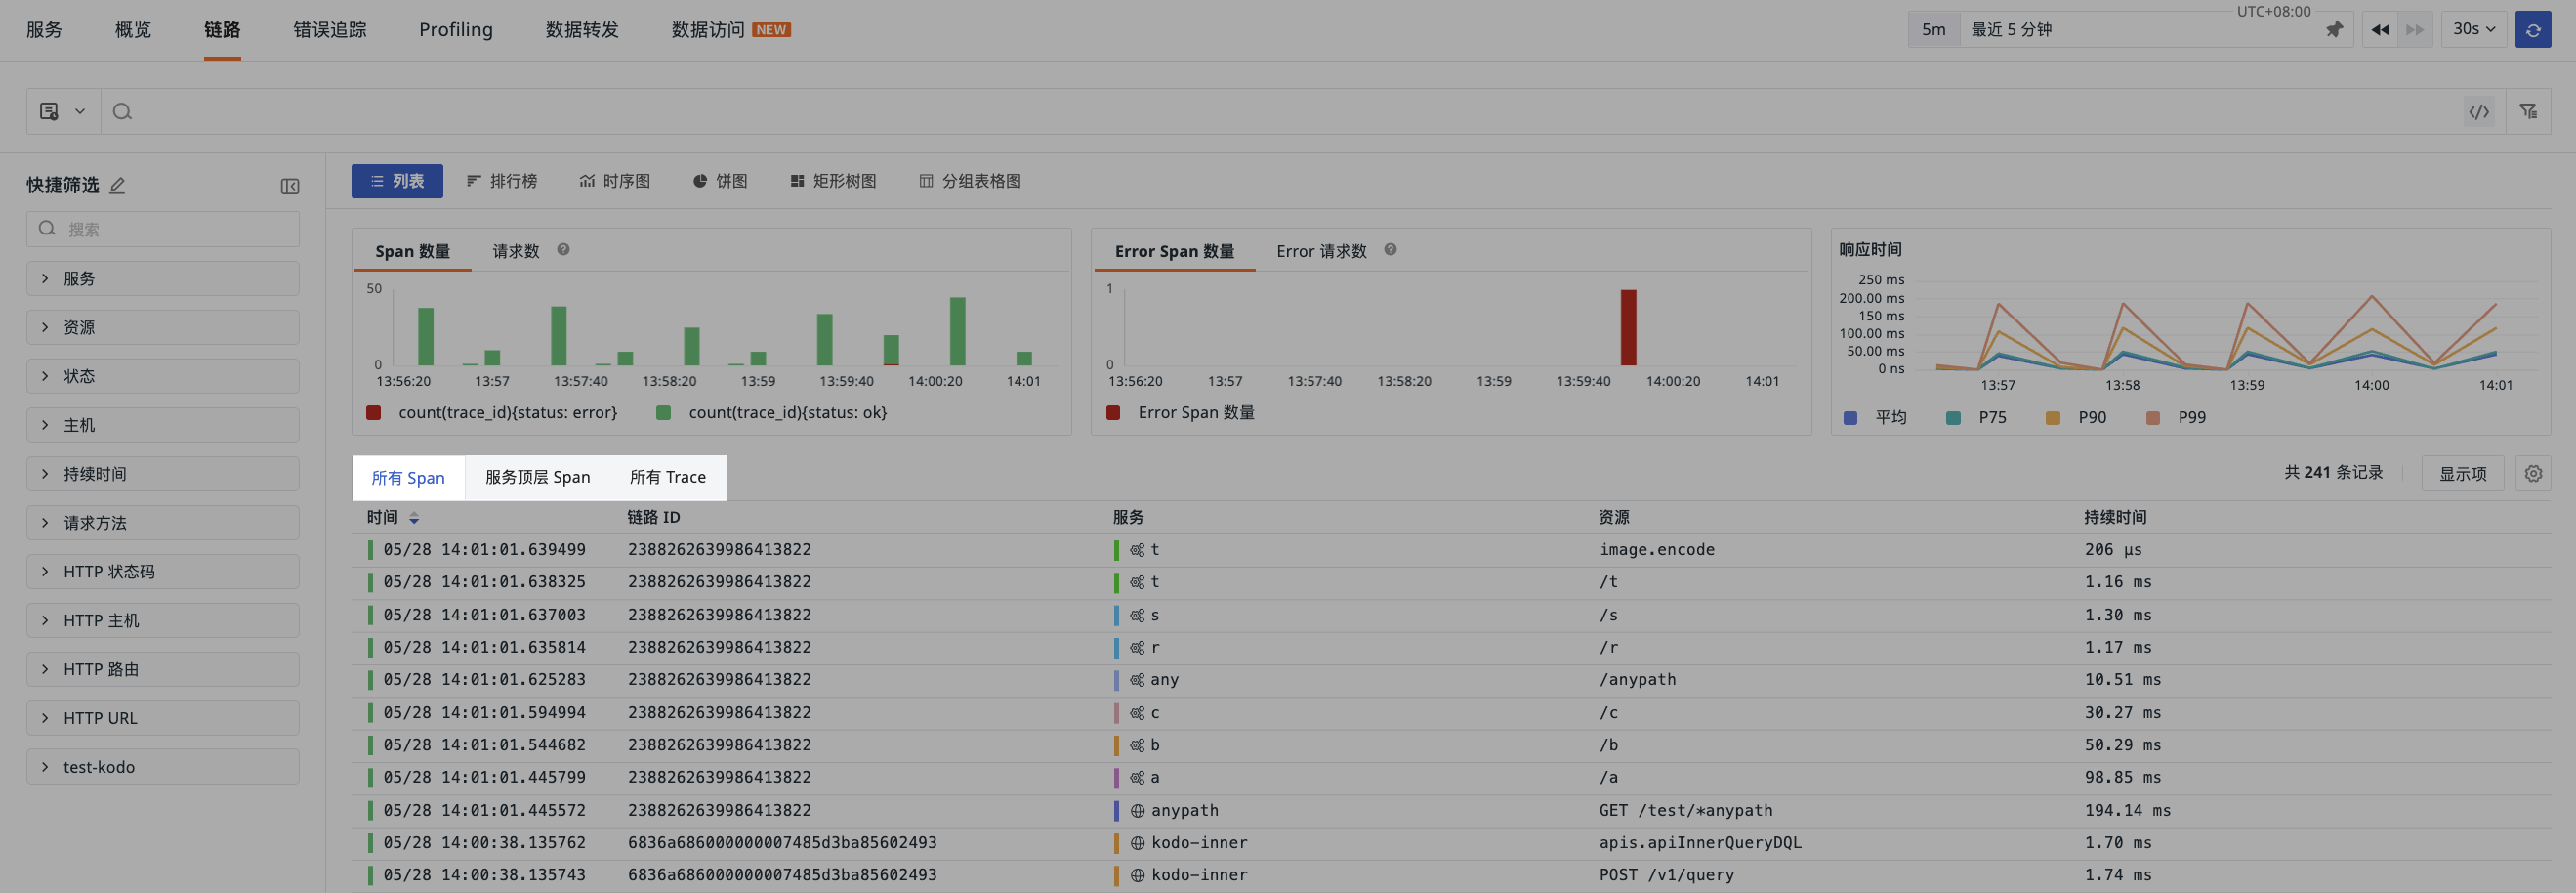
In the chart statistics of the trace Explorer, you can view key Metrics for different states of traces within the selected time range:
- Request Count
- Error Request Count
- Response Time
These Metrics can be displayed synchronously on the chart via filtering functions. The specific statistical methods are as follows:
- Request Count/Error Request Count: Divided into 60 time points according to the time range, displayed via bar charts;
- Response Time: Divided into 60 time points according to the time range, displayed via line charts showing the average response time per second, P75, P90, and P99 response times.
Export
After filtering out the required trace data, you can export it in the following formats:
- CSV file
- JSONL file
- Export to Scenario > Dashboard/Note
If you need to export a particular data point, open the details page of that data, and click the icon at the top right corner.