Dashboard Management
For all dashboards in the current workspace, you can manage them through the following operations.
Tag Permissions
Use tags to uniformly control the viewing and management permissions of dashboards, suitable for scenarios where batch authorization is needed by project, team, or environment.
Note
-
Tag permissions are additional rules and do not change the original permission settings of the dashboard.
-
The final permission of a dashboard is the union of its "own permissions" and "all tag permissions".
-
If the dashboard itself is set to "Public" or "Visible only to me", tag permissions will no longer apply.
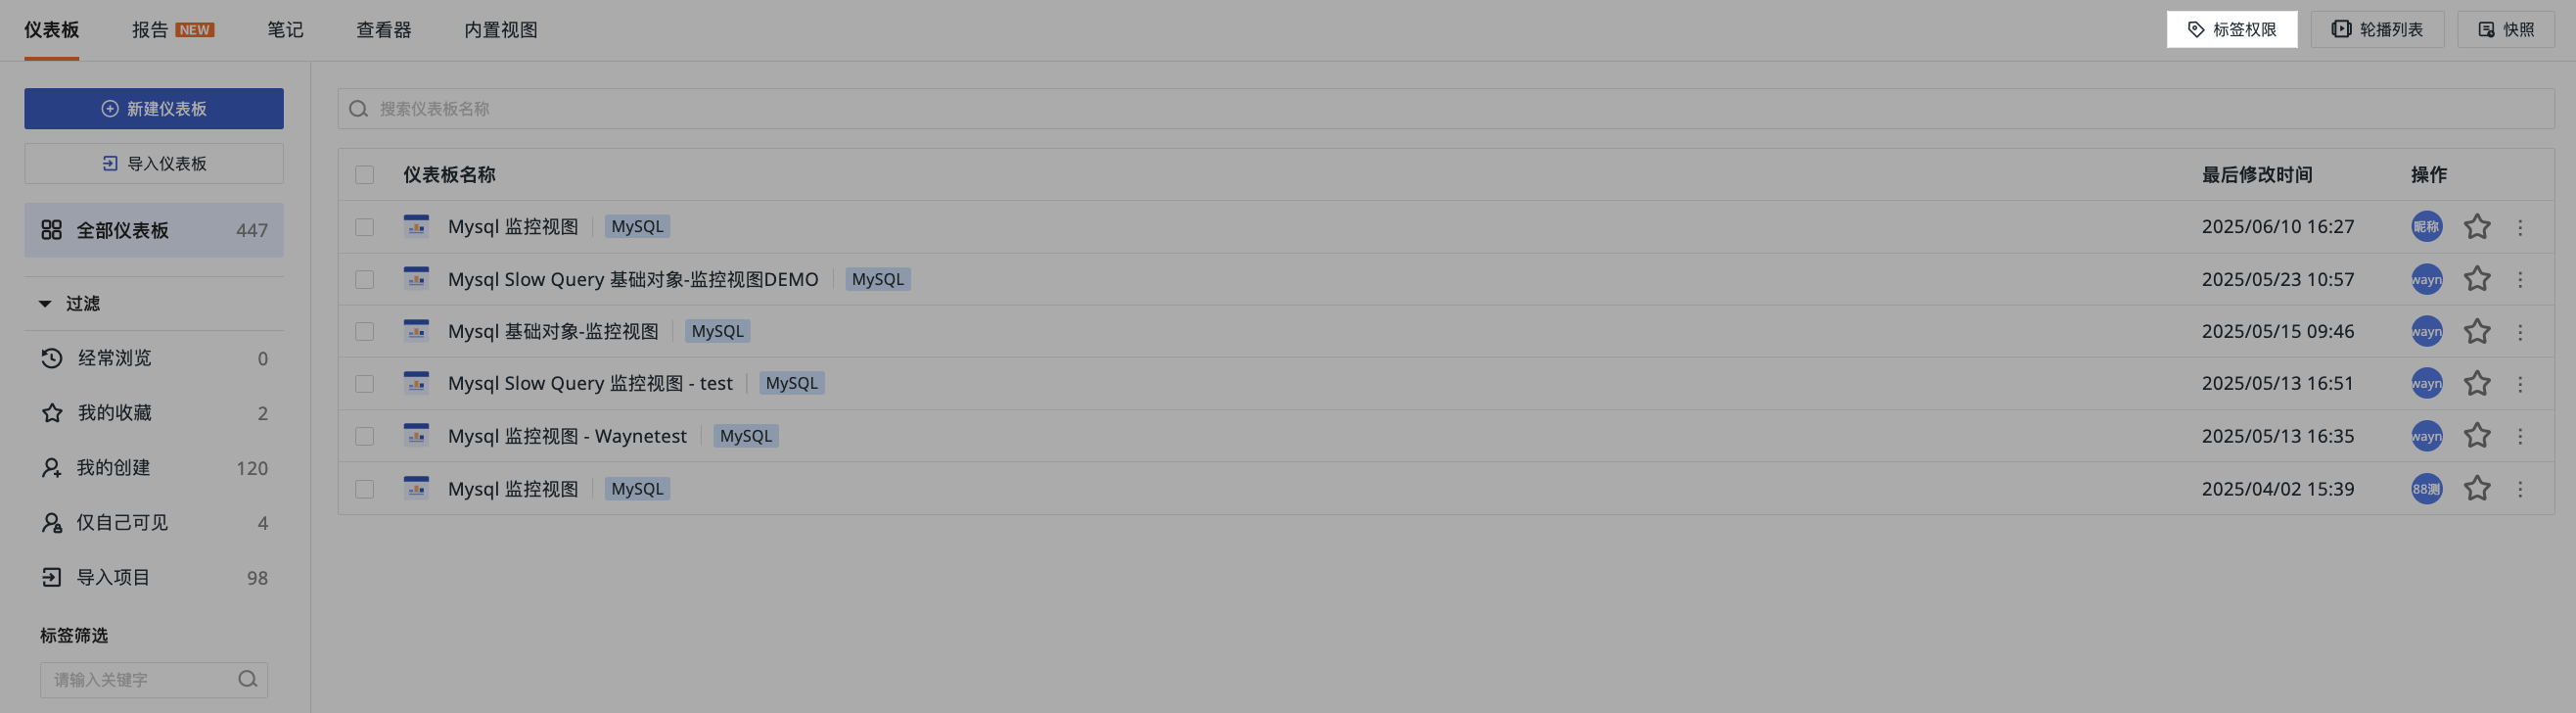
Create a Tag
- Click "Create Permission Tag".
- Search or add global tags.
- Select members who have full permissions or view-only permissions on this dashboard (❗️The dashboard creator has full permissions by default).
- Save.
Manage Tags
For existing tag rules, you can perform the following operations:
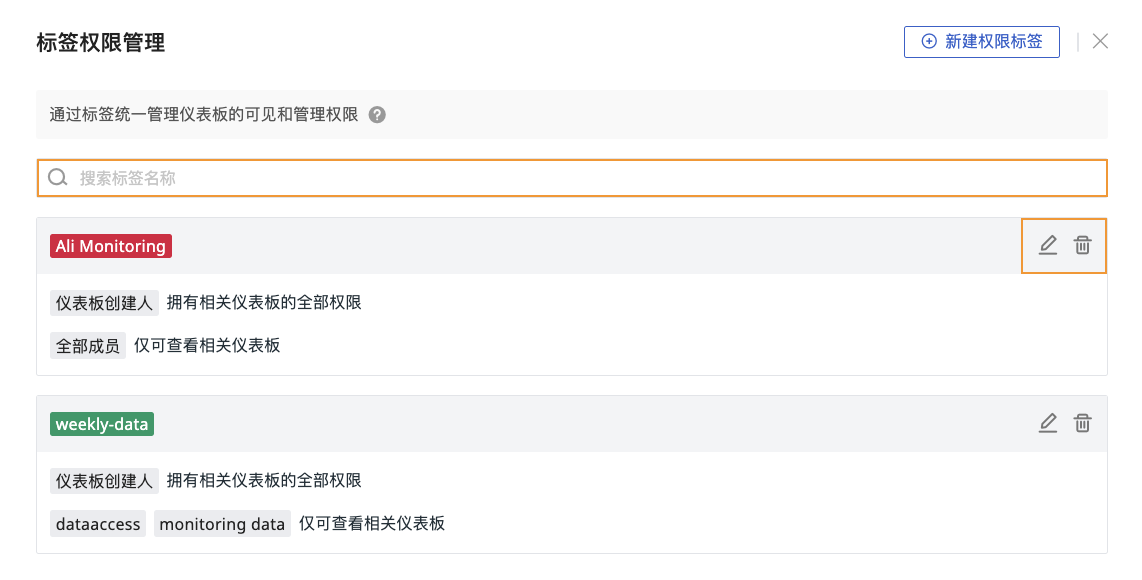
- Enter the tag name to search and locate.
- Edit the rule to modify permissions.
- Delete the current rule.
Batch Operations on Multiple Dashboards
After selecting multiple dashboards, you can perform batch deletion, export, modify visibility range, and add tags.
-
Add tags: New tags will be appended to the existing tag list of the dashboard, without overwriting original tags.
-
Modify visibility range:
-
The "Home Dashboard" of the main account does not support modifying the visibility range.
-
You can only modify the visibility range of dashboards created by yourself. For dashboards created by others, you cannot modify them to "Visible only to me".
-
Single Dashboard Operations
Click the dashboard button to perform the following operations:
- Edit and modify the dashboard.
- Export the dashboard as a JSON file.
- View the audit events related to this dashboard.
- Set this dashboard as the "Home Dashboard".
- Delete the dashboard.
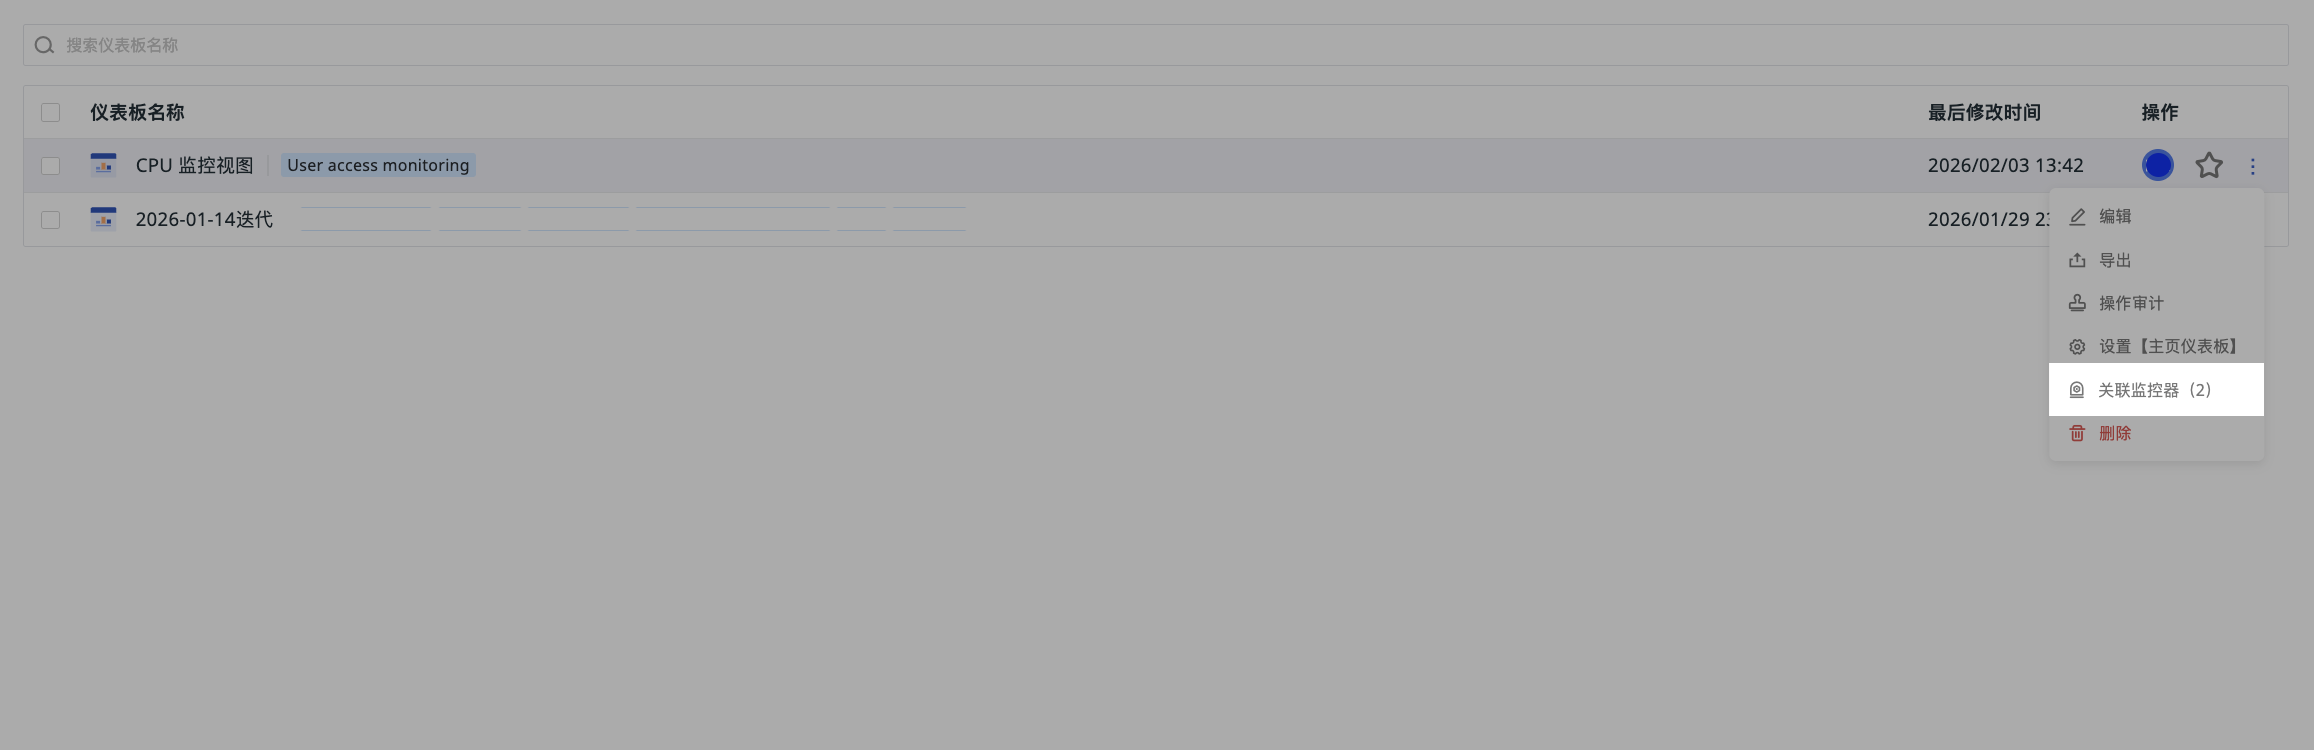
Associate Monitors
Dashboards can be bidirectionally associated with monitors to enable linkage analysis between alerts and visualization:
- Jump from Monitor: Click the associated dashboard icon in the monitor list to go directly to the corresponding view.
- View from Dashboard: View the associated monitor rules and status on the dashboard page.
Set Home Dashboard
Set a frequently used dashboard as the default homepage at the workspace level, which will be automatically displayed when members log in.
Note
Only dashboards set to "Public" visibility can be set as the "Home Dashboard". After setting, the visibility range cannot be modified.
Filter/Search
On the left side of the dashboard, you can quickly filter and find corresponding dashboards by different categories, or quickly filter by setting tags for dashboards.
| Category | Description |
|---|---|
| Frequently Viewed | Dashboards viewed more than 5 times by the current user in the past week |
| My Favorites | Dashboards favorited by the current user. Click the favorite icon on the dashboard. |
| My Creations | All dashboards created by the current user, including imported dashboards |
| Visible Only to Me | Non-public dashboards that only the creator can view; other members have no viewing permission |
| AI Auto-created | Dashboards generated by Obsy Copilot |
Carousel List
Configure multiple dashboards to auto-rotate, suitable for monitoring screens or business reporting scenarios.

- Go to Carousel List, click Create Carousel.
- Enter the carousel name.
- Select the dashboards to rotate (at least 2).
- Set the refresh frequency.
- Confirm.
After configuration, you can view the set dashboards in the Carousel List.
Manage Carousels
For the carousel list, you can perform the following operations:
- Click the play button to start playing the configured dashboards at the set frequency.
- Click the edit button to modify the carousel configuration.
- Click delete to remove the carousel.
Snapshots
At the top right of the page, in Snapshots, you can view all historical snapshots of dashboards saved in the current workspace, used to trace data status at specific points in time.