How to Handle Data Write Latency
Overview
This document organizes troubleshooting ideas based on the issue of high data write latency.
Infrastructure Configuration Check
1 Check Time
Check whether the machine time of the Guance services is normal. If there is a delay, calibrate the machine time zone and time.
2 Check Data Node Configuration
Check whether the configuration of the storage engine data nodes has been adjusted according to the actual resource situation.
1) View the machine configuration of the data node
2) Check whether the storage engine configuration was modified during deployment.
3) If no modifications were made, follow the configuration guide below to make changes.
Assume the resource status queried above is 8c32g.
        # Generally set to half of limits
        ## If resources are large enough, the maximum is 32 GB; exceeding this wastes resources.
        - name: OPENSEARCH_JAVA_OPTS
          value: -Xmx14g -Xms14g
        # Limits should not be fully allocated; leave some CPU and memory headroom for other programs and the system.
        REsources:
          limits:
            cpu: "7"
            memory: 28Gi
          requests:
            cpu: "7"
            memory: 7Gi
Business Logic Troubleshooting
The following mind map outlines the troubleshooting logic. Use this diagram to determine the order of investigation.
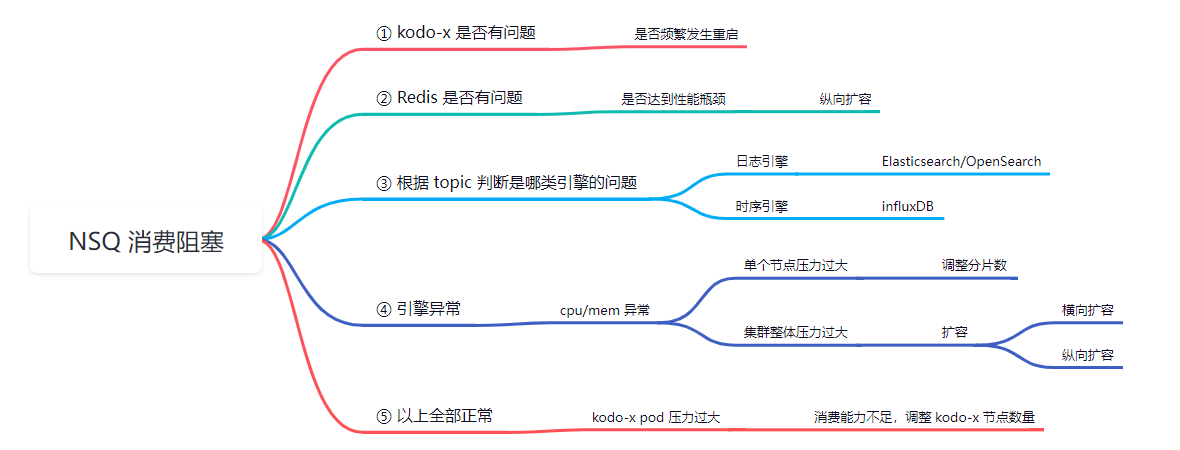
1 Check Whether the kodo-x Service Restarts Frequently
2 Check the Redis Middleware
Check whether Redis performance has reached a bottleneck. If CPU or memory usage is too high, scale vertically.
3 Determine the Storage Engine Type Based on the Topic
1) Modify the service configuration of the nsqadmin service in the middleware Namespace to NodePort.
Access it via a browser using
node_IP:port.
2) Determine the storage engine type based on the topic name.
Topics starting with df_metric_xxx belong to the time series engine; all other topics belong to the log engine.
3) Check data node performance
If resource usage is too high, refer to the Engine Exception Handling section below.
4) View the corresponding service data
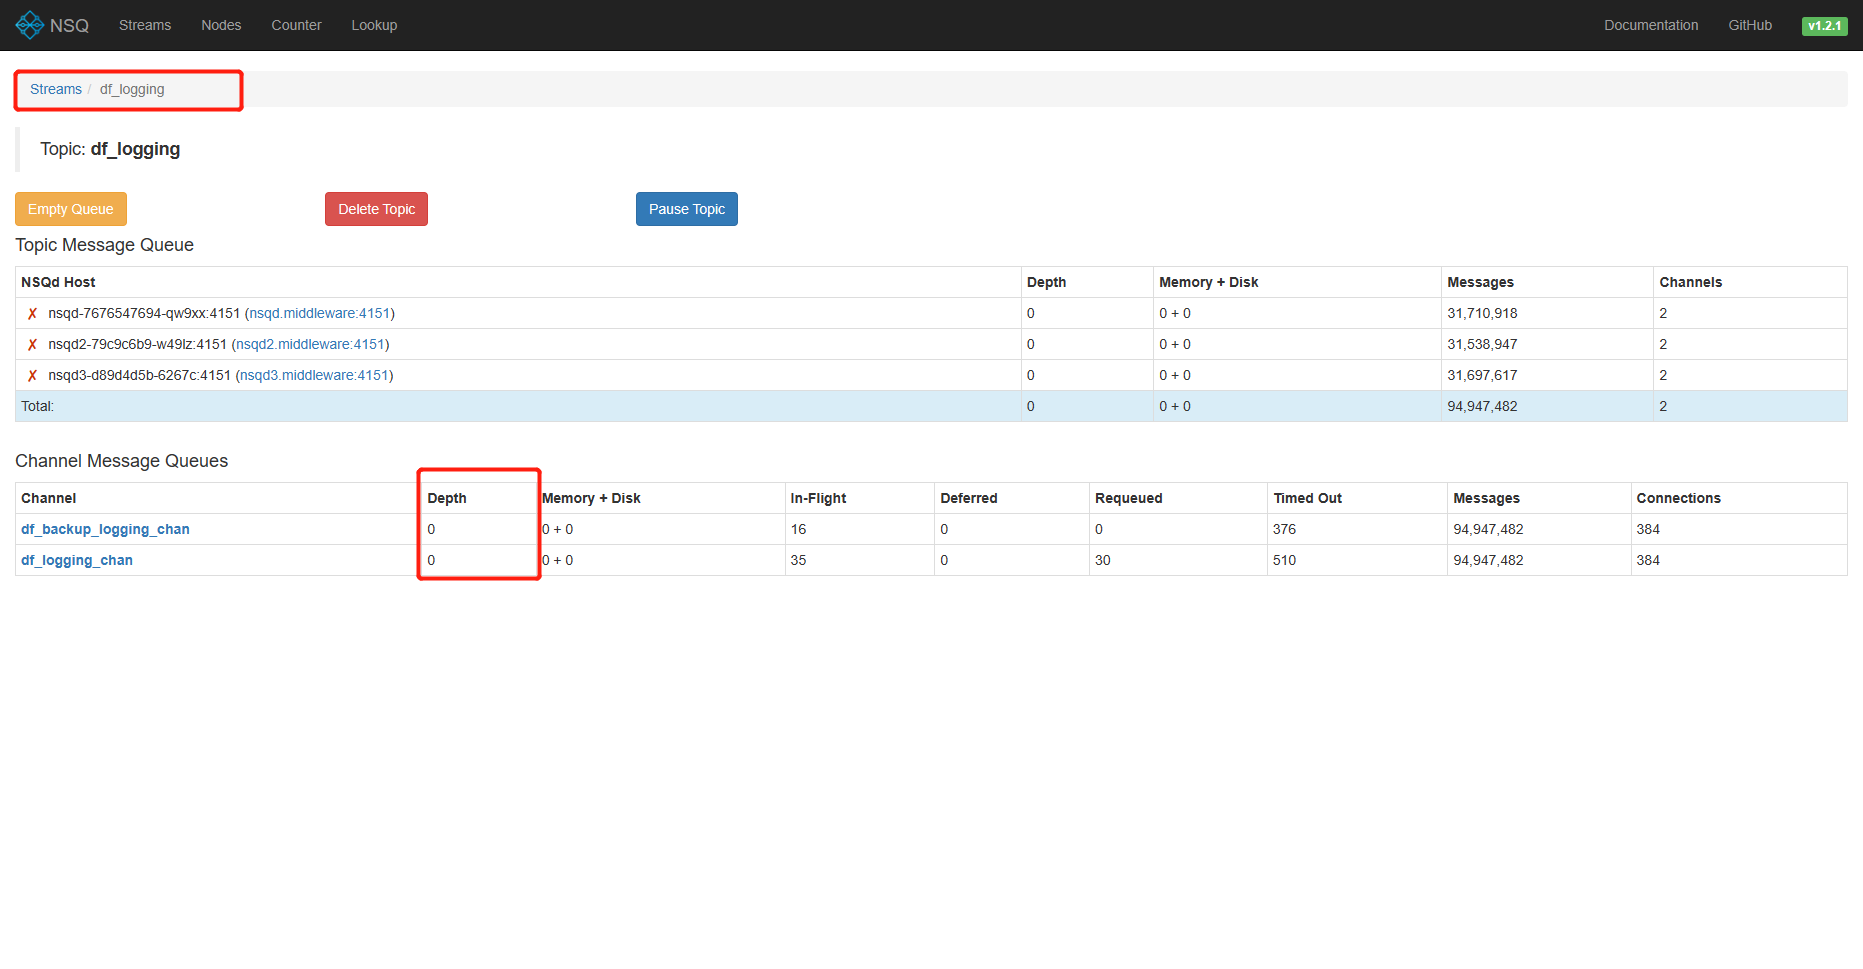
| Field | Description |
|---|---|
| Topic | Name of the message queue |
| Depth | Number of unprocessed messages in the current topic's message queue |
| In-Flight | Number of messages currently fetched by consumers but not yet acknowledged as processed |
| Deferred | Number of messages re-enqueued or explicitly delayed and not yet dispatched |
| Connections | Current maximum concurrent consumer connections |
4 Engine Exception Handling
4.1 Single Node Overloaded
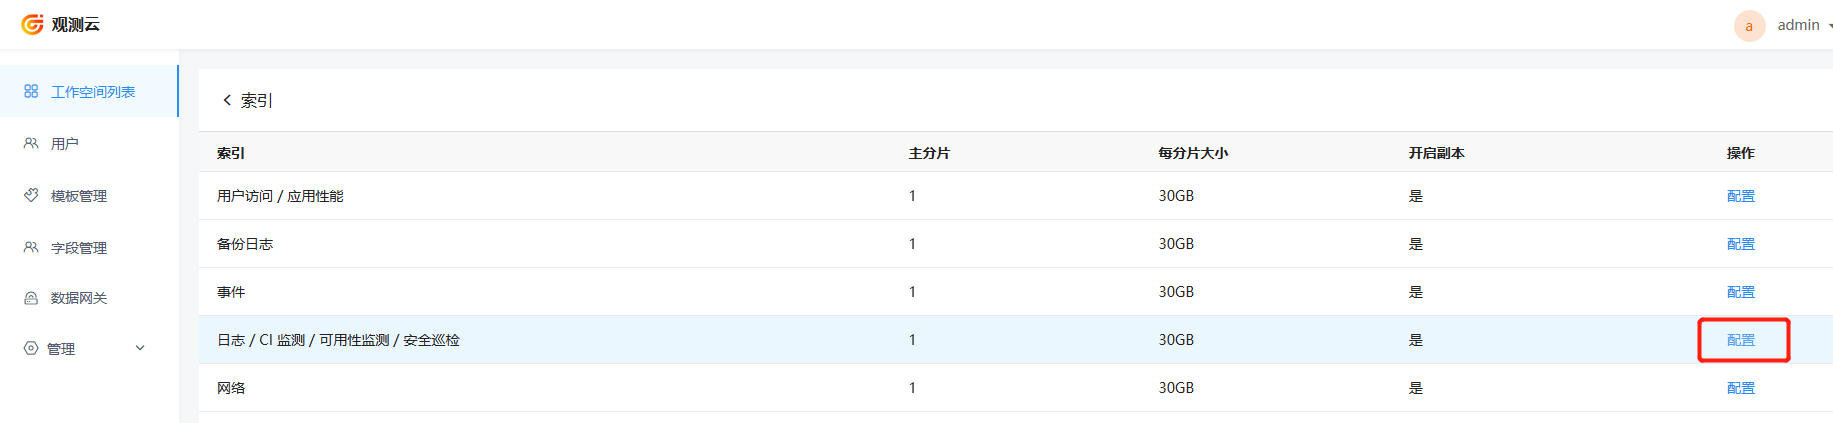
All indexes in Guance default to 1 shard, meaning only one data node processes them. This creates a performance bottleneck. Therefore, log in to the admin console and adjust the number of shards for the index to increase the parallel processing capability of data nodes.

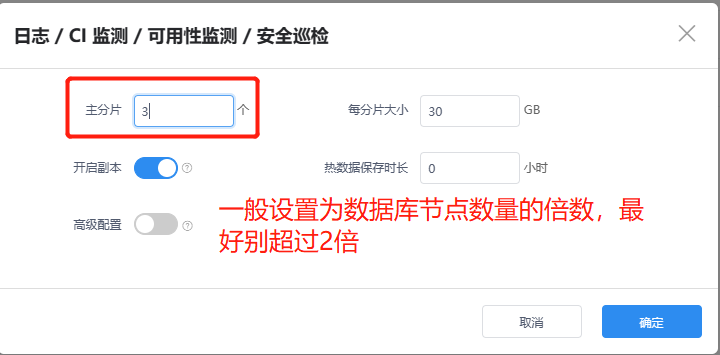
At this point, refresh the NSQ admin page frequently. If the Depth accumulation in the Channel drops significantly, the issue is resolved.
4.2 Cluster Overloaded
If the overall cluster is under too much pressure, consider scaling horizontally or vertically.
Refer to Log Engine Capacity Planning
5 Insufficient Consumption Capacity: Scale the kodo-x Service
If the above methods still do not resolve the data accumulation issue, the number of connections in the Channel on the NSQ admin page may be too small to handle large data volume requests. In this case, scale the number of kodo-x service replicas.
Assuming sufficient machine resources, scaling is typically done by doubling the number of replicas until the Depth accumulation in the NSQ admin page decreases significantly.