Service List
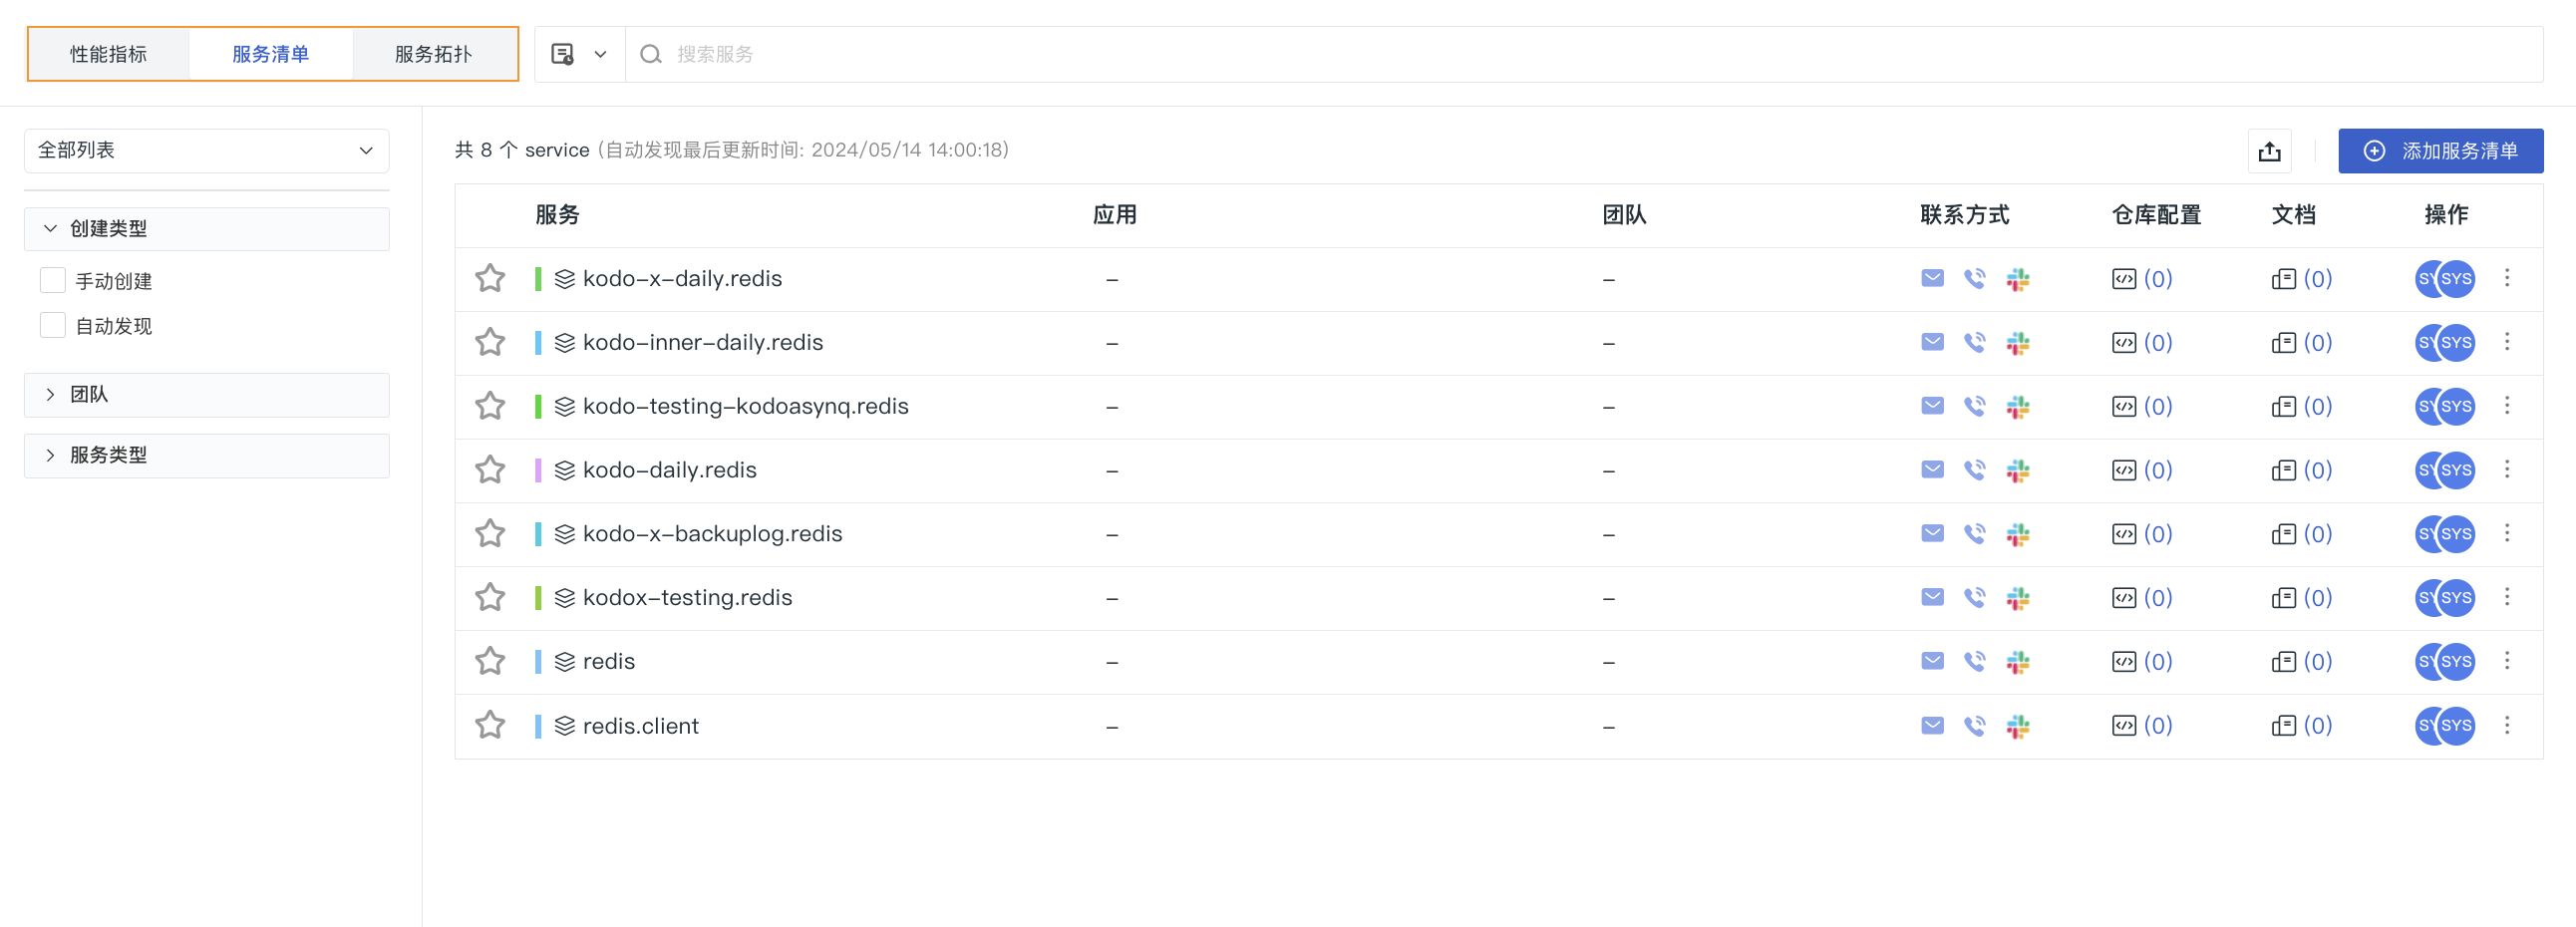
The Service List is the core interface for managing all integrated application services, providing unified management capabilities for basic service information. This interface serves as a unified entry point for service-level observability, displaying both the overall health status of services and supporting quick navigation to associated detailed analysis pages.
It mainly includes:
-
Service Assets and Status Overview: Centrally displays information such as service name/language/associated application, team, and repository configuration.
-
One-click navigation from each service entry to associated deep-dive analysis dashboards like Overview, Resource Calls, Infrastructure Dependencies, APM, and Log Query.
Add Service
-
Define the specific name of the service.
-
Select the service type; available options include:
app,framework,cache,message_queue,custom,db,web. -
Select a color for the current service; one is generated randomly by default, or you can select one from the dropdown.
-
Configure team information
- Team: The team to which the current service belongs; you can select an existing team from the current workspace, or manually enter a team name and press Enter to create a new team.
- Contact: The primary contact when an exception or failure occurs with the current service; supports 3 channels: email, phone, Slack; for multiple selections, they must be separated by commas, semicolons, or spaces.
Note
After the service list item is successfully created, any new team created here will be synchronized to the list under Manage > Member Management > Team Management.
-
Configure association information
- Application: The application information associated with the current service; same as the RUM application ID.
- Tags: Used to associate other configuration information within the current workspace; connects information across the workspace via global tags, supporting actions like navigation, contact viewing, and analysis.
-
Configure help links
- Repository Configuration: Enter the display name, provider name, and repository code URL in sequence.
- Help Documentation: Enter the display name, provider name, and other associated documentation URL in sequence.
- View: You can bind the required built-in views for the current service; after selection, the bound built-in views can be viewed under the Analysis Dashboards section linked to the current service's data.
-
Confirm.
View Service
After creation, you can view the relevant parameter information of the service in the following three lists:
View Service Details
Manage List
You can manage the service list using the following operations:
-
Search: Enter keywords in the search bar to search for service names.
-
Filter:
-
In the 'All' list, quickly filter and find corresponding services by Frequently Viewed, My Favorites, and Created by Me.
-
On the left side of the list, you can filter by creation type, team, and service type.
-
-
On the list page:
-
Application: If the filled-in application matches the RUM application ID, hovering allows clicking to open a new page and navigate to the Session Explorer.
-
Team: Hovering allows clicking to open a new page and view team information.
-
Contact: Hover to view detailed information for email, phone, and Slack; Slack supports navigation.
-
Repository Configuration & Documentation: Hover over the respective icon and click to automatically navigate to the associated repository or documentation.
-
-
Under Options:
-
Hover over the avatar icon to view the creator, creation time, updater, and update time for this service entry.
-
Click the button to modify or delete the current service.
-
-
Click the button to favorite the current service.
-
Click the button to export the current page data as a JSON file.
-
You can save the current page data as a snapshot.
Memory Snapshot
For Java services, you can configure JVM memory snapshots.
Concepts
A JVM (Java Virtual Machine) memory snapshot is a complete record capturing the state of the JVM memory at a specific point in time. You can use the log information within the snapshot to view detailed information about the memory usage of the related application, promptly troubleshoot exceptions such as memory leaks or performance issues, and further optimize data structures based on an understanding of memory usage.
For more configuration on the collector side, refer to Collector.
Create
- Enter a task name.
- The system automatically populates the current service for you.
- Select the execution host or Pod.
- Add a description as needed.
- Click Confirm.
How is the execution target determined?
Guance queries trace data from the past 1 hour and checks if POD information exists in the trace data for the current service. If a pod_name value exists, it lists the pod_name in the dropdown; if not, it lists the host.
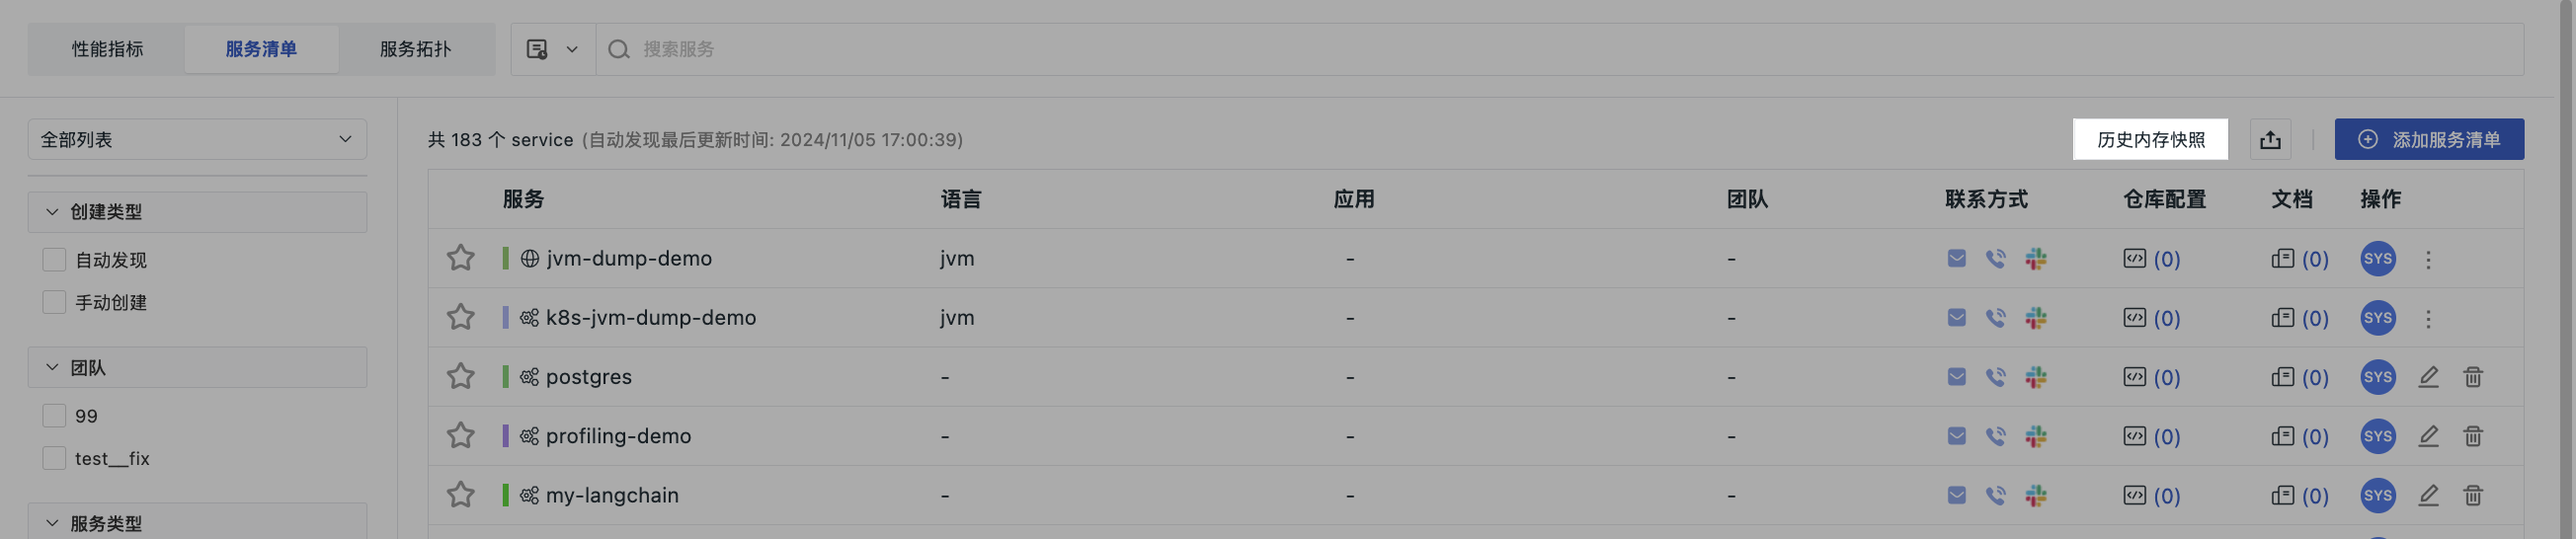
Historical Memory Snapshots
All created snapshots can be viewed by entering through the Historical Memory Snapshots entry above the list.
In the Historical Memory Snapshots list, you can view the execution logs for each task and evaluate the execution results and logs.