Entity Details
Click any entity name in the entity list to open the details page in a slide-out panel, where you can view the entity's metadata, relation topology, and associated observability data in one place.
Top Action Bar
The top of the page displays the entity's core identifiers and quick actions:
- Entity name: The left side shows the entity type icon and entity name, and the right side marks the data source;
- Edit: Click to open the edit dialog, where you can modify the entity's display name, description, project, service specifications, contact information, external links, and other attributes
- More: Delete entity: After a confirmation prompt, delete the entity object

Basic Information
Displays the entity's business attributes and contact information, grouped by information type.
Entity Attributes
Dynamically displays the corresponding business fields based on the entity type (system, service, host, database, etc.):
- Common attributes: Project, entity description, owning team, custom tags
- Service specifications (for service types): Service type (Web/DB/Cache/Queue, etc.), programming language (Java/Go/Python, etc.), lifecycle stage (running/under maintenance, etc.), deployment environment (production/staging/test/development)
- Infrastructure (for hosts/databases): Host IP, operating system, cloud provider, instance ID, region, availability zone
- Ownership: Displays the upper-level entities to which this entity belongs (such as the owning host, owning system) and the dependencies it runs on (such as dependent Redis, database)
Contact Information
Centrally displays the alert notification contacts for this entity, listed in the order of Slack, email, and phone.
For privacy protection, only contact names are displayed by default; specific phone numbers, email addresses, or Slack accounts are hidden.
- Click the View icon next to the name to expand and display the full contact information;
- Click the Copy icon or directly click the name to copy this contact information.
Related Links
Aggregates quick-access entries for external resources related to this entity, displaying code repositories/help documentation/views.
Relations
Displays the relationships between this entity and other entities through a visual topology, supporting Dependency and Hierarchy view modes.
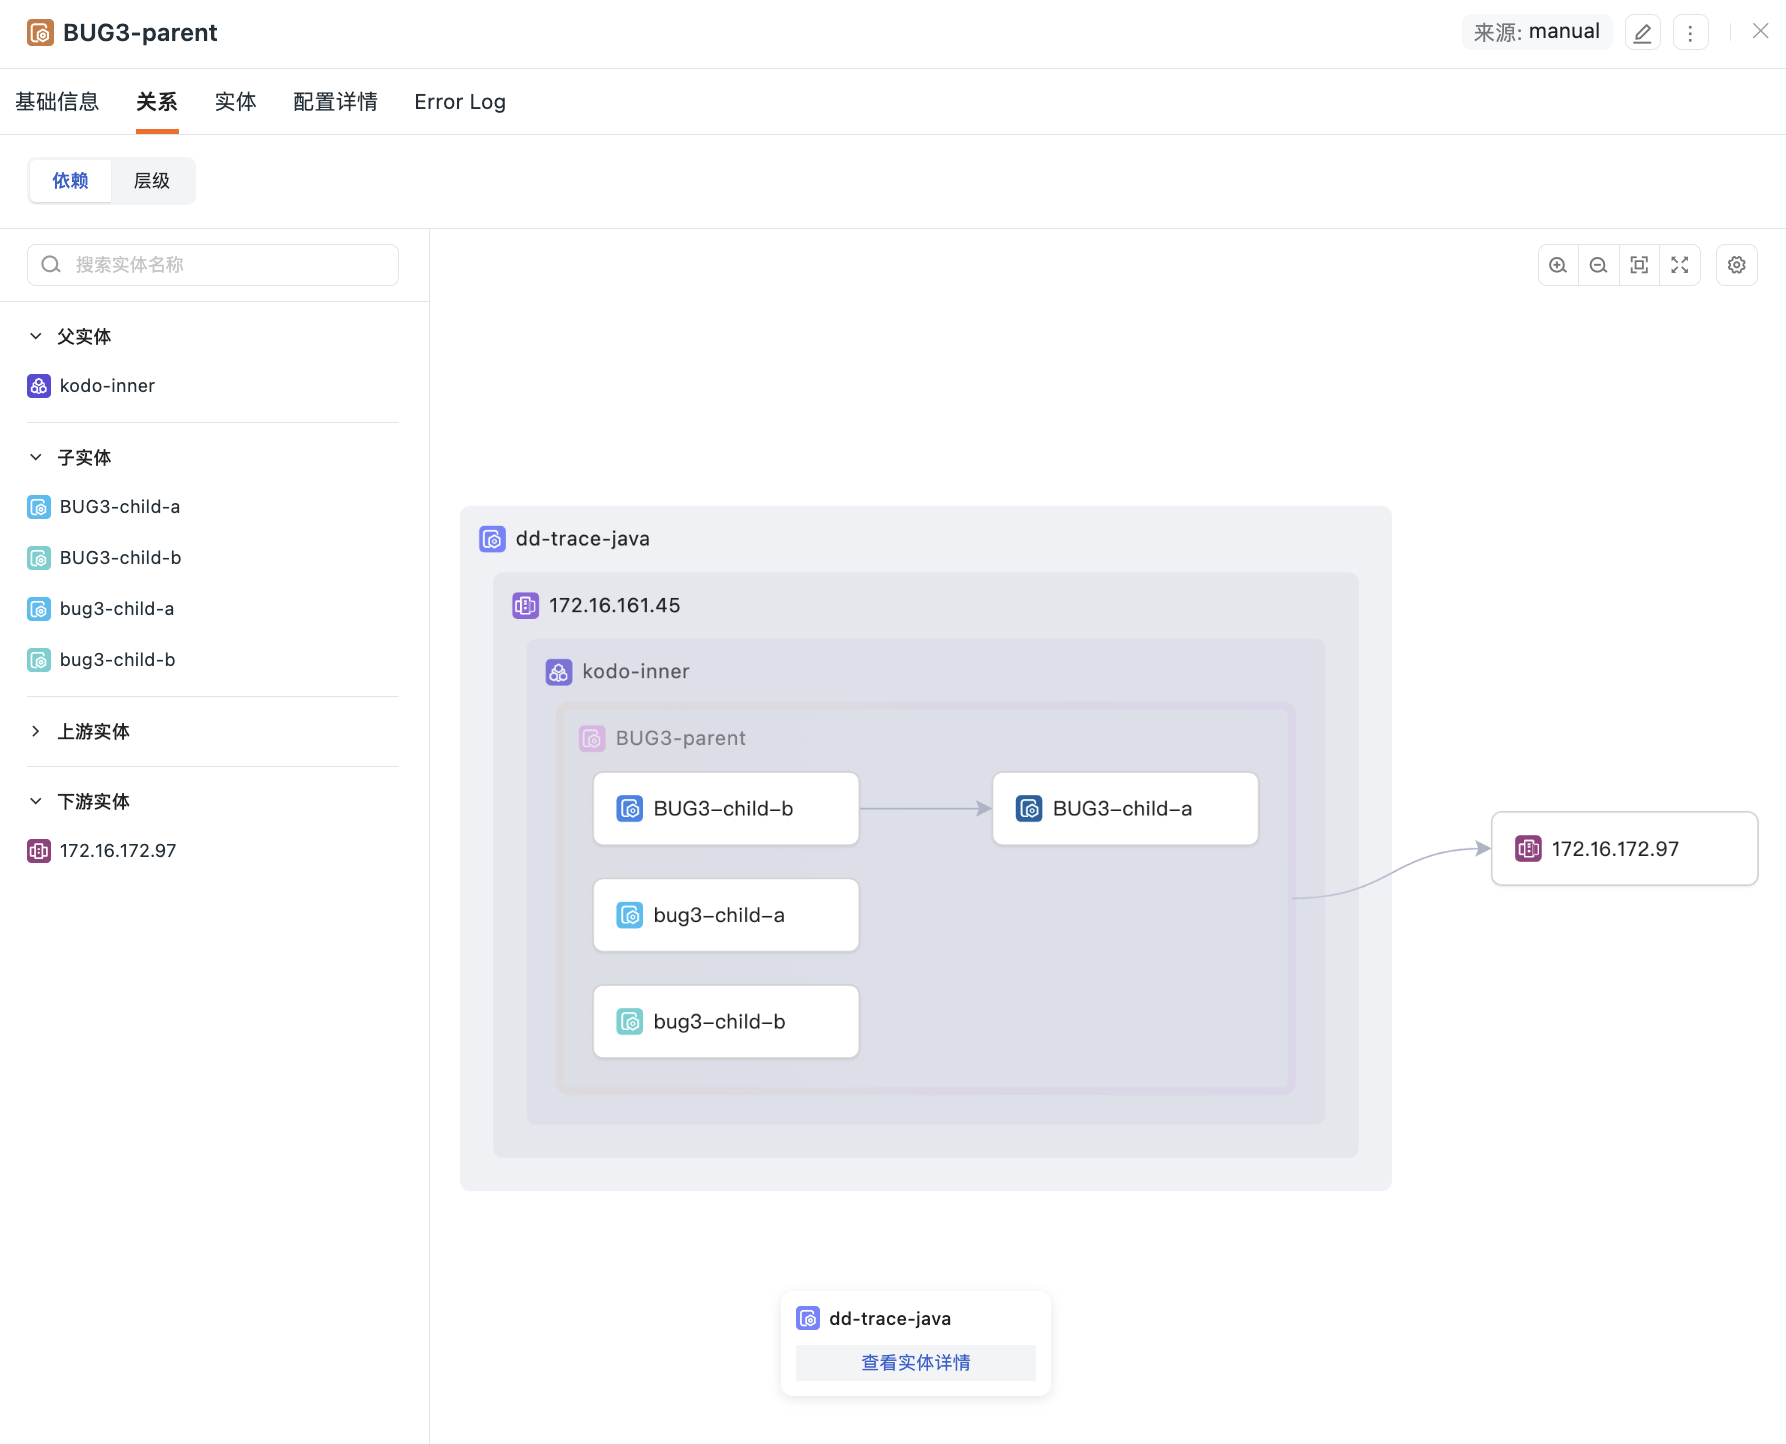
Dependency View
Displays the entity's call chain and ownership relationships; supports search to quickly locate related entities.
-
Left-side list: Displays four categories of related entities
- Owning entities: The infrastructure to which the current entity belongs (such as the owning host, cluster)
- Subordinate entities: Components or instances that belong to the current entity
- Upstream entities: Services that call the current entity
- Downstream entities: Services called by the current entity (that is, the current entity's runtime dependencies)
-
Right-side topology:
- The current entity is highlighted in the center, and related entities are arranged in layers by relationship type
- View Full Path Relations is disabled by default, showing only first-level topological relations directly associated with the current entity. After clicking Settings in the upper-right corner to enable it, the topology displays full-path relations and highlights the current entity's relationships, making it easier to locate its position in the call chain
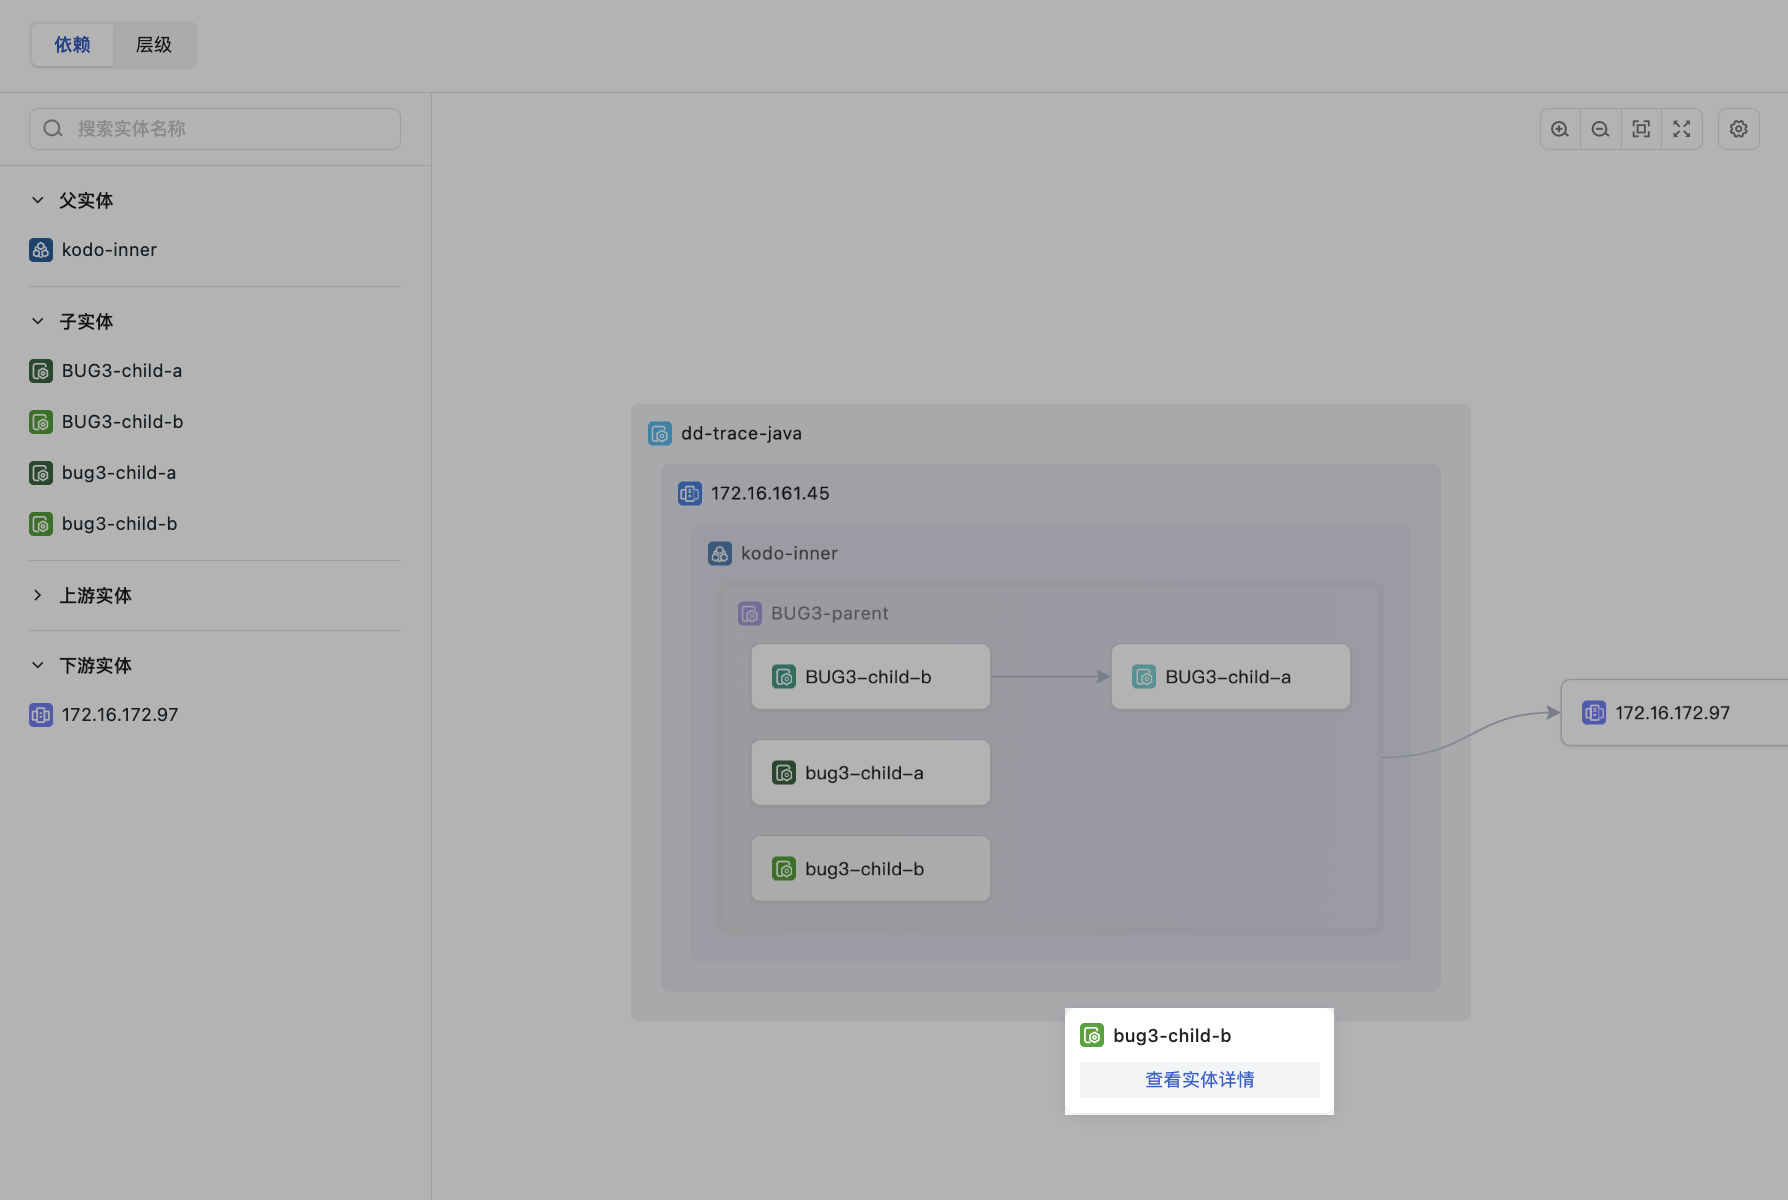
- Click any entity node in the topology to expand a dropdown card showing the entity's basic information; click View Entity Details to further inspect the entity's relation topology
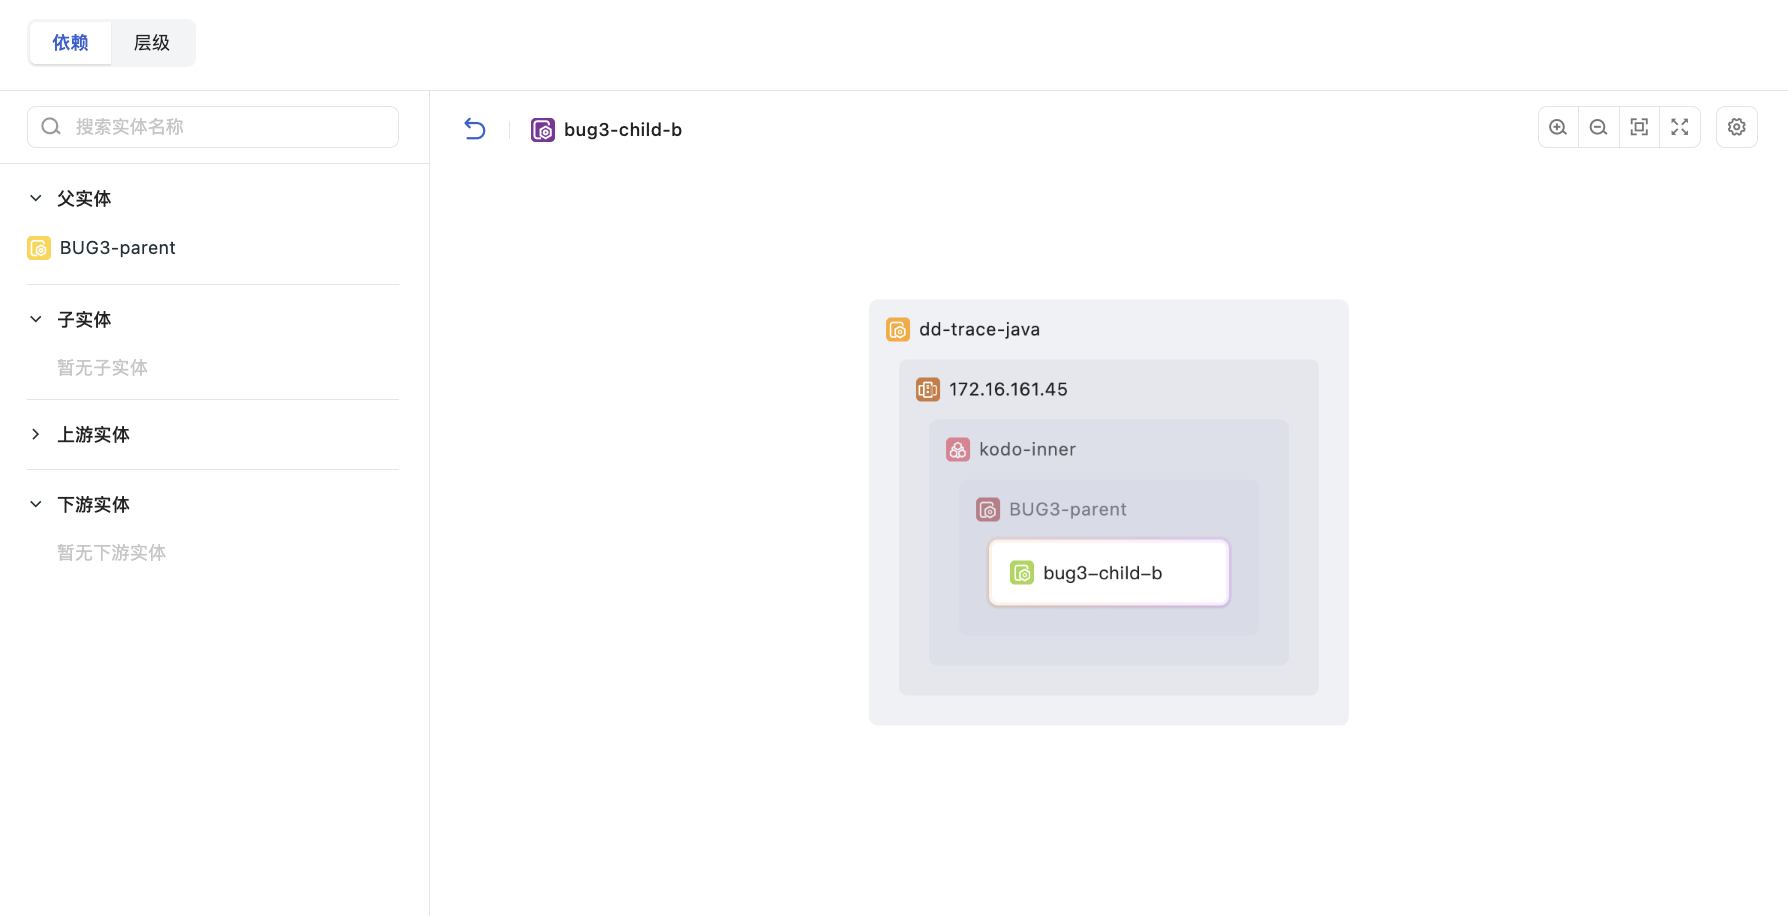
Hierarchy View
Displays the entity's ownership hierarchy:
- Left-side list: Displays owning entities (upper-level entities to which the current entity belongs) and subordinate entities (lower-level entities that belong to the current entity)
- Right-side topology: Displays the ownership hierarchy as a tree diagram, with the current entity highlighted
Adjusting the Topology Layout
In the Relations tab of the entity details, you can drag relation lines on the topology canvas to adjust their display paths. During dragging, the start and end points of the lines remain unchanged, and the relationships between entities are not altered.
Click Restore Default Layout to restore the topology to its default layout.
Entities
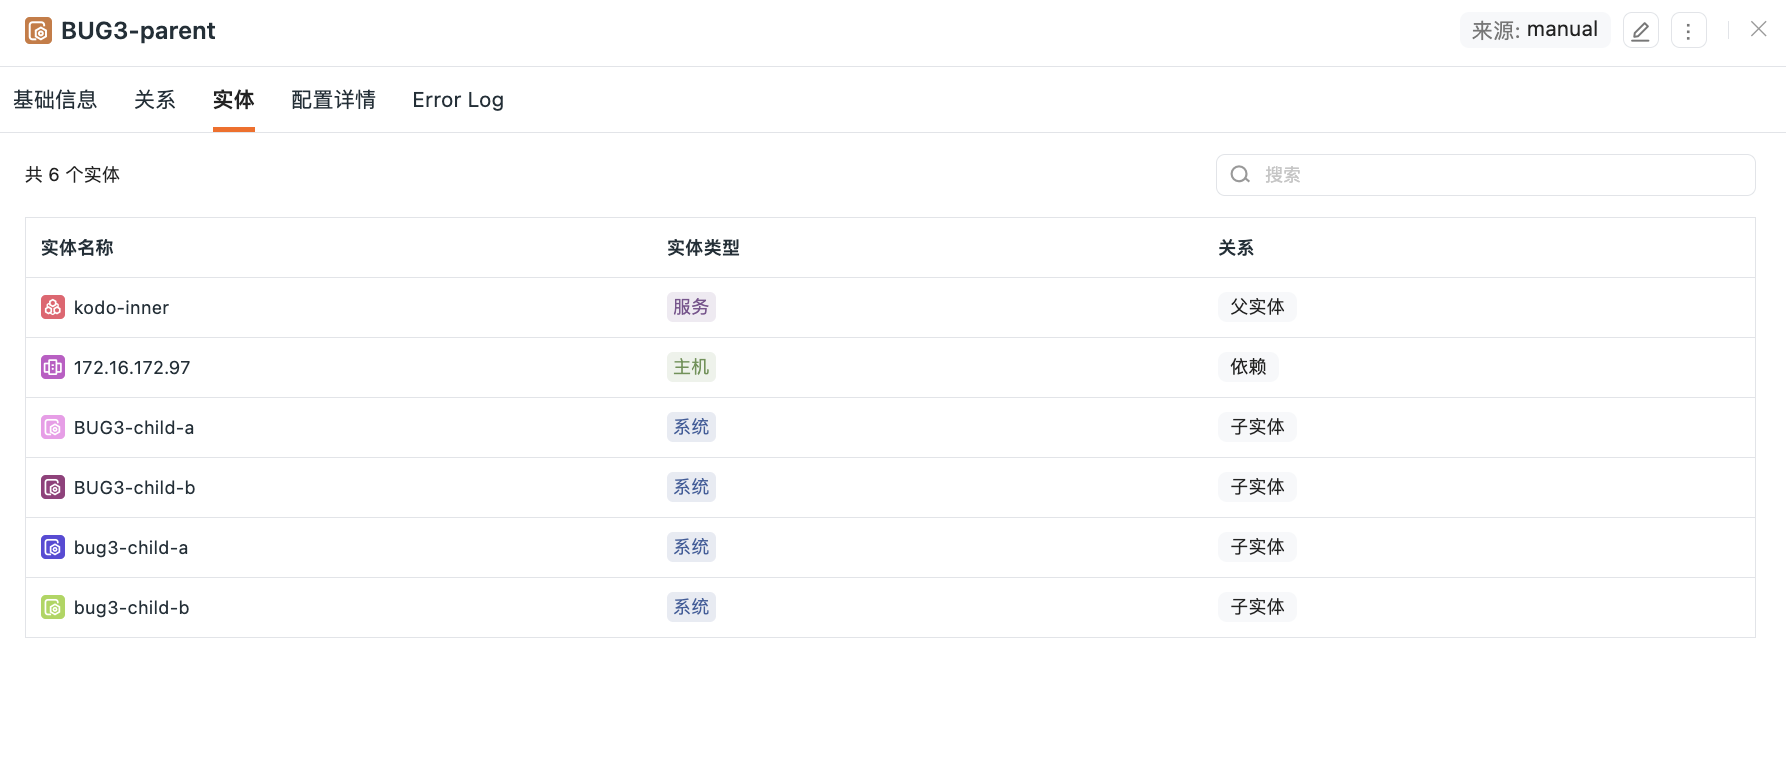
Displays a list of all entities related to the current entity; supports searching by entity name keyword.
The list displays the following information:
- Entity count: Shows the total number of related entities
- Entity list: Displays the name, type, and relationship type (owned, dependent, etc.) of each related entity with the current entity
Configuration Details
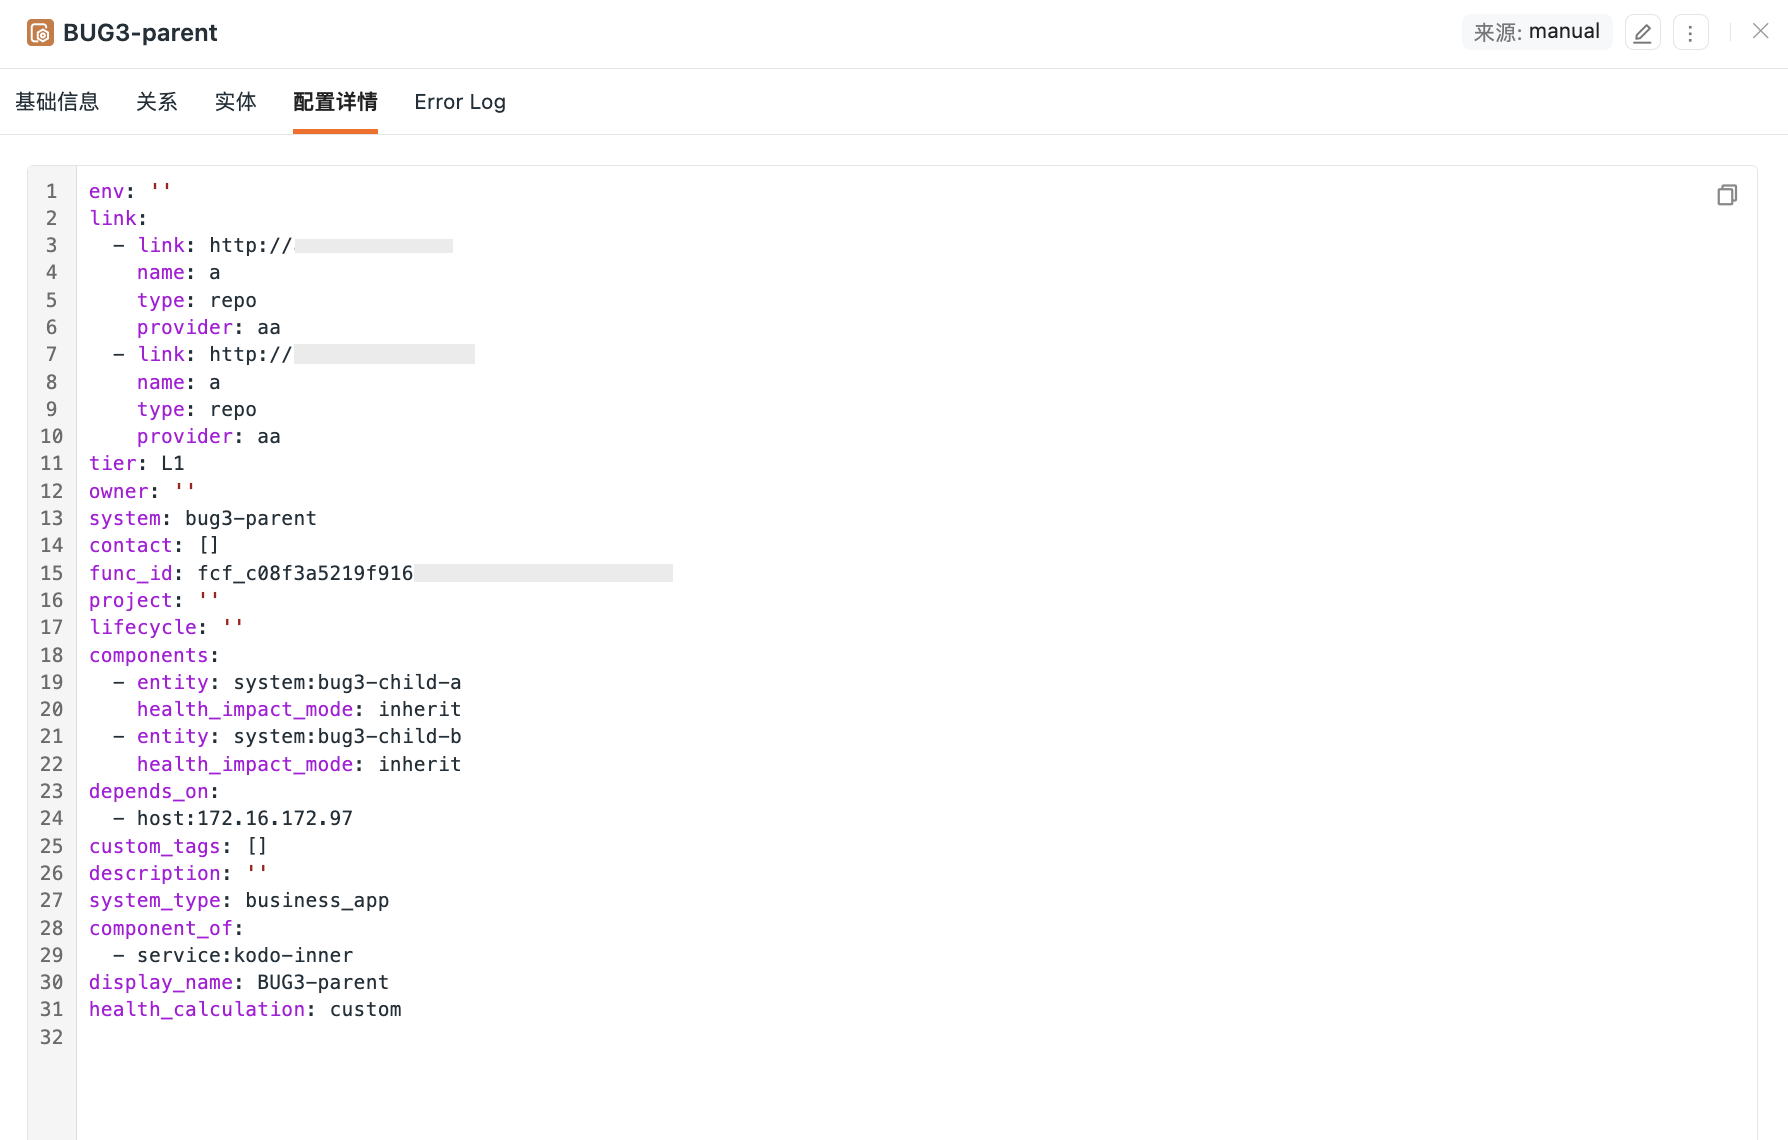
Displays the complete configuration definition of this entity in YAML format, including metadata such as basic attributes, tags, and relation definitions. Supports one-click copying of the YAML content.
Logs
The error Log Explorer associated with this entity, which displays the error logs generated by this entity by default. Supports viewing, searching, and analyzing log data directly within the details page.
Tracing
Displays a list of distributed tracing data generated by this entity, supporting the viewing of key fields such as trace ID, service name, resource name, and duration.
Events
Centrally displays all events associated with this entity, supporting switching between the list view and the timeline view. The timeline view is displayed by default.
List View
Displays the event list in reverse chronological order, supporting filtering by event type and keyword search. Click a single event to jump to the Event Details Explorer.
Timeline View
Overlays change event markers on the status color band to intuitively display the alert status distribution and change history of this entity within the selected time range, helping you quickly determine "whether changes occurred before and after a failure".
-
Status color band: Displays the alert status distribution in time slices; the color is determined by the highest-level alert event in that slice, aligned with the Event Center level definition;
-
Change event markers: Change event markers (◆) are displayed on the timeline, including native change events and externally tagged change events. When adjacent markers are too dense, they are automatically aggregated into clusters; click a cluster to expand and view the change event list;
-
Event statistics: Statistics cards for four event types—Change, Alert, Normal, and Security—are displayed at the top; click a card to filter the event list below. Supports searching event content; click a single event to jump to the Event Details Explorer.
- Change events: Include native change events and change events tagged through external event monitors
- Alert events: Alert events generated by monitors, Smart Monitoring, etc.
- Normal events: Events generated by OpenAPI writes, SLO, custom events, etc.
- Security events: Abnormal behaviors or vulnerability alerts detected by the security module
Metrics
Displays performance metric charts associated with this entity.
Further Reading
You may also be interested in the following: