Disk Usage Inspection
Background
"Disk Usage Inspection" is based on a disk anomaly detector, which regularly performs intelligent inspections of host disks. Through hosts with disk anomalies, root cause analysis is conducted to determine the disk mount points and disk information corresponding to the anomalous time points, analyzing whether there are disk usage issues in the current workspace hosts.
Prerequisites
- Self-built DataFlux Func Guance Special Edition, or activate DataFlux Func (Automata)
- In Guance "Manage / API Key Management", create an API Key for operations.
Note: If considering using a cloud server for offline deployment of DataFlux Func, please ensure it is deployed within the same operator and region as the currently used Guance SaaS deployment here.
Start Inspection
In the self-built DataFlux Func, install "Guance Self-Built Inspection (Disk Usage)" via the "Script Market" and configure the Guance API Key to start.
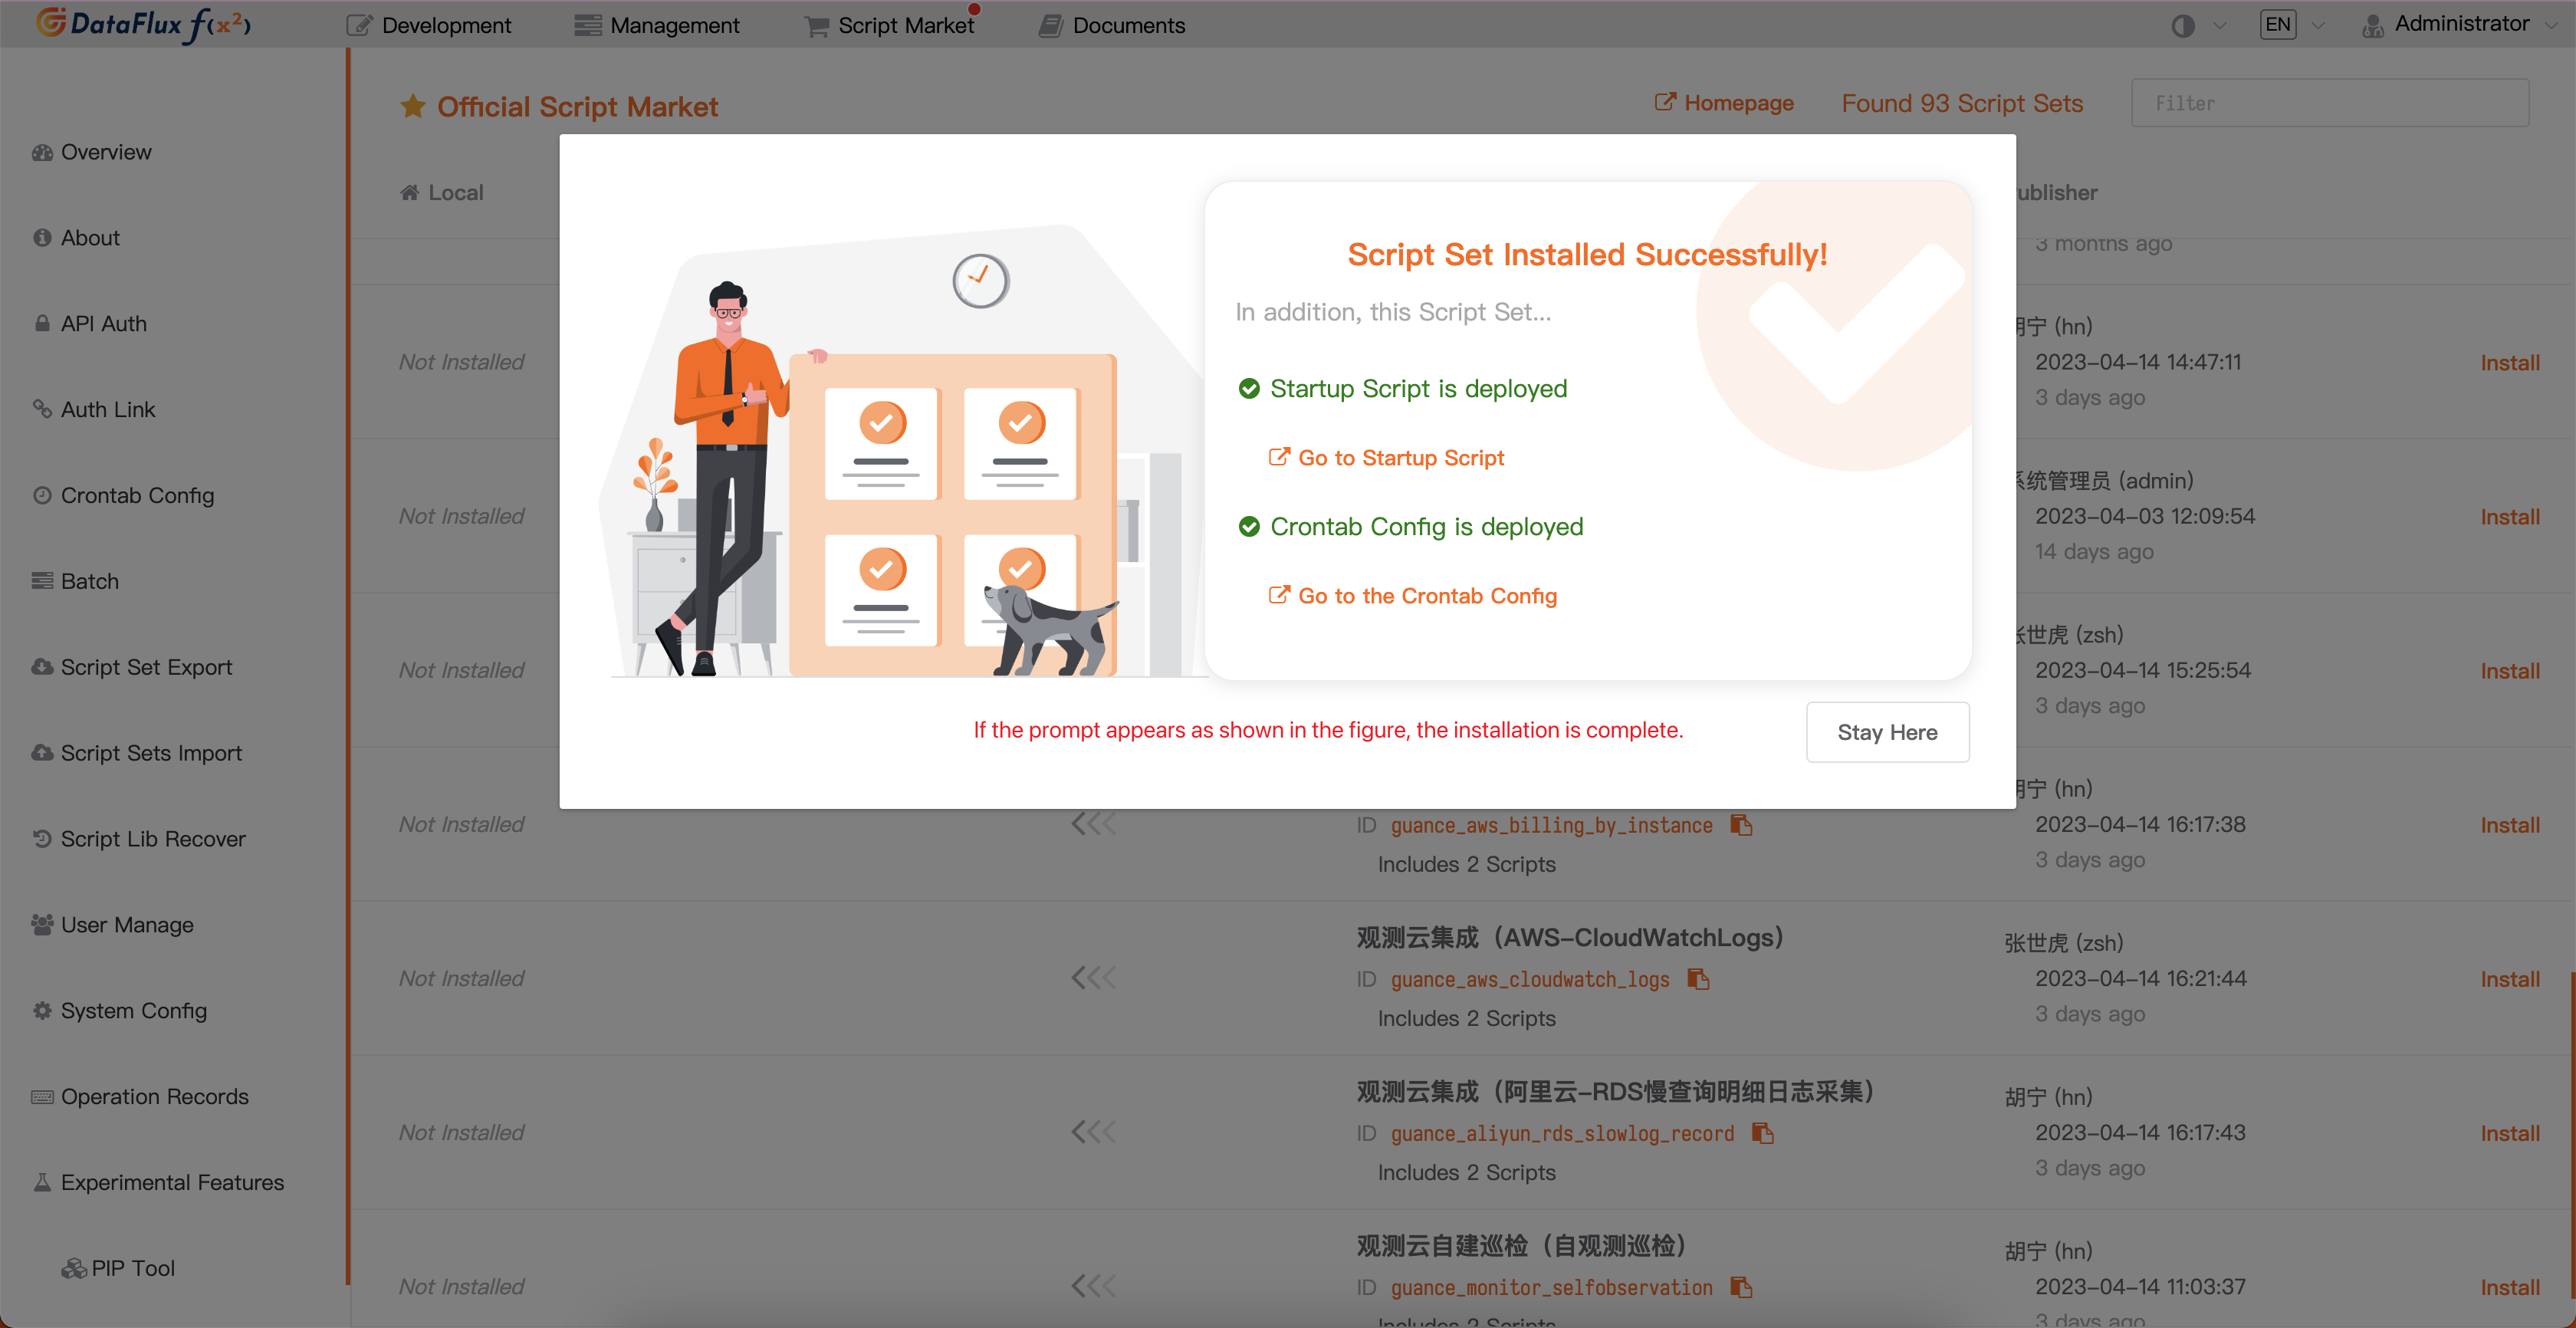
In the DataFlux Func Script Market, select the required inspection scenario to click and install, then configure the Guance API Key and GuanceNode before choosing to deploy and start the script.
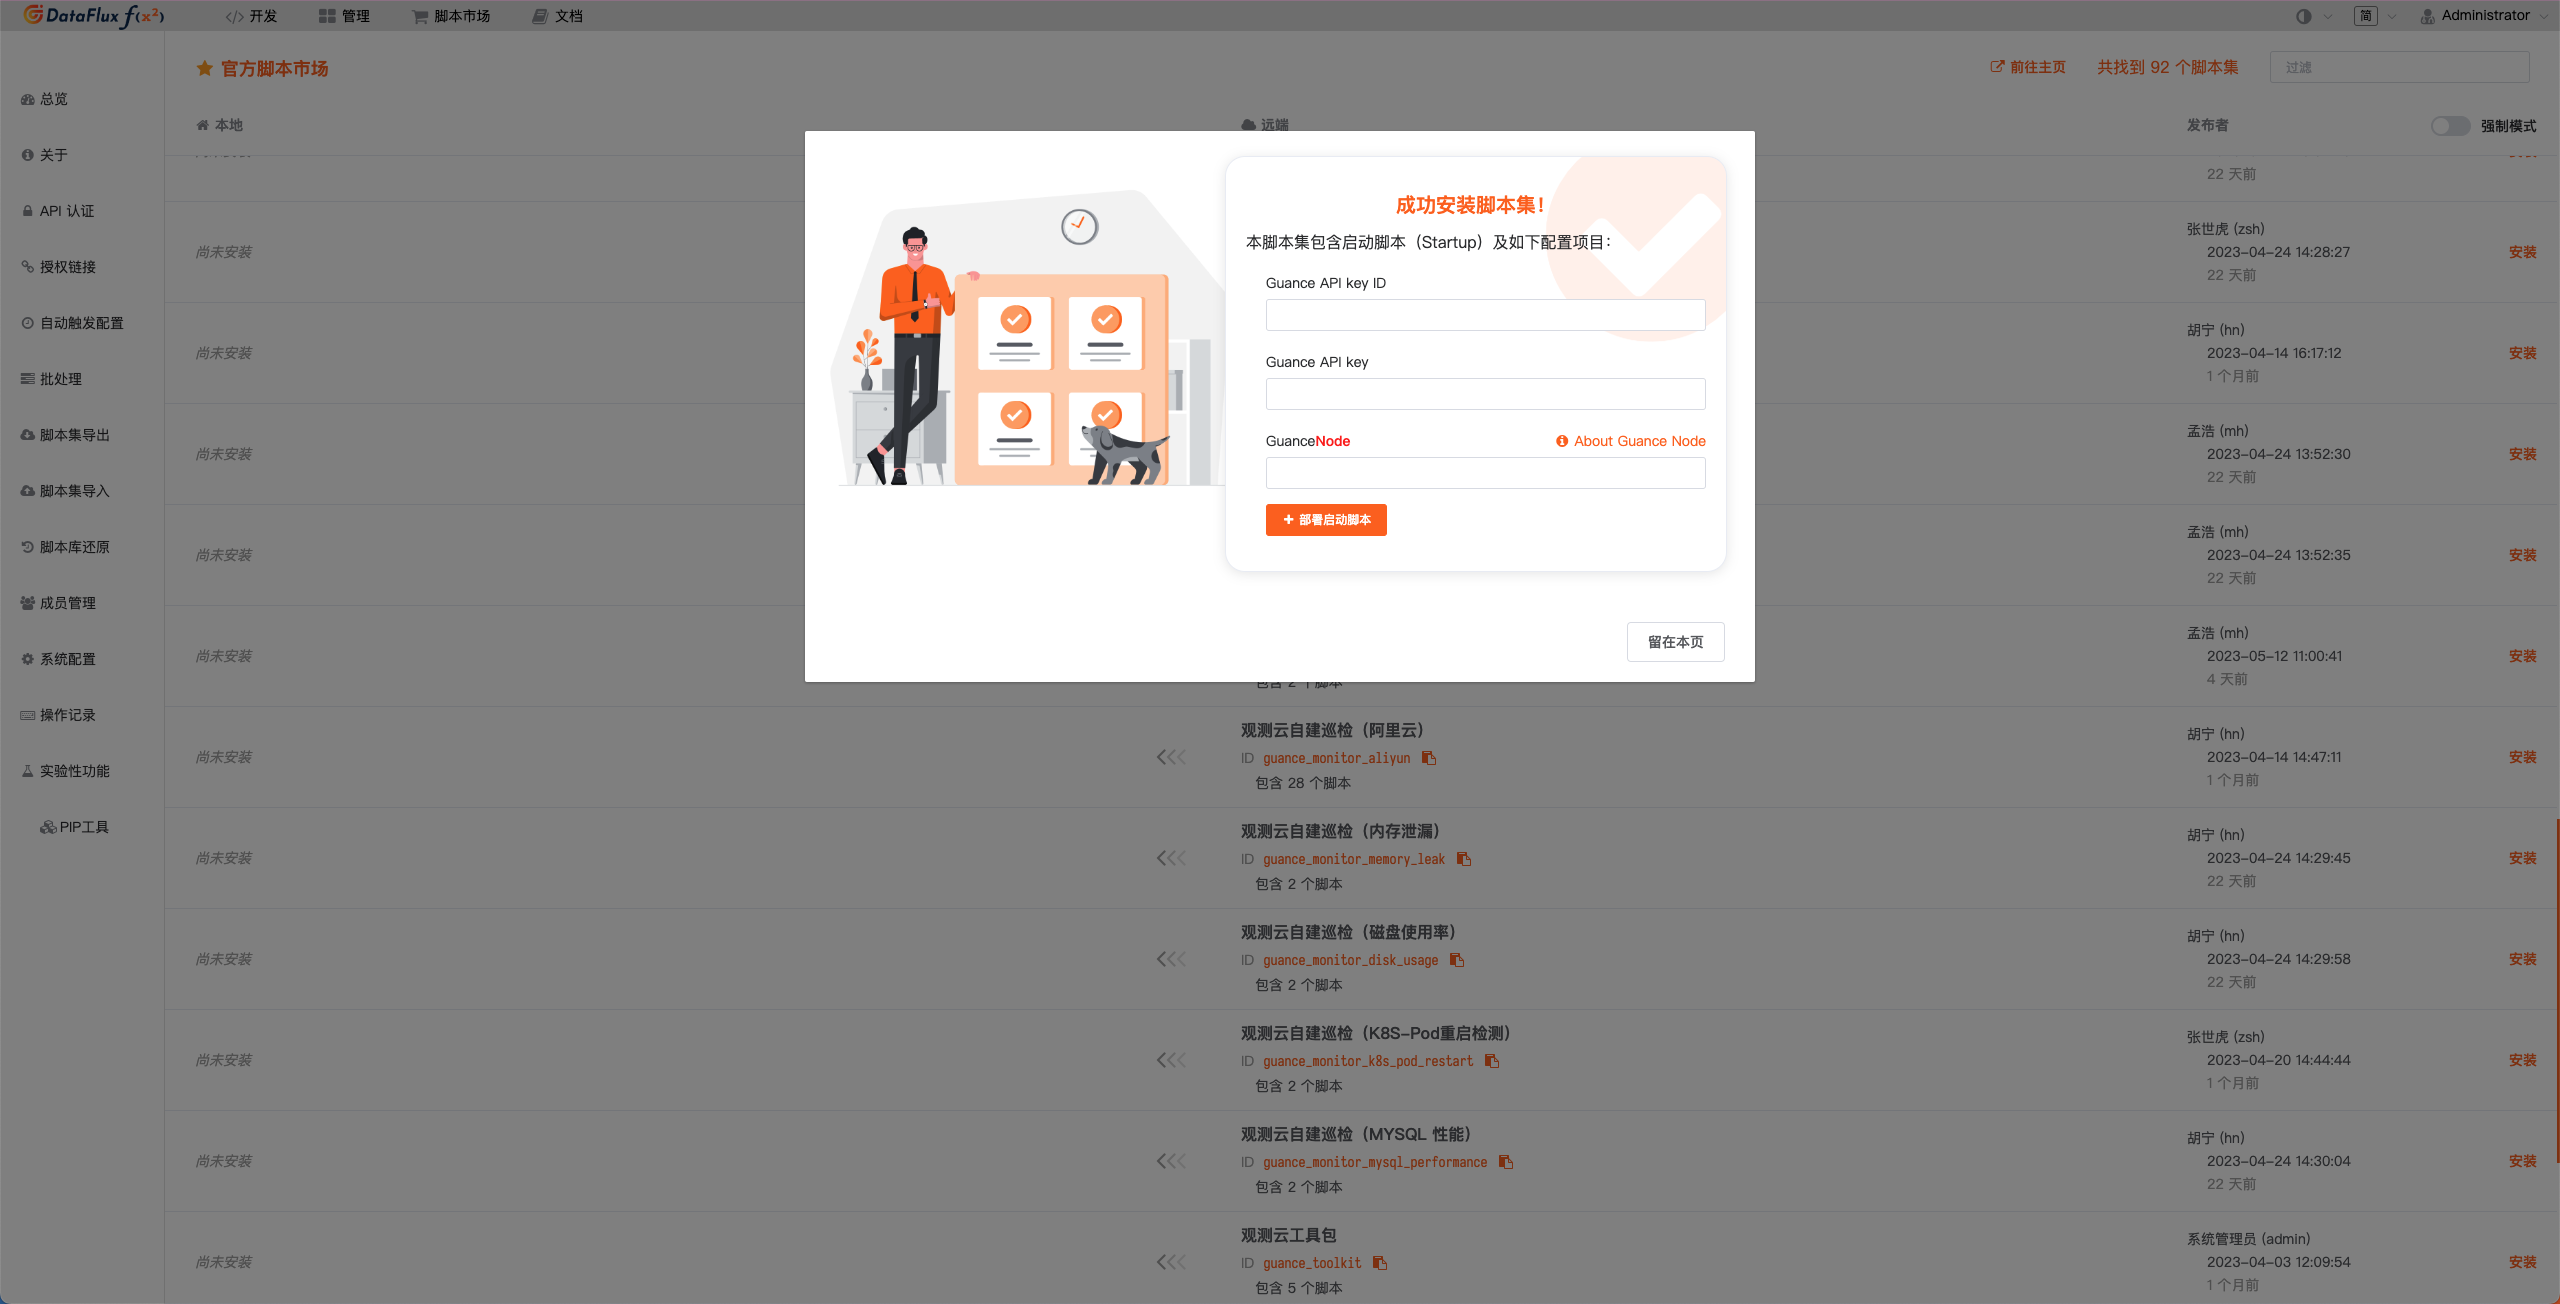
After successfully deploying the startup script, it will automatically create the startup script and automatic trigger configuration, accessible via the provided link.
Configure Inspection
In the Guance studio Monitoring - Intelligent Inspection module or in the startup script automatically created by DataFlux Func, configure the desired filtering conditions for the inspection. Below are two possible configuration methods.
Configuration in Guance
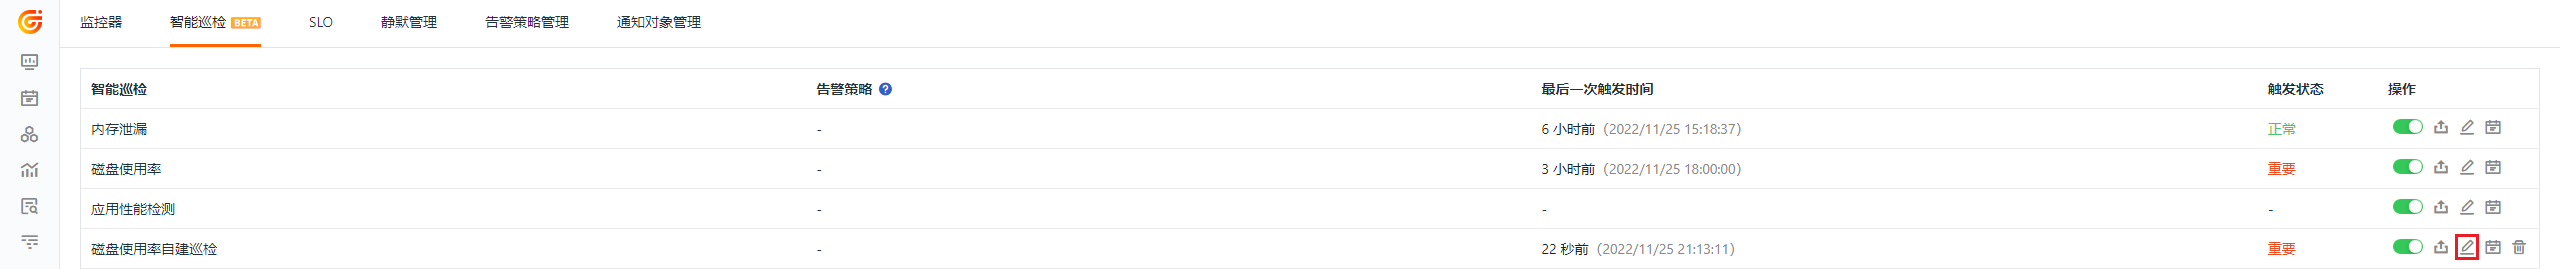
Enable/Disable
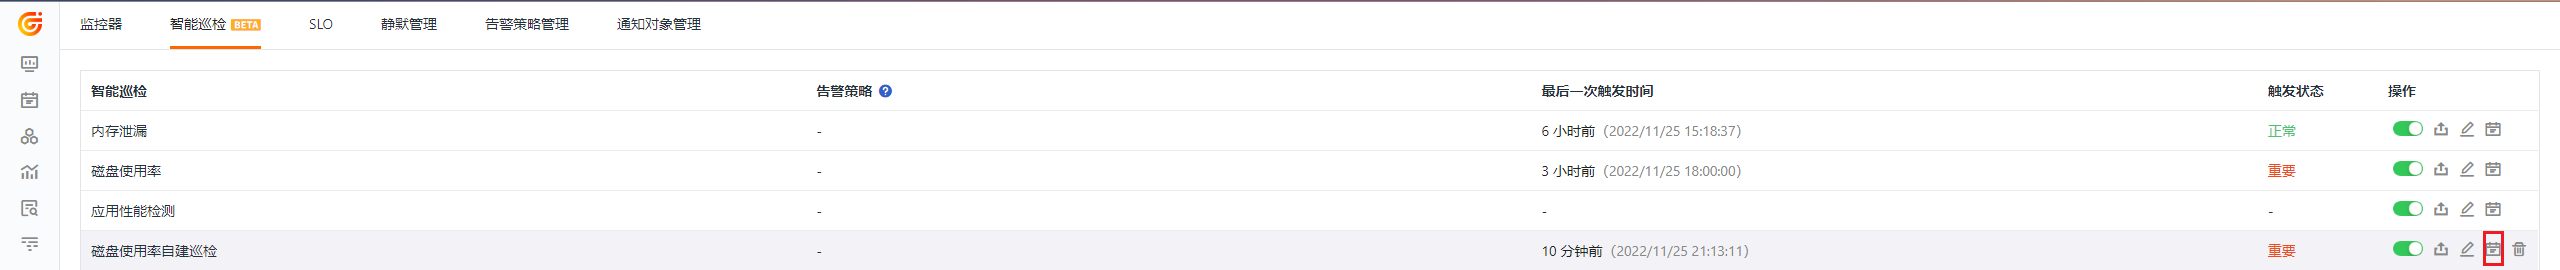
Disk usage inspection is enabled by default. It can be manually disabled. Once enabled, it will inspect the configured list of hosts.
Edit
The intelligent inspection "Disk Usage Inspection" supports manual addition of filtering conditions. Under the operation menu on the right side of the intelligent inspection list, click the Edit button to modify the inspection template.
- Filtering Conditions: Configure the hosts that need inspection.
- Alert Notifications: Supports selection and editing of alert strategies, including event severity levels, notification targets, and alert silence periods.
To configure entry parameters, click Edit and fill in the corresponding detection objects in the parameter configuration section, then save to begin inspection:
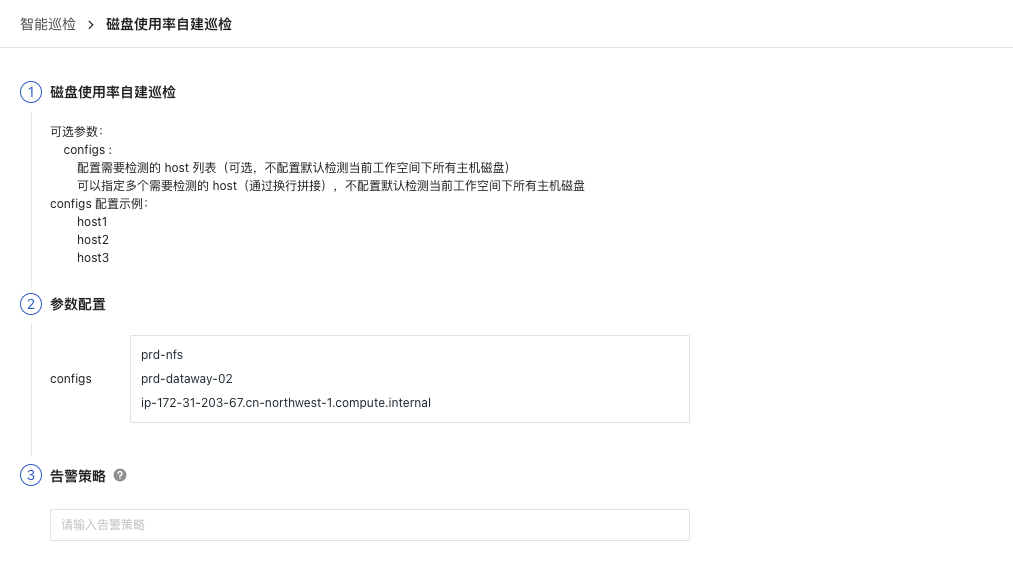
You can reference the following configuration for multiple hosts:
Note: In the self-built DataFlux Func, when writing custom inspection handling functions, you can also add filtering conditions (refer to sample code configurations). However, note that parameters configured in Guance studio will override those set in the custom inspection handling function.
Configuration in DataFlux Func
In DataFlux Func, after configuring the required filtering conditions for the inspection, you can test by directly selecting the run() method on the page and clicking Run. After publishing, the script will execute normally. You can also view or change the configuration in Guance "Monitoring / Intelligent Inspection".
from guance_monitor__register import self_hosted_monitor
from guance_monitor__runner import Runner
import guance_monitor_disk_usage__main as disk_usage_check
def filter_host(host):
'''
Filter host by defining custom conditions that meet the requirements. If a match is found, return True. If no match is found, return False.
return True | False
'''
if host == "iZuf609uyxtf9dvivdpmi6z":
return True
@self_hosted_monitor(account['api_key_id'], account['api_key'])
@DFF.API('Self-built Disk Usage Inspection', fixed_crontab='0 */6 * * *', timeout=900)
def run(configs=None):
'''
Optional Parameters:
configs :
List of hosts to be inspected (optional; if not configured, defaults to inspecting all host disks in the current workspace).
Multiple hosts can be specified (separated by line breaks); if not configured, defaults to inspecting all host disks in the current workspace.
Example configs:
          host1
          host2
          host3
'''
checkers = [
disk_usage_check.DiskUsageCheck(configs=configs, filters=[filter_host]), # Support for user-configured multiple filtering functions executed sequentially.
]
Runner(checkers, debug=False).run()
View Events
This inspection scans disk usage information from the last 14 days. If it predicts that disk usage will exceed the warning threshold within the next 48 hours, the intelligent inspection generates corresponding events. Under the operation menu on the right side of the intelligent inspection list, click the View Related Events button to view corresponding abnormal events.
Event Details Page
Click Event, to view the details page of the intelligent inspection event, including event status, time of anomaly occurrence, anomaly name, basic attributes, event details, alert notifications, historical records, and related events.
- Click the small icon in the top-right corner of the details page labeled "View Monitor Configuration" to view and edit the current intelligent inspection configuration details.
Basic Attributes
- Detection Dimensions: Based on the filtering conditions configured for intelligent inspection, supports copying
key/valuedimensions, adding to filters, and viewing related logs, containers, processes, security checks, traces, user analysis, synthetic tests, and CI data. - Extended Attributes: After selecting extended attributes, supports copying in
key/valueformat and performing forward/reverse filtering.
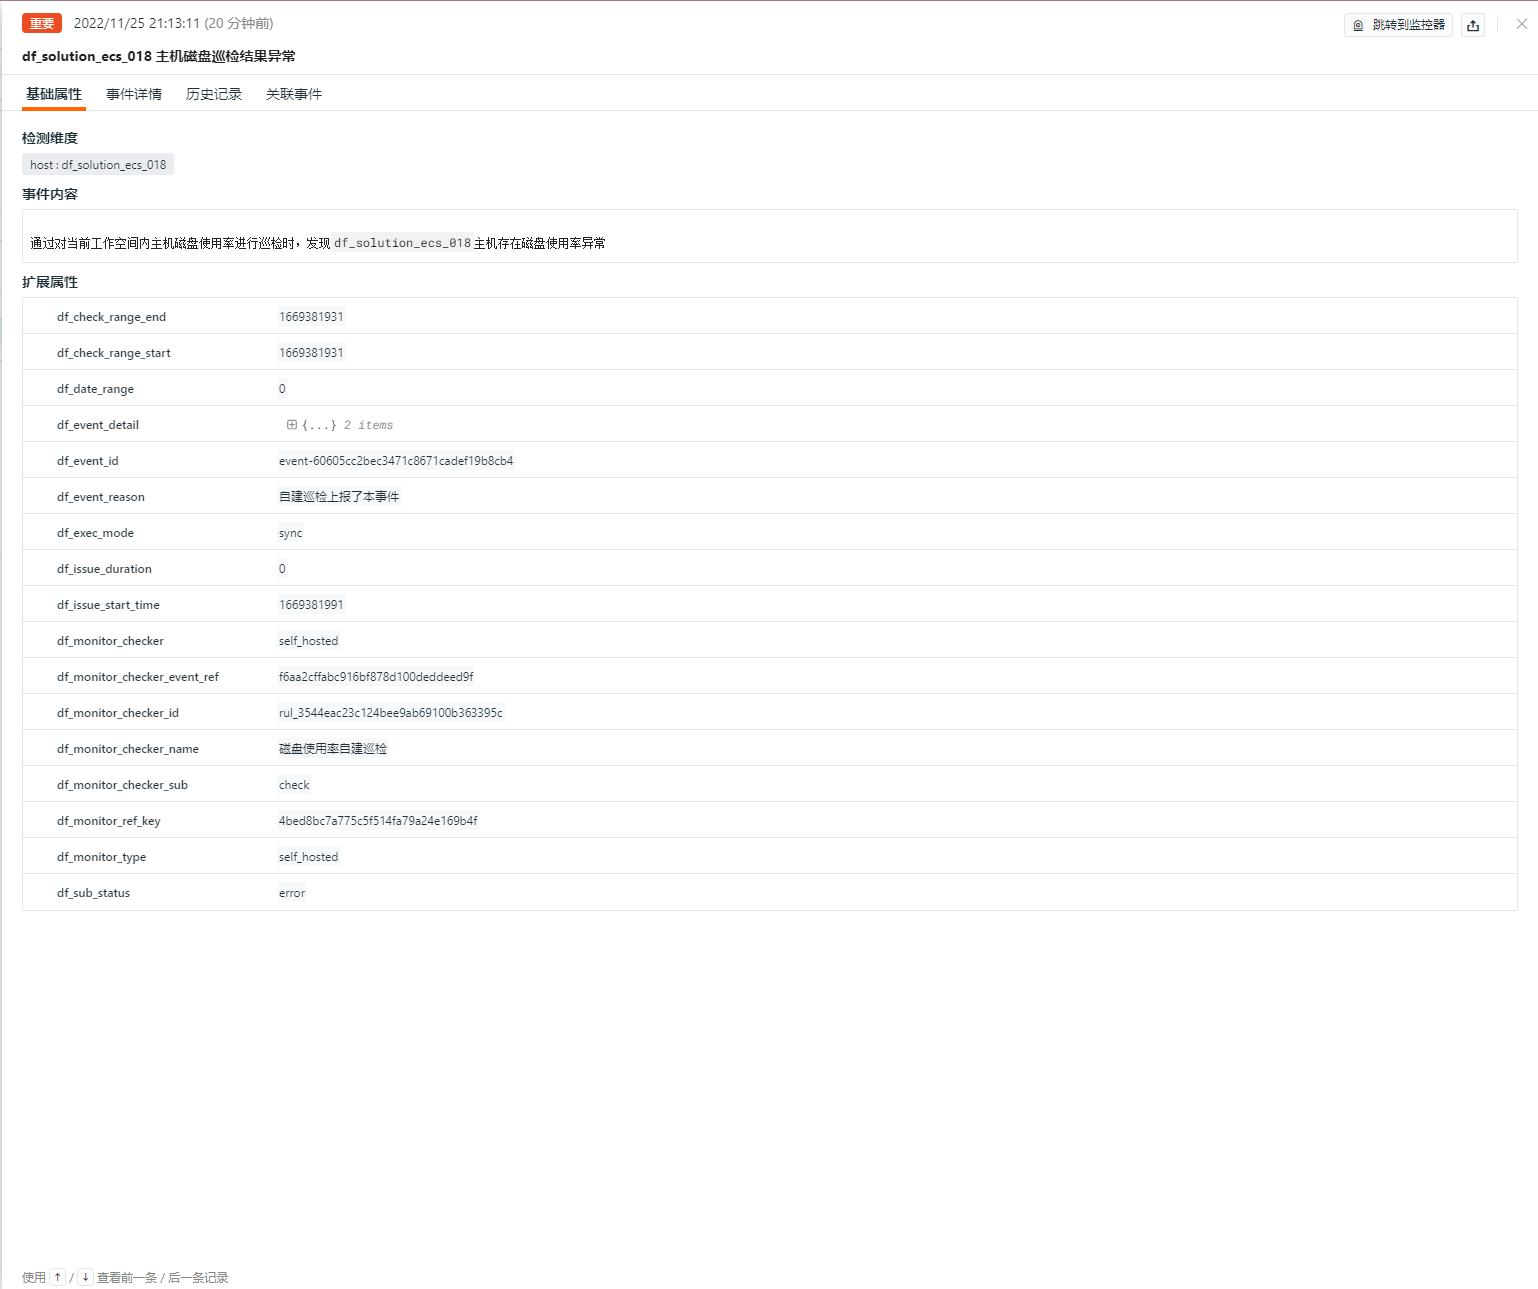
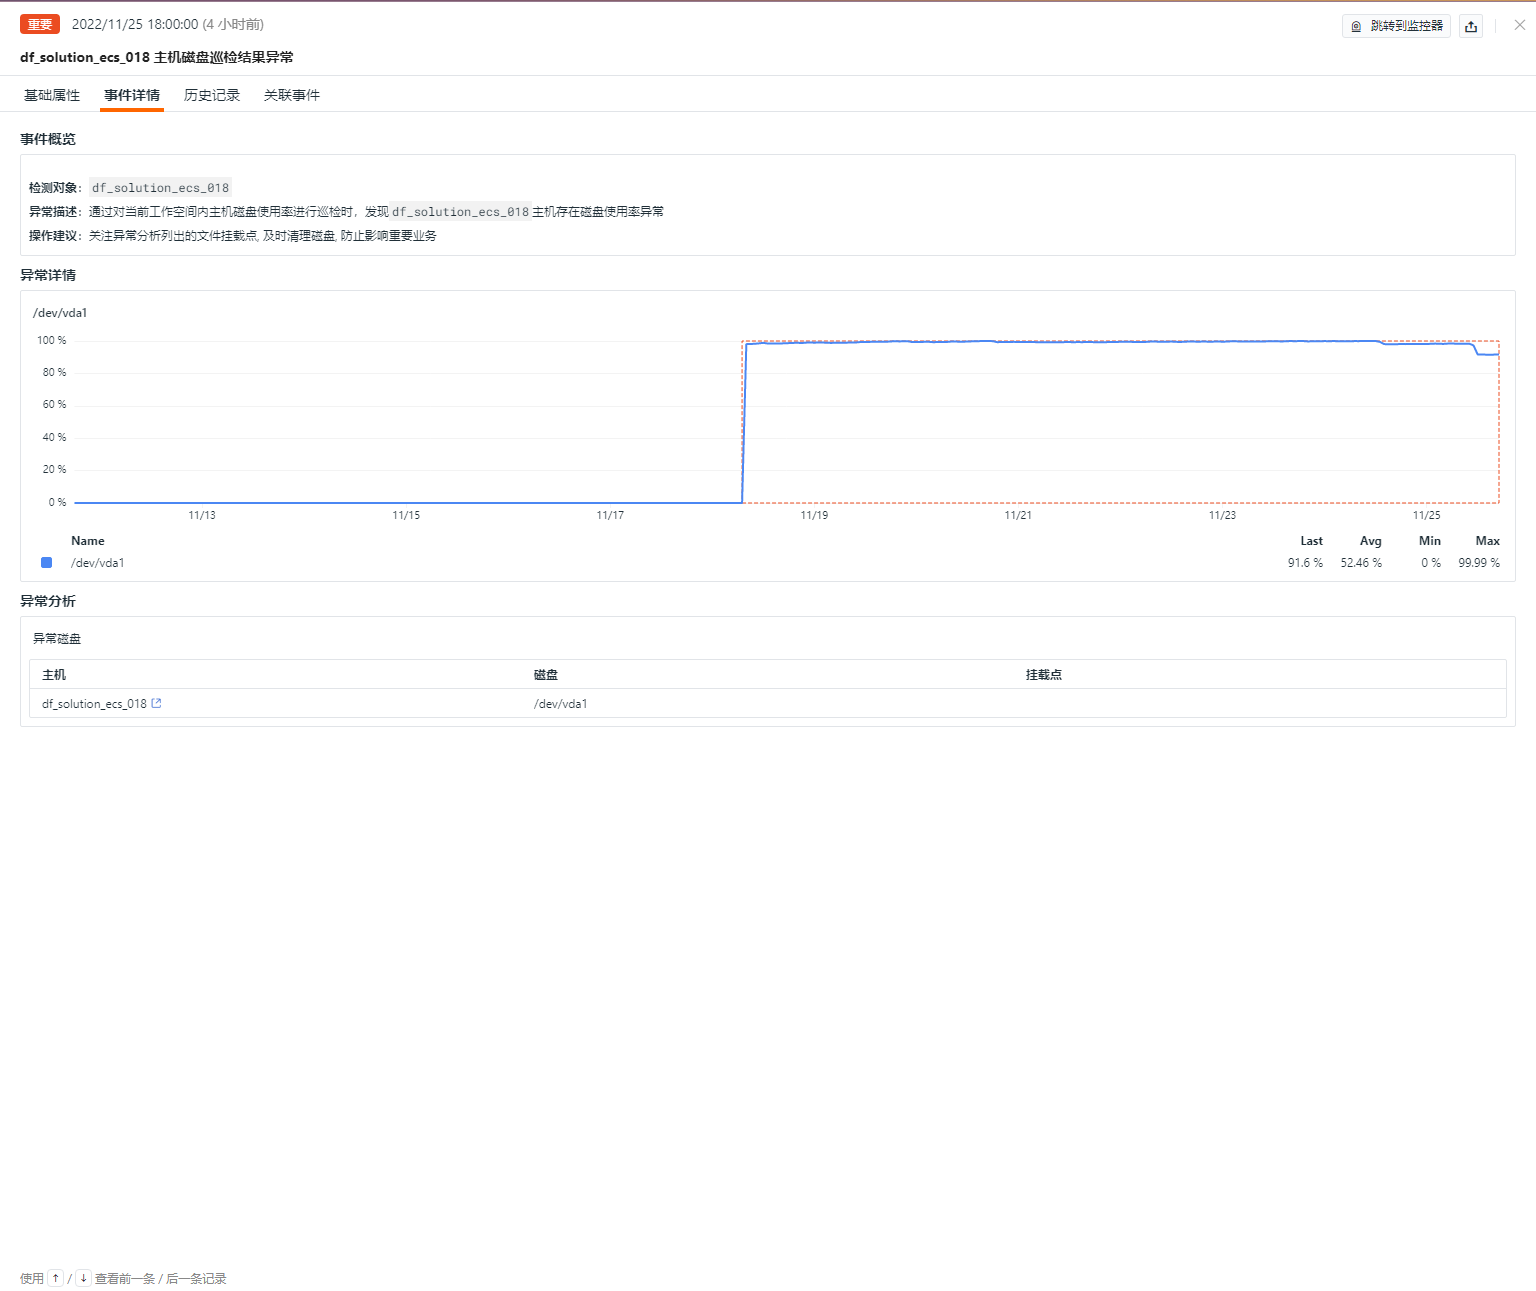
Event Details
- Event Overview: Describes the object and content of the abnormal inspection event.
- Anomaly Details: Displays the disk usage for the last 14 days of the currently abnormal disk.
- Anomaly Analysis: Displays the host, disk, and mount point information to help analyze specific issues.
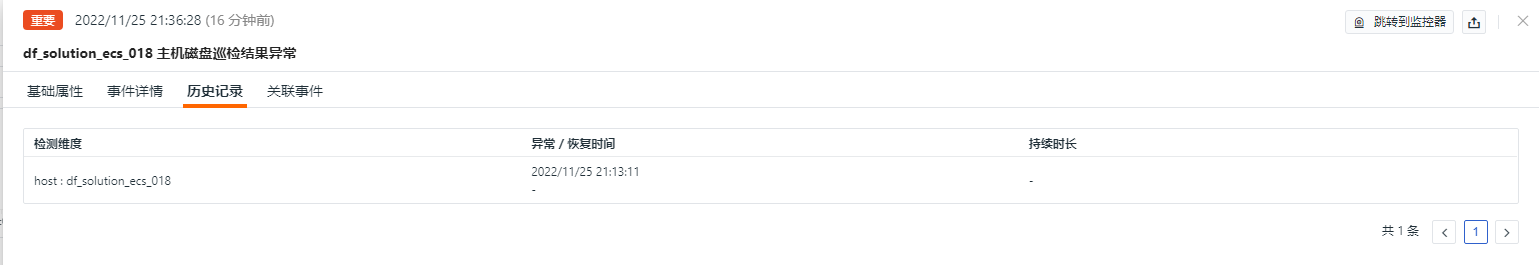
Historical Records
Supports viewing the detection object, anomaly/recovery times, and duration.
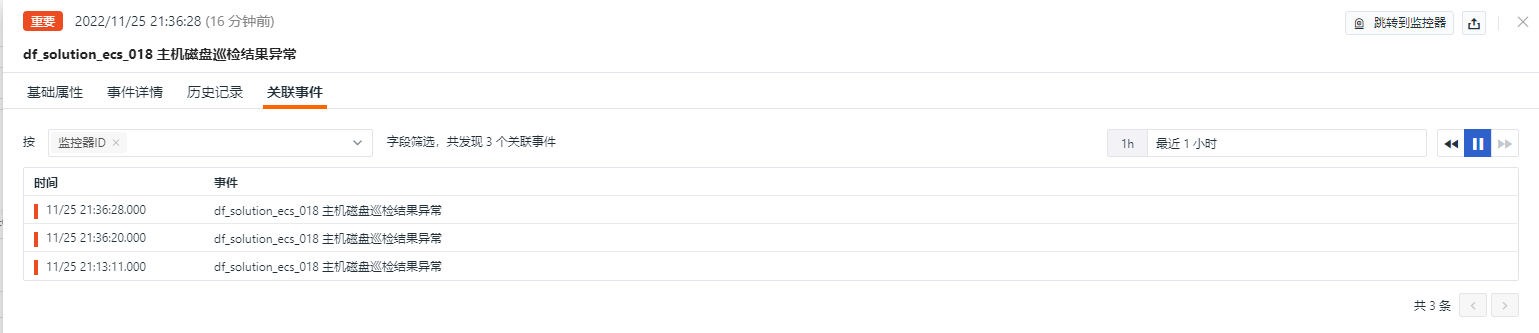
Related Events
Supports viewing related events through filtering fields and selected time component information.
Common Issues
1. How to configure the inspection frequency for disk usage inspection
- In the self-built DataFlux Func, when writing the custom inspection handling function, add
fixed_crontab='0 */6 * * *', timeout=900in the decorator, then configure it in "Manage / Automatic Trigger Configuration."
2. Why might there be no anomaly analysis when disk usage inspection triggers
If there is no anomaly analysis in the inspection report, please check the data collection status of the current datakit.
3. During inspection, previously normal scripts may throw errors
Please update the referenced script sets in the DataFlux Func Script Market. You can use the Change Log to view the update history of the script market for timely updates.
4. During the upgrade process of the inspection script, why does the corresponding script set in Startup remain unchanged
First delete the corresponding script set, then click the upgrade button to configure the corresponding Guance API key to complete the upgrade.
5. How to determine if the inspection has taken effect after enabling
In "Manage / Automatic Trigger Configuration," check the status of the corresponding inspection. First, it should be enabled, then verify the inspection script by clicking Execute. If the message indicates successful execution X minutes ago, the inspection is running properly.